Muscle: the Primary Stabilizer and Mover of the Skeletal System
MUSCLE AS A SKELETAL STABILIZER: GENERATING AN APPROPRIATE AMOUNT OF FORCE AT A GIVEN LENGTH
Introduction to the Structural Organization of Skeletal Muscle
Muscle and Tendon: Generation of Force
Isometric Muscle Force: Development of the Internal Torque–Joint Angle Curve
MUSCLE AS A SKELETAL MOVER: FORCE MODULATION
Modulating Force through Concentric or Eccentric Activation: Introduction to the Force-Velocity Relationship of Muscle
INTRODUCTION TO ELECTROMYOGRAPHY
CAUSES OF MUSCLE FATIGUE IN HEALTHY PERSONS
CHANGES IN MUSCLE WITH STRENGTH TRAINING, REDUCED USE, AND ADVANCED AGE
• How muscle stabilizes bones by generating an appropriate amount of force at a given length. Muscles generate force passively (i.e., by a muscle’s resistance to stretch) and, to a much greater extent, actively (i.e., by active contraction).
• The ways in which muscle modulates or controls force so that bones move smoothly and forcefully. Normal movement is highly regulated and refined, regardless of the infinite environmental constraints imposed on a given task.
• The use of electromyography (EMG) in the study of kinesiology.
• Basic mechanisms of muscle fatigue.
• Adaptations of muscle in strength training, immobilization, and advanced age.
MUSCLE AS A SKELETAL STABILIZER: GENERATING AN APPROPRIATE AMOUNT OF FORCE AT A GIVEN LENGTH
Understanding the special role of muscle in generating stabilizing forces begins with an introduction of the muscle fiber: the basic structural unit of muscle. This topic is followed by discussion of how muscle morphology and muscle-tendon architecture affect the range of force transferred to bone. The function of muscle is explored with regard to how it produces passive tension from being elongated (or stretched) or active force as it is stimulated, or “activated,” by the nervous system. The relation between muscle force and length and how this influences the isometric torque generated about a joint are then examined. Box 3-1 is a summary of the major concepts addressed in this section.
Introduction to the Structural Organization of Skeletal Muscle
Whole muscles throughout the body, such as the biceps or quadriceps, consist of many individual muscle fibers, ranging in thickness from about 10 to 100 µm and in length from about 1 to 50 cm.109 The structural relationship between a muscle fiber and the muscle belly is shown in Figure 3-1. Each muscle fiber is actually an individual cell with multiple nuclei. Contraction or shortening of the individual muscle fiber is ultimately responsible for contraction of a whole muscle.
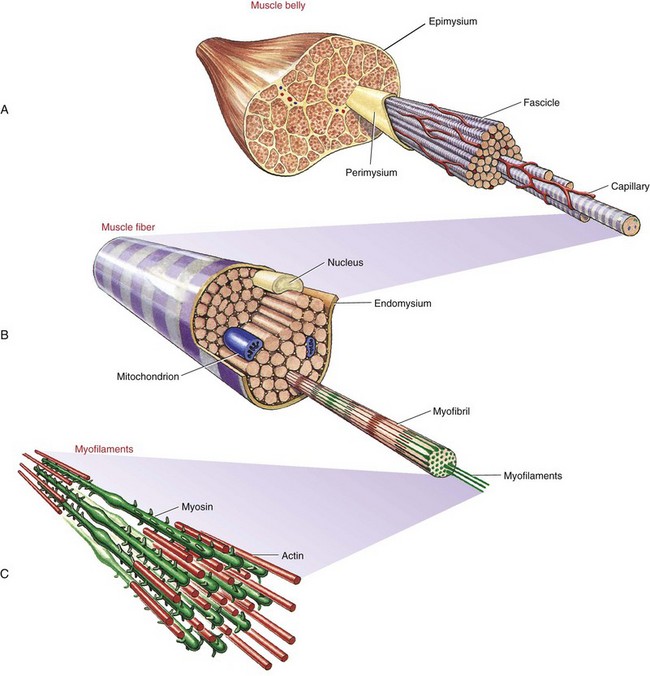
Extracellular connective tissues within muscle are divided into three sets: epimysium, perimysium, and endomysium. Figure 3-1 shows these tissues as they surround the various components of muscle—from the muscle belly to the very small active proteins. The epimysium is a tough structure that surrounds the entire surface of the muscle belly and separates it from other muscles. In essence, the epimysium gives form to the muscle belly. The epimysium contains tightly woven bundles of collagen fibers that are resistive to stretch. The perimysium lies beneath the epimysium and divides muscle into fascicles (i.e., groups of fibers) that provide a conduit for blood vessels and nerves. This connective tissue, like epimysium, is tough and relatively thick and resistive to stretch. The endomysium surrounds individual muscle fibers, immediately external to the sarcolemma (cell membrane). The endomysium marks the location of the metabolic exchange between muscle fibers and capillaries.95 This delicate tissue is composed of a relatively dense meshwork of collagen fibers that are partly connected to the perimysium. Through lateral connections from the muscle fiber, the endomysium conveys part of the muscle’s contractile force to the tendon.
Muscle fibers within a muscle may be of varying length, with some extending from tendon to tendon and others only a fraction of this distance. Extracellular connective tissues help interconnect individual muscle fibers and therefore help transmit contractile forces throughout the entire length of the muscle.65 Although the three sets of connective tissues are described as separate entities, they are interwoven as a continuous sheet of tissue. This arrangement confers strength, support, and elasticity to the whole muscle. Box 3-2 provides a summary of the functions of extracellular connective tissues within muscle.
Muscle Morphology
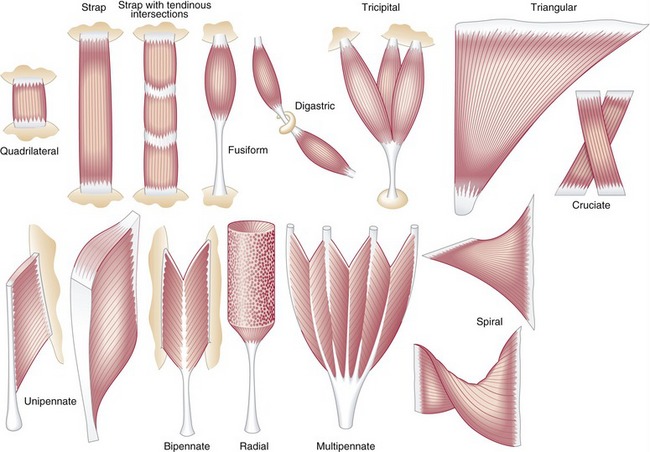
Muscle morphology describes the basic shape of a whole muscle. Muscles have many shapes, which influence their ultimate function (Figure 3-2). Two of the most common shapes are fusiform and pennate (from the Latin penna, meaning feather). Fusiform muscles, such as the biceps brachii, have fibers running parallel to one another and to the central tendon. Pennate muscles, in contrast, possess fibers that approach their central tendon obliquely. For reasons described in the next section, pennate muscles contain a larger number of fibers and therefore generate relatively large forces. Most muscles in the body are considered pennate and may be further classified as unipennate, bipennate, or multipennate, depending on the number of similarly angled sets of fibers that attach into the central tendon.
Muscle Architecture
Pennation angle refers to the angle of orientation between the muscle fibers and tendon (Figure 3-3). If muscle fibers attach parallel to the tendon, the pennation angle is defined as 0 degrees. In this case essentially all of the force generated by the muscle fibers is transmitted to the tendon and across a joint. If, however, the pennation angle is greater than 0 degrees (i.e., oblique to the tendon), then less of the force produced by the muscle fiber is transmitted longitudinally through the tendon. Theoretically, a muscle with a pennation angle of 0 degrees transmits 100% of its contractile force through the tendon, whereas the same muscle with a pennation angle of 30 degrees transmits 86% of its force through the tendon. (The cosine of 30 degrees is 0.86.) Most human muscles have pennation angles that range from 0 to 30 degrees.65
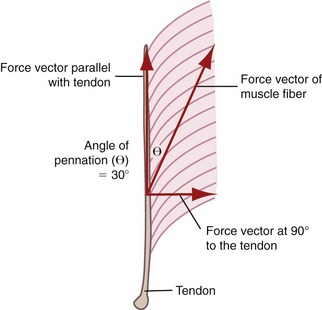
FIGURE 3-3. Unipennate muscle is shown with its muscle fibers oriented at a 30-degree pennation angle (θ).
In general, pennate muscles produce greater maximal force than fusiform muscles of similar volume. By orienting fibers obliquely to the central tendon, a pennate muscle can fit more fibers into a given length of muscle. This space-saving strategy provides pennate muscles with a relatively large physiologic cross-sectional area and hence a relatively large capability for generating high force. Consider, for example, the multipennate gastrocnemius muscle, which must generate very large forces during jumping. The reduced transfer of force from the pennate fiber to the tendon, because of the greater pennation angle, is small compared with the large force potential gained in physiologic cross-sectional area. As shown in Figure 3-3, a pennation angle of 30 degrees still enables the fibers to transfer 86% of their force through to the long axis of the tendon.
SPECIAL FOCUS 3-1  Method for Estimating the Maximal Force Potential of Muscle
Specific force of skeletal muscle is defined as the maximum amount of active force produced per unit physiologic cross-sectional area. This value is typically expressed in units such as newtons per square meter (N/m2) or pounds per square inch (lb/in2). The specific force of human muscle is difficult to estimate, but studies indicate values between 15 and 60 N/cm2 or, on average, 30 N/cm2 (about 45 lb/in2).26 This large variability likely reflects the technical difficulty in measuring a person’s true physiologic cross-sectional area, in addition to differences in fiber type composition across persons and muscles.39 Generally, a muscle with a higher proportion of fast twitch fibers can have a slightly higher specific force than a muscle with a higher proportion of slow twitch fibers.
The striking difference in maximal force potential in the two aforementioned muscles is not surprising considering their very different functional roles. Normally the demands on the quadriceps are large—this muscle is used routinely to lift much of the weight of the body against gravity. The architecture of the quadriceps significantly affects the amount of force that is transmitted through its tendon and ultimately to the skeleton across the knee. Assuming the quadriceps has an average angle of pennation of about 30 degrees, the maximal force expected to be transmitted through the tendon and across the knee would be about 4676 N (cosine 30 degrees × 5400 N), or 1051 lb. Although the magnitude of this force may seem implausible, it is actually within reason. Expressing this force in terms of torque may be more meaningful for the clinician who regularly works with strength-testing devices that measure knee extension strength. Assuming the quadriceps has a knee extensor moment arm of 4 cm,61 the best estimate of the maximal knee extensor torque would be about 187 Nm (0.04 m × 4676 N)—a value that certainly falls within the range reported in the literature for an adult healthy male.36,109
Muscle and Tendon: Generation of Force
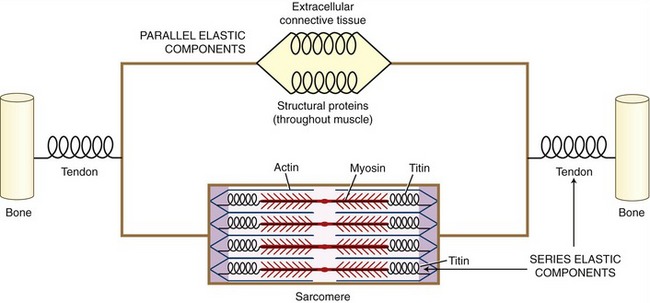
On stimulation from the nervous system, the contractile (active) proteins within the sarcomeres cause a contraction or shortening of the entire muscle. These proteins—most notably actin and myosin—are physically supported by structural proteins, plus a network of other noncontractile extracellular connective tissues, namely, the epimysium, perimysium, endomysium. For functional rather than anatomic purposes, these noncontractile tissues have been described as parallel and series elastic components of muscle (Figure 3-4). Series elastic components are tissues that lie in series with the active proteins. Examples of these tissues are the tendon and large structural proteins, such as titin. The parallel elastic components, in contrast, are tissues that surround or lie in parallel with the active proteins. These noncontractile tissues include the extracellular connective tissues (such as the perimysium) and a family of other structural proteins that surround and support the muscle fiber.
When the parallel and series elastic components are stretched within a muscle, a generalized passive length-tension curve is generated (Figure 3-5). The curve is similar to that obtained by stretching a rubber band. Approximating the shape of an exponential mathematic function, the passive elements within the muscle begin generating passive tension after a critical length at which all of the relaxed (i.e., slack) tissue has been brought to an initial level of tension. After this critical length has been reached, tension progressively increases until the muscle reaches levels of very high stiffness. At even higher tension, the tissue eventually ruptures, or fails.
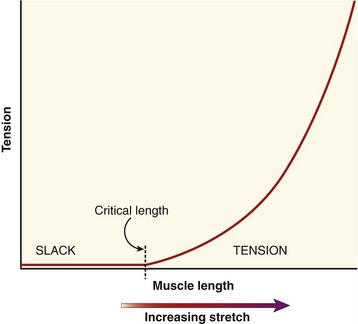
The passive tension in a stretched healthy muscle is attributed to the elastic forces produced by noncontractile elements, such as extracellular connective tissues, the tendon, and structural proteins. These tissues demonstrate different stiffness characteristics. When a muscle is only slightly or moderately stretched, structural proteins (in particular titin62) contribute most of the passive tension within the muscle. When a muscle is more extensively stretched, however, the extracellular connective tissues—especially those that compose the tendon—contribute much of the passive tension.68
Stretched muscle tissue exhibits the property of elasticity because it can temporarily store part of the energy that created the stretch. This stored energy, when released, can augment the overall force potential of a muscle. A stretched muscle also exhibits viscoelastic properties (see Chapter 1) because its passive resistance (stiffness) increases with increased velocity of stretch. Properties of both elasticity and viscoelasticity are important components of plyometric exercise.
Although the stored energy in a moderately stretched muscle may be relatively slight when compared with the full force potential of the muscle, it may help prevent a muscle from being damaged during maximal elongation.69 Elasticity therefore can serve as a damping mechanism that protects the structural components of the muscle and tendon.
ACTIVE LENGTH-TENSION CURVE
Muscle tissue is uniquely designed to generate force actively (i.e., volitionally) in response to a stimulus from the nervous system. This section of the chapter describes the means by which a muscle generates active force. Active force is produced by an activated muscle fiber, that is, one that is being stimulated by the nervous system to contract. As diagramed in Figure 3-4, both active force and passive tension are ultimately transmitted to the bones that constitute the joint.
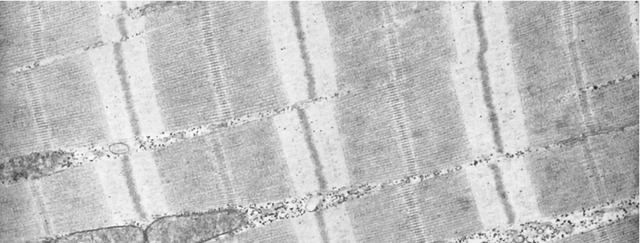
Muscle fibers are composed of many tiny strands called myofibrils (see Figure 3-1). Myofibrils contain the contractile (active) proteins of the muscle fiber and have a distinctive structure. Each myofibril is 1 to 2 µm in diameter and consists of many myofilaments. The two most important myofilaments within the myofibril are the proteins actin and myosin. As will be described, muscle contraction involves a complex physiologic and mechanical interaction between these two proteins. The regular organization of these filaments produces the characteristic banded appearance of the myofibril as seen under the microscope (Figure 3-6). The repeating functional subunits of the myofibril are the sarcomeres (Figure 3-7). The dark band within a single sarcomere, also called the A band, correspond to the presence of myosin—thick filaments. Myosin also contains projections, called myosin heads, which are arranged in pairs (Figure 3-8). The light bands, also called I bands, contain actin—thin filaments (see Figure 3-7). In a resting muscle fiber, actin filaments partially overlap the myosin filaments. Under an electron microscope, the bands reveal a more complex pattern that consists of an H band, M line, and Z discs (defined in Table 3-1). Actin and myosin are aligned within the sarcomere with the help of structural proteins, providing mechanical stability to the fiber during contraction and stretch.62,105 By way of the structural proteins and the endomysium, myofibrils ultimately connect with the tendon. This elegant connective web, formed between the proteins and connective tissues, allows force to be distributed longitudinally and laterally within a muscle.74,75
TABLE 3-1.
Defined Regions within a Sarcomere
| Region | Description |
| A band | Dark bands caused by the presence of thick myosin myofilaments. |
| I bands | Light bands caused by the presence of thin actin myofilaments. |
| H band | Region within A band where actin and myosin do not overlap. |
| M line | Midregion thickening of thick myosin myofilaments in the center of H band. |
| Z discs | Connecting points between successive sarcomeres. Z discs help anchor the thin actin myofilaments. |
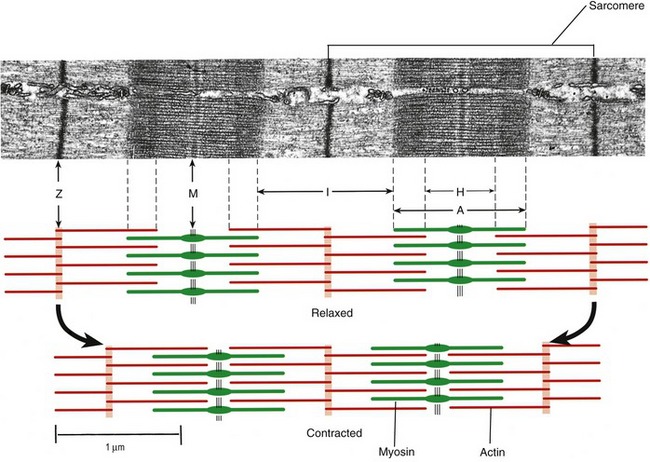
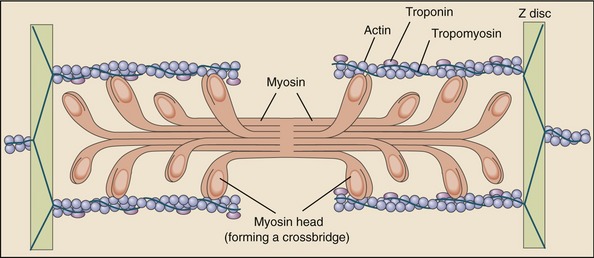
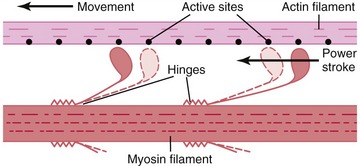
As described earlier, the sarcomere is the fundamental active force generator within the muscle fiber. Understanding the contractile events that take place in an individual sarcomere provides the basis for understanding the contraction process across the entire muscle. The contraction process is simply repeated from one sarcomere to the next. The model for describing active force generation within the sarcomere is called the sliding filament hypothesis and was developed independently by Hugh Huxley54 and Andrew Huxley (no relation).53 In this model, active force is generated as actin filaments slide past myosin filaments, causing approximation of the Z discs and narrowing of the H band. This action results in a progressive overlap of the actin and myosin filaments, which, in effect, produces a shortening of each sarcomere, although the active proteins themselves do not actually shorten (Figure 3-9). Each myosin head attaches to an adjacent actin filament, forming a crossbridge. The amount of force generated within each sarcomere therefore depends on the number of simultaneously formed crossbridges. The greater the number of crossbridges, the greater the force generated within the sarcomere.
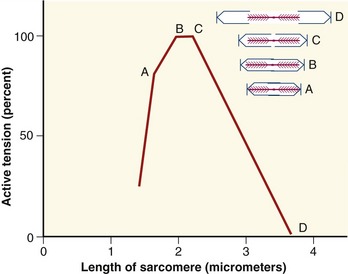
As a consequence of the arrangement between the actin and myosin within a sarcomere, the amount of active force depends, in part, on the instantaneous length of the muscle fiber. A change in fiber length—from either active contraction or passive elongation—alters the amount of overlap between actin and myosin. The active length-tension curve for a sarcomere is presented in Figure 3-10. The ideal resting length of a muscle fiber (or individual sarcomere) is the length that allows the greatest number of crossbridges and therefore the greatest potential force. As the sarcomere is lengthened or shortened from its resting length, the number of potential crossbridges decreases so that lesser amounts of active force are generated, even under conditions of full activation or effort. The resulting active length-tension curve is described by an inverted U-shape with its peak at the ideal resting length.
The term length-force relationship is more appropriate for considering the terminology established in this text (see definitions of force and tension in the glossary of Chapter 1). The phrase length-tension is used, however, because of its wide acceptance in the physiology literature.
SPECIAL FOCUS 3-2  Muscle Proteins: an Expanding Area of Study for Muscle Physiologists
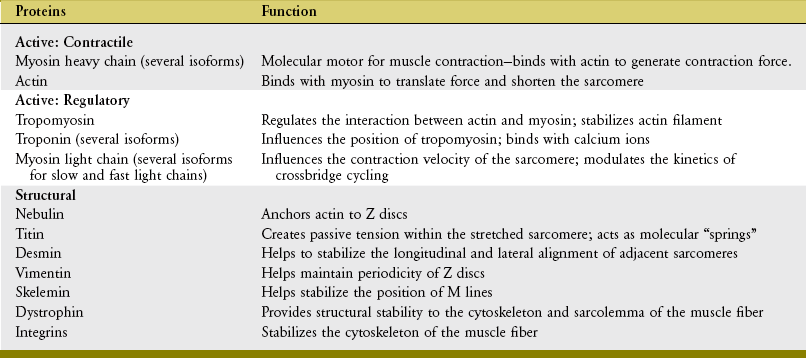
Thus far this chapter has focused primarily on the active proteins of actin and myosin within the sarcomere. More advanced study of this topic, however, reveals a far more complicated picture. Myosin, for example, is further classified into heavy chain or light chain proteins, with differing functions. The light chain myosin appears to have a more regulatory role in the contraction process, as do the proteins tropomyosin and troponin. Furthermore, other proteins serve an important structural or supportive role within or between the sarcomeres. The importance of these noncontractile proteins has been realized in recent decades. The information contained in Table 3-2 is intended primarily as background material and summarizes the most likely function of the more commonly studied muscle proteins. The interested reader may consult other sources for more detail on this topic.18
TABLE 3-2.
Summary of Functions of Selected Muscle Proteins
Adapted from Caiozzo VJ, Rourke B: The muscular system: structural and functional plasticity. In Tipton CM, ed: ACSM’s advanced exercise physiology, Philadelphia, 2006, Lippincott Williams & Wilkins.
SUMMATION OF ACTIVE FORCE AND PASSIVE TENSION: THE TOTAL LENGTH-TENSION CURVE
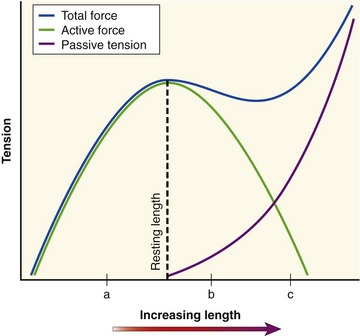
The active length-tension curve, when combined with the passive length-tension curve, yields the total length-tension curve of muscle. The combination of active force and passive tension allows for a large range of muscle forces over a wide range of muscle length. Consider the total length-tension curve for the muscle shown in Figure 3-11. At shortened lengths (a), below active resting length and below the length that generates passive tension, active force dominates the force-generating capability of the muscle. The force continues to rise as the muscle is lengthened (stretched) toward its resting length. As the muscle fiber is stretched beyond its resting length (b), passive tension begins to contribute so that the decrement in active force is offset by increased passive tension, effectively flattening this part of the total length-tension curve. This characteristic portion of the passive length-tension curve allows muscle to maintain high levels of force even as the muscle is stretched to a point at which active force generation is compromised. As the muscle fiber is further stretched (c), passive tension dominates the curve so that connective tissues are under near-maximal stress. High levels of passive tension are most apparent in muscles that are stretched across multiple joints. For example, as the wrist is actively and fully extended, the fingers passively flex slightly because of the stretch placed on the finger flexor muscles as they cross the front of the wrist. The amount of passive tension depends in part on the natural stiffness of the muscle. The shape of the total muscle length-tension curve therefore can vary considerably between muscles of different structure and function.8
Isometric Muscle Force: Development of the Internal Torque–Joint Angle Curve
As defined in Chapter 1, isometric activation of a muscle produces force without a significant change in its length. This occurs naturally when the joint over which an activated muscle crosses is constrained from movement. Constraint often occurs from a force produced by an antagonistic muscle or an external source. Isometrically produced forces provide the necessary stability to the joints and body as a whole. The amplitude of an isometrically produced force from a given muscle reflects a summation of length-dependent active force and passive tension.
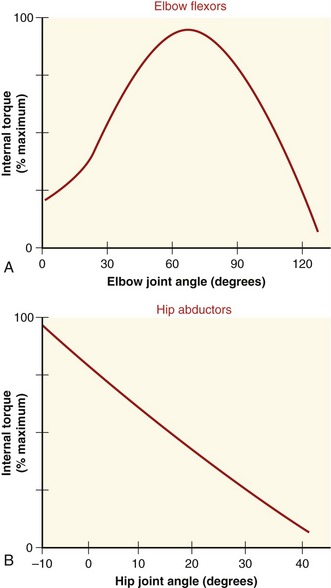
Maximal isometric force of a muscle is often used as a general indicator of a muscle’s peak strength and can indicate neuromuscular recovery after injury.57,84,110 In clinical settings it is not possible to directly measure length or force of maximally activated muscle. However, a muscle’s internal torque generation can be measured isometrically at several joint angles. Figure 3-12 shows the internal torque versus the joint angle curve (so-called “torque-angle curve”) of two muscle groups under isometric, maximal-effort conditions. (The torque-angle curve is the rotational equivalent of the total length-tension curve of a muscle group.) The internal torque produced isometrically by a muscle group can be determined by asking an individual to produce a maximal-effort contraction against a known external torque. As described in Chapter 4, an external torque can be determined by using an external force-sensing device (dynamometer) at a known distance from the joint’s axis of rotation. Because the measurement is performed during an isometric activation, the internal torque is assumed equal to the external torque. When a maximal-strength test is performed in conjunction with considerable encouragement provided by the tester, most healthy adults can achieve near-maximal activation of their muscle. Near-maximal activation is not always possible, however, in persons with pathology or trauma affecting their neuromuscular system.
SPECIAL FOCUS 3-3  Method of Measuring a Person’s Maximal Voluntary Muscle Activation
In normal clinical strength-testing situations, it is difficult to know for certain if a person is actually maximally activating a given muscle, even when maximal effort and good health are assumed. A measure of maximal voluntary activation can be assessed by applying a brief electrical stimulus to the motor nerve or directly over the skin of a muscle while the person is attempting a maximal voluntary contraction. Any increase in measured force that immediately follows the electrical stimulus indicates that not all the muscle fibers were volitionally activated. This technique is known as the interpolated stimulus technique.35 The magnitude of voluntary activation is typically expressed as a percent of a muscle’s maximal activation potential (i.e., neural drive).
Most young healthy adults are able to achieve 95% to 100% of maximal isometric activation of the elbow flexor and dorsiflexors, although these values vary considerably among individuals and trials.5,35 The average level of maximal voluntary isometric activation can also vary among muscles.35 Significantly lower levels of maximal voluntary activation have also been reported in muscles after trauma or disease, such as in the quadriceps muscle after anterior cruciate ligament injury107 or in the diaphragm muscle in persons with asthma.6 Persons with multiple sclerosis have been shown to generate only 86% of maximum voluntary activation of their dorsiflexor muscles, compared with 96% activation in a healthy control group.80
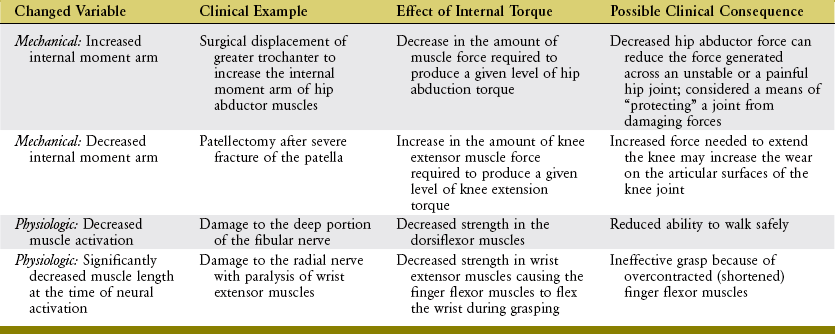
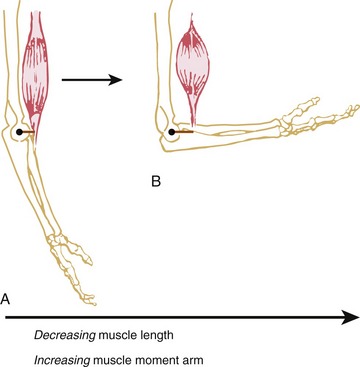
The shape of a maximal-effort torque-angle curve is very specific to each muscle group (compare Figure 3-12, A and B). The shape of each curve can yield important information about the physiologic and mechanical factors that determine the muscle groups’ torque. Consider the following two factors shown in Figure 3-13. First, muscle length changes as the joint angle changes. As previously described, a muscle’s force output—in both active and passive terms—is highly dependent on muscle length. Second, the changing joint angle alters the length of the muscle’s moment arm, or leverage.104 For a given muscle force, a progressively larger moment arm creates a greater torque. Because both muscle length and leverage are altered simultaneously by rotation of the joint, it is not always possible to know which is more influential in determining the final shape of the torque-angle curve. A change in either variable—physiologic or mechanical—alters the clinical expression of a muscular-produced internal torque. Several clinically related examples are listed in Table 3-3.
The torque-angle curve of the hip abductors demonstrated in Figure 3-12, B depends primarily on muscle length, as shown by the linear reduction of maximal torque produced at progressively greater abduction angles of the hip. Regardless of the muscle group, however, the combination of high total muscle force (based on muscle length) and great leverage (based on moment arm length) results in the greatest relative internal torque.
SPECIAL FOCUS 3-4  Exploring the Reasons for the Unique “Signature” of a Muscle Group’s Isometric Torque-Angle Curve
Undoubtedly, the shape of a muscle group’s torque-angle curve is related to the functional demands placed on the muscles and the joint. For the elbow flexors, for example, the maximal internal torque potential is greatest in the midranges of elbow motion and least near full extension and flexion (see Figure 3-12, A). Not coincidentally, in the upright position the external torque caused by gravity acting on the forearm and hand-held objects is also greatest in the midranges of elbow motion and least at the extremes of elbow motion.
For the hip abductor muscles, the internal torque potential is greatest near neutral (0 degrees of abduction) (see Figure 3-12, B). This hip joint angle coincides with the approximate angle at which the hip abductor muscles are most needed for frontal plane stability in the single-limb support phase of walking. Large amounts of hip abduction torque are rarely functionally required in a position of maximal hip abduction.
MUSCLE AS A SKELETAL MOVER: FORCE MODULATION
Modulating Force through Concentric or Eccentric Activation: Introduction to the Force-Velocity Relationship of Muscle
As introduced in Chapter 1, the nervous system stimulates a muscle to generate or resist a force by concentric, eccentric, or isometric activation. During concentric activation, the muscle shortens (contracts). This occurs when the internal (muscle) torque exceeds the external (load) torque. During eccentric activation, the external torque exceeds the internal torque; the muscle is driven by the nervous system to contract but is elongated in response to a more dominating force, usually from an external source or from an antagonist muscle. During an isometric activation, the length of the muscle remains nearly constant, as the internal and external torques are equally matched.
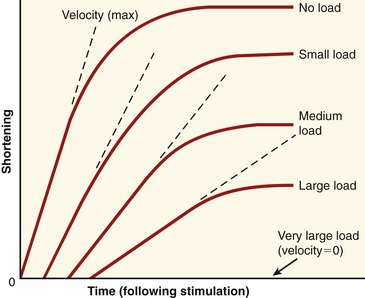
During concentric and eccentric activations, a very specific relationship exists between a muscle’s maximum force output and its velocity of contraction (or elongation). During concentric activation, for example, the muscle contracts at a maximum velocity when the load is negligible (Figure 3-14). As the load increases, the maximal contraction velocity of the muscle decreases. At some point, a very large load results in a contraction velocity of zero (i.e., the isometric state). Eccentric activation needs to be considered separately from concentric activation. With eccentric activation, a load that barely exceeds the isometric force level causes the muscle to lengthen slowly. Speed of lengthening increases as a greater load is applied. There is a maximal load that the muscle cannot resist, and beyond this load level the muscle uncontrollably lengthens.
FORCE-VELOCITY CURVE
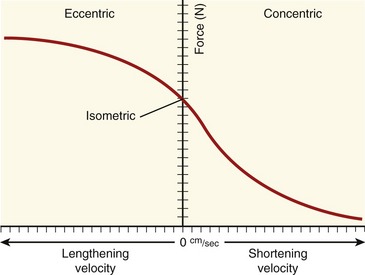
The relationships between the velocity of a muscle’s change in length and its maximum force output are most often expressed by the force-velocity curve plotted in Figure 3-15. This curve is shown during concentric, isometric, and eccentric activations, expressed with the force on the vertical axis and shortening and lengthening velocity of the muscle on the horizontal axis. This force-velocity curve demonstrates several important points about the physiology of muscle. During a maximal-effort concentric activation, the amount of muscle force produced is inversely proportional to the velocity of muscle shortening. This relation was first described by physiologist A.V. Hill in 1938 in skeletal muscle of the frog and is similar for humans.41,42 The reduced force-generating capacity of muscle at higher velocities of contraction results primarily from the inherent limitation in the speed of attachment and reattachment of the crossbridges. At higher velocities of contraction, the number of attached crossbridges at any given time is less than when the muscle is contracting slowly. At a contraction velocity of zero (i.e., the isometric state), a maximum number of attached crossbridges exist within a given sarcomere at any given instant. For this reason, a muscle produces greater force isometrically than at any speed of shortening.
The underlying physiology behind the force-velocity relationship of eccentrically active muscle is very different from that of concentric muscle activation. During a maximal-effort eccentric activation, the muscle force is, to a point, directly proportional to the velocity of the muscle lengthening. For most individuals, however, the curve reaches a zero slope at lower lengthening velocities than that depicted in the theoretic curve of Figure 3-15. Although the reason is not completely understood, most humans (especially untrained) are unable to maximally activate their muscles eccentrically, especially at high velocities.12,106 This may be a protective mechanism to guard against muscle damage produced by excessively large forces.
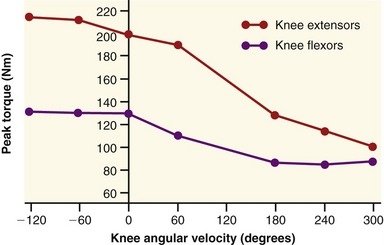
The clinical expression of a force-velocity relationship of muscle is often expressed by a torque-joint angular velocity relationship. This type of data can be derived through isokinetic dynamometry (see Chapter 4). Figure 3-16 shows the peak torque generated by the knee extensor and flexor muscles of healthy men, across a range of muscle shortening and lengthening velocities. Although the two sets of muscles produce different amplitudes of peak torque, each exhibits similar characteristics: maximal-effort torques decrease with increasing velocity of muscle contraction (shortening) and increase (to a point) with increasing velocity of muscle lengthening.
The overall shape of the force-velocity curves shown in Figures 3-15 and 3-16 consistently reflects the fact that muscles produce greater force during eccentric activation than during isometric or any velocity of concentric activation. Although the reason is not well understood, the relatively higher forces produced eccentrically result, in part, from (1) a greater average force produced per crossbridge, as each crossbridge is pulled apart and detached,66 (2) a more rapid reattachment phase of crossbridge formation, and (3) passive tension produced by the viscoelastic properties of the stretched parallel and serial elastic components of the muscle.25 Indirect evidence for the last factor is the well-known phenomenon of delayed onset muscle soreness, which is common after heavy bouts of eccentric muscle-based exercise, especially in untrained persons. One partial explanation for this characteristic soreness is based on strain-related injury to the forcefully (and rapidly) stretched muscle, which includes the myofibrils, cytoskeleton of the sarcomere, and extracellular connective tissues.86
The functional role of eccentrically active muscles is important to the metabolic and neurologic “efficiency” of movement. Eccentrically activated muscle stores energy when stretched; the energy is released only when the elongated muscle contracts. In addition, the ratio of electromyographic amplitude and oxygen consumption per force level is less for eccentrically activated muscle than for similar absolute workloads performed under concentric activation.25 The mechanisms responsible for this efficiency are closely related to the three factors cited in the previous paragraph for why greater forces are produced through eccentric activation compared with noneccentric activation. The metabolic cost and electromyographic activity are less because, in part, a comparable task performed with eccentric activation requires slightly fewer active muscle fibers.
POWER AND WORK: ADDITIONAL CONCEPTS RELATED TO THE FORCE-VELOCITY RELATIONSHIP OF MUSCLE
The inverse relation between a muscle’s maximal force potential and its shortening velocity is related to the concept of power. Power, or the rate of work, can be expressed as a product of force and contraction velocity. (Power of a muscle contraction is therefore related to area under the right side of the curve shown previously in Figure 3-15.) A constant power output of a muscle can be sustained by increasing the load (resistance) while proportionately decreasing the contraction velocity, or vice versa. This is very similar in concept to switching gears while riding a bicycle.
SPECIAL FOCUS 3-5  Combining the Length-Tension and Force-Velocity Relationships
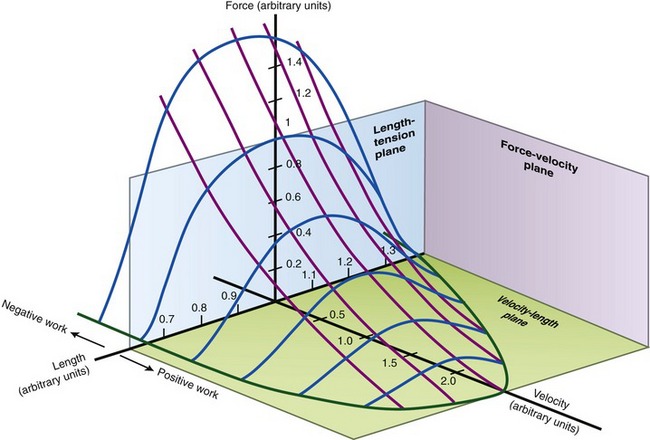
Although a muscle’s length-tension and force-velocity relationships are described separately, in reality both are often in effect simultaneously. At any given time, an active muscle is functioning at a specific length and at a specific contraction velocity, including isometric. It is useful, therefore, to generate a plot that represents the three-dimensional relationship among muscle force, length, and contraction velocity (Figure 3-17). The plot does not, however, include the passive length-tension component of muscle. The plot shows, for example, that a muscle contracting at a high velocity at its shortened length produces relatively low force levels, even with maximal effort. In contrast, a muscle contracting at a low (near-isometric) velocity at a longer length (e.g., near its optimal muscle length) theoretically produces a substantially greater active force.
Activating Muscle via the Nervous System
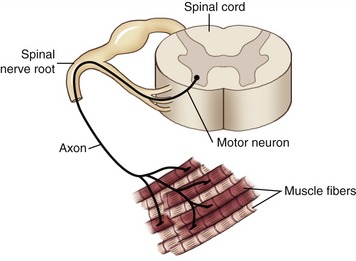
Several important mechanisms underlying the generation of muscle force have been examined thus far in this chapter. Of utmost importance, however, is that muscle is excited by impulses generated from within the nervous system, specifically by alpha motor neurons, with their cell bodies located in the ventral (anterior) horn of the spinal cord. Each alpha motor neuron has an axon that extends from the spinal cord and connects with multiple muscle fibers located throughout a whole muscle. The single alpha motor neuron together with its entire family of innervated muscle fibers is called a motor unit (Figure 3-18). Excitation of alpha motor neurons arises from many sources, including cortical descending neurons, spinal interneurons, and other afferent (sensory) neurons. Each source can activate an alpha motor neuron by first recruiting a particular motor neuron and then driving it to higher rates of sequential activation—a process called rate coding. The process of rate coding provides a finely controlled mechanism of smoothly increasing muscle force. Recruitment and rate coding are the two primary strategies employed by the nervous system to activate motor neurons. The spatial arrangement of motor units throughout a muscle and the strategies available to activate motor neurons allow for the production of very small forces involving only a few motor units, or very large forces involving most of the motor units within the muscle. Because motor units are distributed across an entire muscle, the forces from the activated fibers summate across the entire muscle and are then transmitted to the tendon and across the joint.
RECRUITMENT
Recruitment refers to the initial activation of specific motor neurons that cause excitation and activation of their associated muscle fibers. The nervous system recruits a motor unit by altering the voltage potential across the membrane of the cell body of the alpha motor neuron. This process involves a net summation of competing inhibitory and excitatory inputs. At a critical voltage, ions flow across the cell membrane and produce an electrical signal known as an action potential. The action potential is propagated down the axon of the alpha motor neuron to the motor endplate at the neuromuscular junction. Once the muscle fiber is activated, a muscle contraction (also called a twitch) occurs, and a small amount of force is generated. Box 3-3 lists the major sequence of events underlying muscle fiber activation. Through recruitment of more motor neurons, more muscle fibers are activated, and therefore more force is generated within the whole muscle.
The muscle fibers associated with each motor unit normally share similar contractile characteristics and are distributed randomly within a region of a muscle. Although each whole muscle may contain a few hundred motor units, each axon within a given motor unit may innervate 5 to 2000 muscle fibers. Muscles that require fine motor control and generate relatively low forces, such as those that control movement of the eye or digits of the hand, are usually associated with smaller-sized motor units. Typically these motor units have a small number of muscle fibers innervated per axon (i.e., possess a low innervation ratio). In contrast, muscles used to control less-refined movements involving the production of larger forces are generally associated with larger-sized motor units. These motor units tend to innervate a relatively large number of muscle fibers per axon (i.e., possess a high innervation ratio).28 Any given whole muscle, regardless of its functional role, possesses motor units with a wide variation of innervation ratios.
The size of the motor neuron influences the order in which it is recruited by the nervous system. Smaller neurons are generally recruited before the larger motor neurons (Figure 3-19). This principle is called the Henneman Size Principle, first experimentally demonstrated and developed by Elwood Henneman in the late 1950s.40 The Size Principle accounts for much of the orderly recruitment of motor units, specified by size, which allows for smooth and controlled increments in force development.
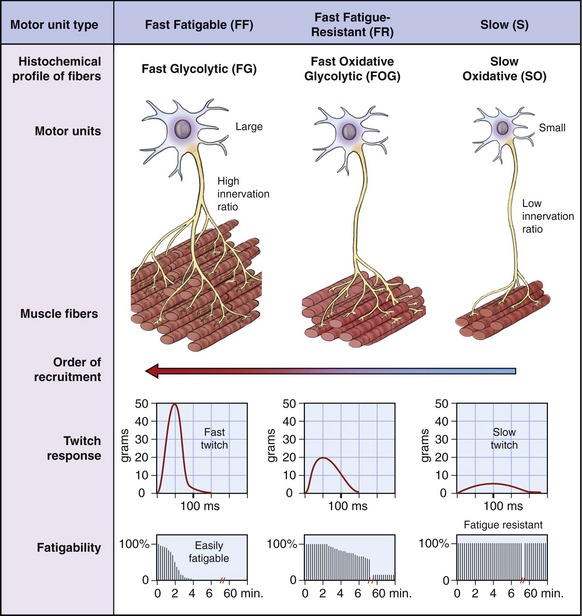
Muscle fibers innervated by small motor neurons have twitch responses that are relatively long in duration (“slow twitch”) and small in amplitude. Motor units associated with these fibers have been classified as S (for slow) because of the slower contractile characteristics of the muscle fibers. The associated fibers are referred to as SO fibers, indicating their slow and oxidative histochemical profile. Fibers associated with slow (S) motor units are relatively fatigue resistant (i.e., experience little loss of force during a sustained activation). Consequently, a muscle such as the soleus (which makes continuous and often small adjustments in the postural sway of the body over the foot) has a relatively large proportion of SO fibers.55 This slow fiber type allows “postural muscles” such as the soleus to sustain low levels of force over a long duration.
Figure 3-19 shows in a diagrammatic fashion the existence of a spectrum of intermediate motor units that have physiologic and histochemical profiles somewhere between “slow” and “fast fatigable.” The more “intermediate” motor units are classified as FR (fast fatigue-resistant). The fibers are referred to as FOG fibers, indicating the utilization of oxidative and glycolytic energy sources.
The arrangement of the motor unit types depicted in Figure 3-19 allows for a broad continuum of physiologic responses from skeletal muscle. The smaller (slower) recruited motor units are typically recruited early during a movement and generate relatively low muscle forces that can be sustained over a relatively long time. The contractile characteristics associated with the muscle fibers are ideal for the control of fine or smoothly graded low-intensity contractions. Larger (faster) motor units are recruited after the smaller motor units, and add successively greater forces of shorter duration. Through this spectrum, the nervous system is able to activate muscle fibers that sustain stable postures over a long period of time and, when needed, produce large, short-duration bursts of force for more impulsive movements.
RATE CODING
After a specific motor neuron has been recruited, the force produced by the associated muscle fibers is strongly modulated by the rate of production of sequential action potentials. This process is referred to as rate coding. Although a single action potential in a skeletal muscle fiber lasts several milliseconds (ms), the resulting muscle fiber twitch (isolated contraction) may last for as long as 130 ms to 300 ms in a slow twitch fiber. When a motor unit is first recruited, it will discharge (or spike) at about 10 action potentials per second, or 10 Hz. (The average discharge rate of an action potential is indicated as a frequency [Hz], or by its reciprocal, the interspike interval; 10 Hz is equivalent to an interspike interval of 100 ms.) With increased excitation, the rate may increase to 50 Hz (20-ms interspike interval) during a high-force contraction, although this is usually sustained for only a brief period.28 Because the twitch duration is often longer than the interval between discharges of action potentials, it is possible for a number of subsequent action potentials to begin during the initial twitch. If a fiber is allowed to relax completely before the subsequent action potential, the second fiber twitch generates a force equivalent to that of the first twitch (Figure 3-20). If the next action potential arrives before the preceding twitch has relaxed, however, the muscle twitches summate and generate an even greater peak force. Furthermore, if the next action potential arrives closer to the peak force level of the initial twitch, the force is even greater.
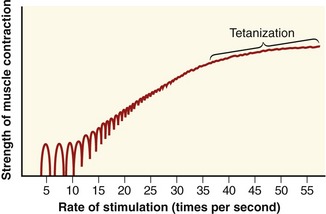
A set of repeating action potentials that each activates the muscle fiber before the relaxation of the previous twitch generates a series of summated mechanical twitches, referred to as an unfused tetanus. As the time interval between activation of successive twitches shortens, the unfused tetanus generates greater force until the successive peaks and valleys of mechanical twitches fuse into a single, stable level of muscle force, termed fused tetanus (or tetanization) (see Figure 3-20). Fused tetanus represents the greatest force level that is possible for a single muscle fiber. Motor units activated at high rates therefore are capable of generating greater overall force than the same number of motor units activated at lower rates.
The physiologic mechanisms of recruitment and rate coding of the motor unit operate simultaneously during the rise of a muscle force. The prevailing strategy (recruitment or rate coding) is highly specific to the particular demands and nature of a task. For example, motor unit recruitment during eccentric activation is different from that during concentric activation. During an eccentric activation, a relatively large force is generated per crossbridge. Consequently the number of motor units recruited is less for the same force produced during a concentric activation. Thus, a concentric activation requires the recruitment of a larger number of motor units to produce the same force as an eccentric activation. Furthermore, rate coding is particularly important in production of a rapid force, especially in the early stages of an isometric activation. The rate coding may drive some motor units to discharge action potentials in quick succession (double discharges) to further increase force development. Double discharges occur when a motor unit discharges an action potential within about 20 ms of the previous—that is, at or more than 50 Hz, which is the upper limit of regular motor unit discharge rate in humans.28 Regardless of the specific strategy used to increase force, the Henneman Size Principle (i.e., the order of recruitment from small to larger motor units) is still maintained.
SPECIAL FOCUS 3-6  “Fiber Typing”—a Long History of Classification Nomenclature
As described in Figure 3-19, three types of motor units are recognized: slow (S), fast fatigue-resistant (FR), and fast fatigable (FF) motor units. Most muscle fibers associated with a given motor unit are physiologically similar and therefore have similar functional characteristics.
Over the years, researchers have attempted to identify via biopsy and histochemical or biochemical analysis muscle fibers that are physiologically associated with each of the main types of motor units. This process is referred to as “fiber typing.” Several techniques of fiber typing have evolved over the last 50 years, three of which are highlighted in Table 3-4. The first method analyzed the histochemical profile of the fibers based on their relative oxidative or glycolytic metabolism. This system, as previously described in this chapter, conveniently links the contractile characteristics of the fibers with the classification nomenclature of the motor units (compare columns 1 and 2 in Table 3-4). This original method was developed from studies of animal motor units by Edgerton and colleagues in the 1960s, and later refined in the early 1970s.82
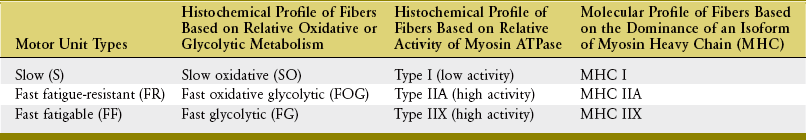
In 1970, Brooke and Kaiser16 designed a technique of fiber typing human muscles. This technique studied the histochemical profile of fibers based on the activity of the enzyme myosin ATPase (column 3 in Table 3-4). The relative activity of this enzyme allowed the fast twitch (type II) fibers to be differentiated from the slow twitch (type I) fibers. In human muscle, the faster type II fibers can be furthered classified as type IIA and type IIX. (Note that type IIX in humans was originally identified as type IIB until in recent years, when the molecular composition of the myosin was truly identified as described subsequently.)
Until the early 1990s, histochemical techniques performed on cross-sections of muscle fibers were the dominant method for fiber typing human muscles. Biochemical analysis of protein molecules soon developed that allowed portions of muscle or single fibers to be analyzed based on the proportion of structurally similar isoforms of myosin (heavy chain)—a primary active (contractile) protein within the sarcomere. At least three isoforms of this myosin heavy chain (MHC) protein have been identified in humans: MHC I, MHC IIA, and MHC IIX (column 4 in Table 3-4). The dominant isoform found within a fiber is correlated with several of its mechanical properties, including maximal rate of shortening and force development, and force-velocity characteristics. This technique, currently considered the “gold standard” for fiber typing, is well correlated with the myosin ATPase histochemistry.4,39,97
INTRODUCTION TO ELECTROMYOGRAPHY
Although EMG is also an important tool for the diagnosis and treatment of certain neuromuscular pathology or impairments, this chapter focuses on its use in the study of the kinesiology of the musculoskeletal system. EMG studies are regularly cited throughout this text, primarily as a means to justify a muscle’s action or synergistic function during a movement or task. EMG research can also help explain or justify a wide range of other kinesiologic and pathokinesiologic phenomena, encompassing topics related to the fatigue of muscle, motor learning, protection of damaged or unstable joints, locomotion, ergonomics, and sport and recreation.9,72 For this reason the reader needs to understand the basic technique, use, and limitations of kinesiologic EMG.
Recording of Electromyography
When a motor neuron is activated, the electrical impulse travels along the axon until it arrives at the motor endplates, and then it propagates in both directions away from the motor endplate along the length of the muscle fibers. The electrical signal that propagates along each muscle fiber is called the motor unit action potential. Sensitive electrodes are able to measure the sum of the change in voltage associated with all action potentials involved with the activated muscle fibers.29 This voltage is often referred to as a raw or interference EMG signal. Raw EMG signals can be sensed by indwelling electrodes (fine wires inserted into the muscle) or by surface electrodes (placed on the skin overlying the muscle).
The choice of electrodes depends on the particular situation and purpose of the EMG analysis. Surface electrodes are used most often because they are easy to apply, are noninvasive, and can detect signals from a relatively large area overlying the muscle. A common arrangement involves the placement of two surface electrodes over the muscle (each approximately 4 to 8 mm in diameter), side by side, on the skin overlying the muscle belly of interest. An additional reference (ground) electrode is placed over a bony area that has no muscle directly underneath. To ensure maximal amplitude of the EMG signal, the electrodes are placed in parallel with the long axis of the muscle fibers. This typical arrangement can usually detect action potentials within 2 cm of the electrodes.73
The voltage of the raw EMG signal is generally only a few millivolts, and therefore the signal can easily be distorted by other electrical sources caused by movement of electrodes and cables, adjacent or distant active muscles, and electromagnetic radiation from the surrounding environment. Several strategies can be used to minimize unwanted electrical artifact (often referred to as “noise”), including using the bipolar and ground electrode configuration described above. This arrangement minimizes common electrical artifact detected by both electrodes, a method electromyographers often refer to as “common mode rejection.”26,72
Other strategies for reducing unwanted electrical artifact include adequate skin preparation and proper electrical shielding of the recording environment. Electrical signals can also be preamplified at the electrode site. This boost of the signal at the electrode site reduces artifact produced by movement of the electrode cables, which is a special concern when EMG is monitored during dynamic activities such as walking or running.94 Filtering of the EMG signal can reduce certain interfering electrical signals by restricting the frequency range of the recorded EMG. A band-pass filter involves the combination of a high-pass filter (frequencies below a specified frequency are blocked, and higher frequencies are allowed to pass) and a low-pass filter (frequencies above a specified frequency are blocked, and lower frequencies are allowed to pass). A typical band-pass filter for surface EMG retains signals of 10 to 500 Hz and ignores the others.71 Broader band-pass filtering of about 200 to 2000 Hz or even greater is often required for intramuscular recording of EMG. If needed, a filter can also be designed to eliminate common 60-Hz current that may exist in the recording environment.
To avoid losing parts of the EMG signal, it is important that the sampling rate be at least twice the rate of the highest frequency contained within the EMG signal. For example, using a band-pass filter set at 10 to 500 Hz ideally requires a sampling rate of at least 1000 samples per second.71
Analysis and Normalization of Electromyography
When combined with data such as time, joint kinematics, or external forces, the EMG signal can provide valuable insight into the actions of muscle.98 In many kinesiologic analyses, the timing and amplitude of the EMG signal are of paramount interest. Consider, for example, the potential relevance of studying the normal timing or sequencing of activation of the muscles associated with stabilization of the vertebral column. A delay or inhibition of the activation of a muscle such as the transversus abdominis or lumbar multifidi, for example, may suggest a cause for instability in the lower spine. Treatments can therefore be directed to concentrate on activities that specifically recruit and challenge these muscles.43,44 Measuring the relative timing or order of muscle activation can be performed visually by using an oscilloscope or computer screen, or by more quantitative descriptive or mathematical or statistical methods.94
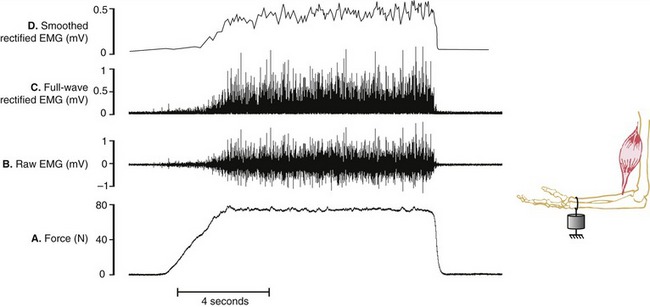
Assessing the demands placed on a muscle is usually determined by the relative amplitude of the EMG signal. Greater amplitude of EMG is generally assumed to indicate greater intensity of muscle activation and, in certain cases, greater relative muscle force. Figure 3-21, A and B depict a force generated by the isometric activation of an elbow flexor muscle producing a bipolar raw (interference) EMG signal. The raw EMG signal is a voltage that fluctuates on either side of zero and therefore often needs to be mathematically manipulated to serve as a useful quantitative measurement of muscle activation. One such method is called full-wave rectification, which converts the raw signal to positive voltages, resulting in the absolute value of the EMG (see Figure 3-21, C). The amplitude of the rectified EMG signal can be determined by averaging a sample of data collected over a specified time of activation. Furthermore, the rectified signal may be electronically filtered or smoothed, a process that flattens its “peaks and valleys” (see Figure 3-21, D). This smoothed signal is often referred to as a “linear envelope,” which can be quantified as a “moving average,” specified over a certain time frame or other event. Although not depicted in Figure 3-21, the smoothed signal may also be integrated, a mathematic process that calculates the area under the (voltage-time) curve. This process allows for cumulative EMG quantification over a fixed period of time.
An alternative analysis for representing the raw EMG amplitude is to calculate the root mean squared (RMS) value over a period of time, which correlates with the standard deviation of the voltage relative to zero.73 This mathematic analysis involves squaring the signal (to ensure a completely positive signal), averaging, and then calculating the square root. EMG voltages mathematically treated by any of the techniques described can also be used in biofeedback devices, such as visual meters or audio signals, or to trigger other devices, such as electrical stimulators, to activate a muscle at a preset threshold of voluntary contraction.
When the magnitude of a processed EMG signal is compared between different muscles, days, or conditions, it is usually necessary that the signal be normalized to some common reference signal. Expressing EMG amplitude in absolute voltage may produce meaningless data in many kinesiologic studies, especially when one is attempting to average data across different subjects and muscles. This is especially true when EMG data are collected across several sessions, requiring that the electrodes be reapplied. Even with the same muscular effort, absolute voltage will vary according to choice of electrode (including size), skin condition, and exact site of electrode placement. One common method of normalizing EMG involves referencing the signal produced by an activated muscle to that produced by the same muscle during a maximal voluntary isometric contraction (MVIC). Meaningful comparisons can then be made on the relative amplitude or intensity of muscle activation across different subjects or days, expressed as a percent of MVIC.49 Alternatively, instead of using an MVIC as a reference signal, some electromyographers use the electrical response evoked from electrical stimulation of the muscle (i.e., M wave) under analysis. Also, a muscle’s activation level can be referenced to some other meaningful reference task that does not involve maximal effort.49,79
Electromyographic Amplitude during Muscular Activation
The amplitude of the EMG signal is generally proportional to the number and discharge rate of active motor units within the recording area of the EMG electrodes. These same factors also contribute to the force generated by a muscle. It is often tempting, therefore, to use a muscle’s relative EMG magnitude as a measure of its relative force production. Although a generalized positive relationship may be assumed between these two variables during an isometric activation,49,52 it cannot be assumed during all forms of nonisometric activations.37,81 This caveat is based on several and often simultaneous factors, both physiologic and technical.
Physiologically, the EMG amplitude during a nonisometric activation can be influenced by the muscle’s length-tension and force-velocity relationships. Consider the following two extreme hypothetic examples. Muscle A produces a 30% of maximal force via a high-velocity eccentric activation, across a muscle length that favors the production of relatively large active and passive forces. Muscle B, in contrast, produces an equivalent submaximal force via a high-velocity concentric activation, across a muscle length that favors the production of relatively small active and passive forces. Based on the combined influences of the muscle’s length-tension and force-velocity relationships (depicted in Figures 3-11 and 3-15), Muscle A is assumed to operate at a relative physiologic advantage for producing force. Muscle A therefore requires fewer motor units to be recruited than Muscle B. EMG levels would therefore be less for the movement performed by Muscle A, although both muscles may be producing equivalent submaximal forces. In this extreme and hypothetic example, the EMG magnitude could not be used to reliably compare the relative forces produced by these two muscles.
Other technical factors potentially affecting the magnitude of an EMG signal during movement are listed in the box. A detailed discussion of this topic can be found elsewhere.29,72,73
In closing, although it may not be possible to predict the relative force in all muscles based on EMG amplitude, the amplitude (or timing) of the activation still provides very useful clues into the muscle’s kinesiologic role in a given action. These clues are often reinforced through the analysis of other kinetic and kinematic variables, such as those provided by goniometers, accelerometers, video or other optical sensors, strain gauges, and force plates (see Chapter 4).
CAUSES OF MUSCLE FATIGUE IN HEALTHY PERSONS
Muscle fatigue is classically defined as an exercise-induced decline in maximal voluntary muscle force or power, despite maximal effort.27 Even in healthy persons, muscle fatigue occurs during and after a sustained physical effort. Normally muscle fatigue is reversible with rest and should not be confused with being chronically “tired” or with muscle weakness that persists even with ample rest. Although muscle fatigue is a normal response to sustained physical effort, excessive or chronic muscle fatigue is not normal and is often a symptom of an underlying neuromuscular disorder.
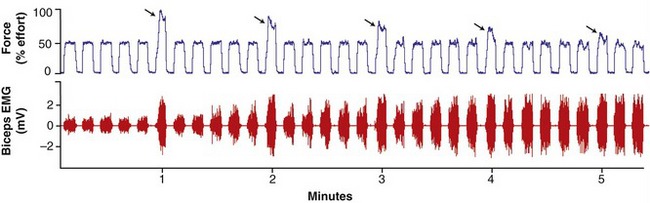
In the healthy person, muscle fatigue can be subtle and is not always noticeable to the observer, especially during the performance of tasks involving prolonged, submaximal levels of effort.48,93 This is apparent in Figure 3-22 (top panel), as a healthy subject is instructed to perform a series of elbow flexion contractions at a 50% submaximal effort, with every sixth effort (indicated by the arrows) being a maximum (100%) effort.47 As observed in the figure, the magnitude of force produced by the maximal efforts gradually declines, although the person is still able to successfully generate the 50% level of maximal force. Continued performance of this repetitive submaximal effort, however, would eventually result in a decline in muscle force well below the 50% target level. Of interest, as evident in Figure 3-22 (bottom panel), the amplitude of the EMG signal gradually increases throughout the repeated submaximal efforts. This increased EMG signal reflects the recruitment of additional larger motor units as the other fatigued motor units cease or reduce their discharge rates.88 This recruitment strategy is an attempt at maintaining a relatively stable force output.
In contrast to submaximal efforts depicted in Figure 3-22, a sustained muscle contraction at maximal effort results in a much more rapid rate of decline in maximal force. In this case, EMG amplitude declines as muscle force declines. This reduced EMG activity reflects a cessation or slowing of the discharge rate of the fatiguing motor units.14 Because all motor units are presumably active during the initial stages of the maximal effort, there are no other motor units in reserve to compensate for the decline in muscle force, as is the case with prolonged submaximal efforts.
SPECIAL FOCUS 3-7  Frequency Shifts in the EMG Signal as an Indicator of Fatigue
Another method of indirectly assessing muscle fatigue during a maximal-effort task is based on the analysis of the frequency content of the raw EMG signal. When a muscle becomes progressively fatigued, such as during a prolonged effort, the EMG signal typically shows a shift to a lower median (or mean) frequency. Such analysis can be performed by applying a mathematic technique known as a Fourier transformation to obtain a power density spectrum of the EMG signal. A drop in the median frequency usually indicates that the action potentials contributing to the EMG signal are increasing in duration (conduction velocity is slowing) and reducing in amplitude.73 The net effect is a shift in the median frequency of the EMG signal to lower frequencies.
The magnitude or rate of muscle fatigue is specific to the performance of the task, including the duration of the rest-work cycle.27 A muscle that is rapidly fatigued by high-intensity and short-duration exercise can recover after a rest of only several minutes. In contrast, a muscle that is fatigued by low-intensity, long-duration exercise usually requires a much longer time to recover its force-generating capacity. Furthermore, the type of activation influences muscle fatigue. A muscle that is repeatedly activated eccentrically will exhibit less fatigue than when activated concentrically at the same velocity and under the same external load.11 The relative fatigue-resistant nature of eccentric activation reflects the greater force generated per crossbridge and therefore the lower recruitment of motor units for a given submaximal load. Caution is required, however, when eccentric activation is employed as the primary rehabilitative training tool in a muscle that is unaccustomed to this type of activation. Delayed onset of muscle soreness (DOMS) experienced after repeated eccentric activations is usually more severe than after bouts of concentric or isometric activations.85 DOMS tends to peak 24 to 72 hours after the bout of exercise and is ultimately caused by disruption of the sarcomeres and damage to the cytoskeleton within and around the fiber.86
There are several proposed mechanisms to explain the exact causes of fatigue. These mechanisms may be located at all points within and between the activation of the motor cortex and the sarcomere.27,35 Mechanisms may occur in the muscle or the neuromuscular junction (often referred to as muscular or peripheral mechanisms). Alternatively, mechanisms may occur in the nervous system (often referred to as neural or central mechanisms). The distinction between muscular and neural mechanisms is not always clear. As an example, certain sensory neurons (group III and IV afferents) within muscle respond to the local metabolic byproducts associated with fatigue. Activation of these neurons in a fatiguing muscle can inhibit the discharge rate of the associated motor neurons,70 paradoxically further reducing the force output of the fatigued muscle. In this example, the reason for the loss in force in the fatiguing muscle can be partially explained by both muscular and neural mechanisms.
Many mechanisms of fatigue in healthy persons are associated with the muscle itself. These mechanisms can be investigated by measuring the reduction in muscle force produced by electrical stimulation, which is independent of the central nervous system and voluntary effort.13,31,32,35 These tests and others suggest that several muscular mechanisms may be responsible for fatigue (see list in box).32
Several mechanisms of fatigue have been proposed that involve the nervous system—that is, regions proximal to the neuromuscular junction.35,100 These neural mechanisms typically involve reduced excitatory input to supraspinal centers or a net decline in excitatory input to alpha motor neurons.35 As a consequence, in healthy persons activation of the pool of motor neurons is reduced and muscle force declines. Persons with diseases of the nervous system such as multiple sclerosis may experience even greater muscle fatigue than healthy adults because of delays or blocks in the conduction of central neural impulses.91
CHANGES IN MUSCLE WITH STRENGTH TRAINING, REDUCED USE, AND ADVANCED AGE
Changes in Muscle with Strength Training
Repeated sessions of activating a muscle with progressively greater resistance will result in increased strength and hypertrophy.58,60 Strength gains are commonly quantified by a one-repetition maximum, or 1 RM. By definition, 1 RM is the maximum load that can be lifted once as a muscle contracts through the joint’s full or near-full range of motion. (For safety and practical reasons, formulas have been developed that allow a person’s 1 RM strength to be determined by lifting a reduced load with a larger number of repetitions.45) The amount of resistance employed during strength training is often specified as a multiple of 1 RM; for example, the term 3 RMs is the maximal load that can be lifted through a joint’s full range of motion three times, and so on.
Increases in muscle strength from training are specific to the type and intensity of the exercise program. For example, high-resistance training involving concentric and eccentric activations performed three times a week for a 12-week period has been shown to increase 1 RM strength by 30% to 40%.51 On average, this represents an increase of about 1% of strength per day of training. The same dynamic training regimen (concentric and eccentric activations), however, resulted in only a 10% increase in isometric strength.51 Most strength-training programs should involve a component of eccentric activation. Because eccentric activations produce greater force per unit of muscle, this form of training can be more effective in promoting muscle hypertrophy than the same training using isometric and concentric activations.89
As expected, gains in 1 RM strength from low-resistance strength training are less than for high-resistance training,59 but gains in muscle endurance can be greater.
One of the most dramatic responses to strength training is hypertrophy of muscle.2,60,87,89,96 Hypertrophy results from increased protein synthesis within muscle fibers and therefore an increase in the physiologic cross-sectional area of the whole muscle. Increased pennation angles in hypertrophied muscles have been demonstrated, perhaps as a way to accommodate the larger amounts of contractile proteins.2,56 Increased cross-sectional area in human muscle is primarily a result of fiber hypertrophy, with limited evidence of an increase in the actual number of fibers (hyperplasia). Staron and colleagues showed that the cross-sectional area of muscle increases as much as 30% in young adults after 20 weeks of high-resistance strength training, with increases in fiber size detected after only 6 weeks.97 Although training causes hypertrophy in all exercised muscle fibers, it is usually greatest in the fast twitch (type II) fibers.51,96,97,108 It has been proposed that increased strength in muscle may also be the result of an increase in the protein filament desmin (review Table 3-2 in Special Focus 3-2), which is believed to help transfer forces within and between muscle fibers.108
Strength gains from resistance training are also caused by adaptations within the nervous system.24,34 Neural influences are especially evident during the first few training sessions. Some of the adaptations include an increased area of activity within the cortex of the brain during a motor task (as shown by functional magnetic resonance imaging), increased supraspinal motor drive, increased motor neuron excitability, and greater discharge frequency of motor units coupled with a decrease in neural inhibition at both spinal and supraspinal levels.1,24,90 Perhaps the most convincing evidence of a neurogenic basis for strength training is documented increases in muscle strength through imagery training111,112 or increases in the strength of control (nonexercised) muscles located contralateral to the exercised muscles.20,76 Strength gains are often greater than what can be attributed to hypertrophy alone.24 Although most of the neural adaptations cause greater activation of the agonist muscles, evidence suggests that training can result in less activation of the antagonist muscles.34 The reduced force from opposing muscles would result in a greater net force produced by the agonist muscles.
Changes in Muscle with Reduced Use
Trauma that requires a person’s limb or joint to be rigidly immobilized for many weeks significantly reduces the use of the associated muscles. Periods of reduced muscle use (or disuse) also occur as a person confined to bed recovers from an illness or disease. These periods of reduced muscle activity lead to atrophy and usually marked reductions in strength, even in the first few weeks of inactivity.3,7,21 The loss in strength can occur early, up to 3% to 6% per day in the first week alone.7 After only 10 days of immobilization, healthy individuals can experience up to a 40% decrease of initial 1 RM strength.101 Reduced strength after immobilization is usually twice that of the muscle atrophy—a 20% reduction in fiber cross-sectional area is associated with a 40% decline in strength. These relatively early changes suggest some neurologic basis for the reduced strength, in addition to the loss in the muscle’s contractile proteins.
Protein synthesis is reduced in all muscle fiber types within a chronically immobilized limb,3 but most notably in the slow twitch fibers.7 Because slow twitch fibers are used so frequently throughout most routine daily activities, they are subjected to greater relative disuse when the limb is immobilized compared with fast twitch fibers. As a consequence, whole muscles of immobilized limbs tend to experience a relative transformation toward faster twitch characteristics,38 and this shift can occur as early as 3 weeks after the onset of immobilization.46
The amount of neuromuscular adaptation after immobilization of a limb depends on several factors. The loss of strength is greatest when the muscle is maintained in its shortened position.33,99 The greater slack placed on muscle fibers immobilized in a shortened length may specifically promote degradation of contractile proteins.15 Furthermore, antigravity and single-joint muscles show a more rapid atrophy than other muscles within a chronically immobilized limb. These muscles include the soleus, vastus medialis, vastus intermedius, and multifidus.64 In the lower extremity, the knee extensors generally demonstrate greater disuse atrophy and relative loss in strength than the knee flexor (hamstring) muscles.78 The propensity for disuse atrophy in the quadriceps may be a concern when stability of the partially flexed knee is required, such as when a person is transferring to and from a chair, bed, or commode.
Resistive exercise is able to reverse or mitigate many of the changes that occur with chronic immobilization of a limb. A strengthening program incorporating eccentric activation demonstrates the greatest gains in strength and increases in fiber size.46 Because the fibers associated with the smaller motor units are more prone to atrophy, a rehabilitation program should incorporate low-intensity, long-duration muscle activations early in the exercise program as a means to target these muscle fibers.
Changes in Muscle with Advanced Age
Even in healthy persons, reaching an advanced age is associated with reduced strength, power, and speed of muscle contraction. Although these changes can be subtle, they can be marked in very old age and they are measurable. Because of the relative rapid loss in the speed of muscle contraction, aged persons typically show greater loss in power (product of force and velocity) than in peak force alone.10,92
Although changes are highly variable, in general, healthy aged persons experience an approximate 10% per decade decline in peak strength after 60 years of age, with a more rapid decline after 75 years of age.50,77 Loss in strength is generally more pronounced in the muscles of the lower limb, such as the quadriceps,50,67 as compared with the upper limb. If marked, lower-limb weakness can interfere with functions required for independent living, such as safely walking, or rising from a chair.83 Such age-related decrements in muscle strength are often accelerated in sedentary older adults or those with underlying pathology.50
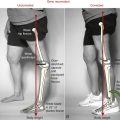
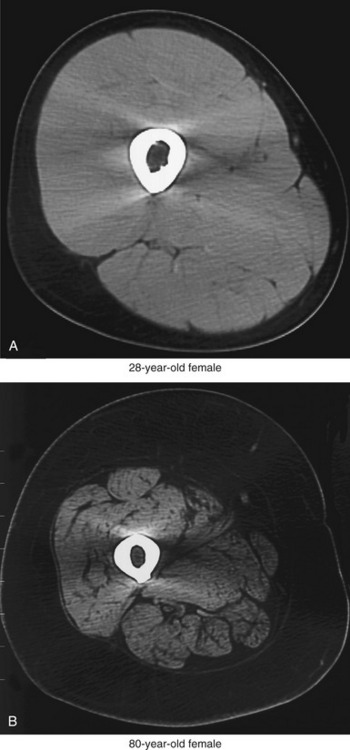
The primary cause of reduced strength in healthy aged persons is senile sarcopenia, which is defined as a loss in muscle tissue with advanced age.22,102 Sarcopenia may be dramatic, with a marked loss of muscle tissue and an infiltration of excessive amounts of connective tissue and intramuscular fat (compare muscles in Figure 3-23). The causes of senile sarcopenia are not fully understood and may be associated with the normal biologic processes of aging (such as programmed cell death—“apoptosis”) or changes in physical activity, nutrition, and hormone levels.17,78,87,102
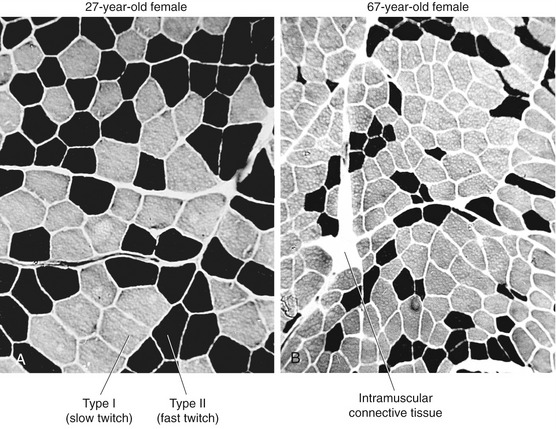
Sarcopenia occurs through a reduction in the actual number of muscle fibers as well as a decrease in size (atrophy) of all existing fibers.87 Loss in the number of fibers is caused by a gradual demise of the associated motor units.19,63,103 Initial studies using muscle biopsy suggested that there was a selective loss of type II (fast twitch) fibers in older adults. More recent evidence, however, indicates that the proportion of type II and type I fibers is usually maintained into old age, at least in healthy adults.51,87 Because of the greater atrophy of the type II (fast) fibers, however, aged skeletal muscle typically has a greater proportional volume of muscle that expresses type I (slow twitch) characteristics compared with young adults. This phenomenon is apparent when excised cross-sections of stained muscle fibers of a young and a relatively older person are compared (Figure 3-24). The muscle fibers from both the young and older adult were stained using a similar fiber typing technique: type I (slow twitch) fibers are stained light, and type II (fast twitch) fibers are stained dark (see figure legend). The cross-section of the older muscle in Figure 3-24, B shows all fibers are smaller compared with the young muscle, especially the type II (fast twitch) fibers. The muscle sample obtained from the older subject in Figure 3-24, B demonstrates a greater proportional number of type I (slow twitch) fibers than the younger subject, although this is not typical of most recent findings. The more common occurrence is a proportional loss of both type I and type II fibers, with greater atrophy (reduced size) of the remaining type II fibers. This results in a net increase in the proportional area of type I fibers in old muscle compared with young muscle, which explains in part why whole muscles in aged adults take longer to contract and to relax and ultimately are less forceful and powerful.23,51 Although a more sedentary lifestyle will accelerate these changes in muscle morphology, even the active older adult will experience these alterations to varying degrees.
The age-related alterations in muscle morphology can have marked effects on the ability of some older adults to effectively perform daily tasks. Fortunately, however, age in itself does not drastically alter the plasticity of the neuromuscular system. Strength training can theoretically compensate for some but certainly not all of the loss in strength and power in aged adults.30 Resistive exercise, if performed safely, can be very helpful in maintaining the critical level of muscle force and power required for the performance of the basic activities of daily living.
SUMMARY
As described in Chapter 1, a muscle’s action and ultimate function is based on its line of force relative to the axis of rotation at the joint. Chapter 3 focuses more on mechanisms responsible for the generation of the force. Ultimately, these mechanisms are governed by the nervous system, but also by the unique morphology (shape) and overall architecture of the individual muscles. Each individual muscle in the body has a unique form and therefore unique function. A small fusiform muscle such as the lumbrical in the hand, for example, generates only a small force because of its small cross-sectional area. Because this muscle is well endowed with sensory receptors, it excels in providing the nervous system with proprioception. The larger gastrocnemius muscle, in contrast, produces large forces because of its larger cross-sectional area, resulting in part from the pennation arrangement of its fibers. A large force is required from this calf muscle to lift or propel the entire body during activities such as jumping and climbing.
REFERENCES
1. Aagaard, P. Training-induced changes in neural function. Exerc Sport Sci Rev. 2003;31:61–67.
2. Aagaard, P, Andersen, JL, Dyhre-Poulsen, P, et al. A mechanism for increased contractile strength of human pennate muscle in response to strength training: changes in muscle architecture. J Physiol. 2001;534:613–623.
3. Adams, GR, Caiozzo, VJ, Baldwin, KM. Skeletal muscle unweighting: spaceflight and ground-based models. J Appl Physiol. 2003;95:2185–2201.
4. Adams, GR, Hather, BM, Baldwin, KM, Dudley, GA. Skeletal muscle myosin heavy chain composition and resistance training. J Appl Physiol. 1993;74:911–915.
5. Allen, GM, Gandevia, SC, McKenzie, DK. Reliability of measurements of muscle strength and voluntary activation using twitch interpolation. Muscle Nerve. 1995;18:593–600.
6. Allen, GM, McKenzie, DK, Gandevia, SC, Bass, S. Reduced voluntary drive to breathe in asthmatic subjects. Respir Physiol. 1993;93:29–40.
7. Appell, HJ. Muscular atrophy following immobilisation. A review. Sports Med. 1990;10:42–58.
8. Baratta, RV, Solomonow, M, Best, R, D’Ambrosia, R. Isotonic length/force models of nine different skeletal muscles. Med Biol Eng Comput. 1993;31:449–458.
9. Basmajian, J, Luca, CD. Muscles alive: their functions revealed by electromyography. Baltimore: Williams & Wilkins; 1985.
10. Bassey, EJ, Fiatarone, MA, O’Neill, EF, et al. Leg extensor power and functional performance in very old men and women. Clin Sci. 1992;82:321–327.
11. Baudry, S, Klass, M, Pasquet, B, Duchateau, J. Age-related fatigability of the ankle dorsiflexor muscles during concentric and eccentric contractions. Eur J Appl Physiol. 2006;100:515–525.
12. Beltman, JG, Sargeant, AJ, van Mechelen, W, de Haan, A. Voluntary activation level and muscle fiber recruitment of human quadriceps during lengthening contractions. J Appl Physiol. 2004;97:619–626.
13. Bigland-Ritchie, B, Furbush, F, Woods, JJ. Fatigue of intermittent submaximal voluntary contractions: central and peripheral factors. J Appl Physiol. 1986;61:421–429.
14. Bigland-Ritchie, B, Johansson, R, Lippold, OC, Woods, JJ. Contractile speed and EMG changes during fatigue of sustained maximal voluntary contractions. J Neurophysiol. 1983;50:313–324.
15. Booth, FW. Effect of limb immobilization on skeletal muscle. J Appl Physiol. 1982;52:1113–1118.
16. Brooke, MH, Kaiser, KK. Muscle fiber types: how many and what kind? Arch Neurol. 1970;23:369–379.
17. Brown, M. Skeletal muscle and bone: effect of sex steroids and aging. Adv Physiol Educ. 2008;32:120–126.
18. Caiozzo, VJ, Rourke, B. The muscular system: structural and functional plasticity. In: Tipton CM, ed. ACSM’S advanced exercise physiology. Philadelphia: Lippincott Williams & Wilkins, 2006.
19. Campbell, MJ, McComas, AJ, Petito, F. Physiological changes in ageing muscles. J Neurol Neurosurg Psychiatry. 1973;36:174–182.
20. Carroll, TJ, Herbert, RD, Munn, J, et al. Contralateral effects of unilateral strength training: evidence and possible mechanisms. J Appl Physiol. 2006;101:1514–1522.
21. Christensen, B, Dyrberg, E, Aagaard, P, et al. Short-term immobilization and recovery affect skeletal muscle but not collagen tissue turnover in humans. J Appl Physiol. 2008;105:1845–1851.
22. Doherty, TJ. Invited review: aging and sarcopenia. J Appl Physiol. 2003;95:1717–1727.
23. Doherty, TJ, Brown, WF. Age-related changes in the twitch contractile properties of human thenar motor units. J Appl Physiol. 1997;82:93–101.
24. Duchateau, J, Enoka, RM. Neural adaptations with chronic activity patterns in able-bodied humans. Am J Phys Med Rehabil. 2002;81:S17–S27.
25. Duchateau, J, Enoka, RM. Neural control of shortening and lengthening contractions: influence of task constraints. J Physiol. 2008;586:5853–5864.
26. Enoka, RM. Neuromechanics of human movement. Champaign, Ill: Human Kinetics; 2008.
27. Enoka, RM, Duchateau, J. Muscle fatigue: what, why and how it influences muscle function. J Physiol. 2008;586:11–23.
28. Enoka, RM, Fuglevand, AJ. Motor unit physiology: some unresolved issues. Muscle Nerve. 2001;24:4–17.
29. Farina, D, Merletti, R, Enoka, RM. The extraction of neural strategies from the surface EMG. J Appl Physiol. 2004;96:1486–1496.
30. Fiatarone, MA, O’Neill, EF, Ryan, ND, et al. Exercise training and nutritional supplementation for physical frailty in very elderly people. N Engl J Med. 1994;330:1769–1775.
31. Fitts, RH. The cross-bridge cycle and skeletal muscle fatigue. J Appl Physiol. 2008;104:551–558.
32. Fitts, RH. The muscular system: fatigue processes. In: Tipton CM, ed. ACSM’S advanced exercise physiology. Philadelphia: Lippincott Williams & Wilkins, 2006.
33. Fournier, M, Roy, RR, Perham, H, et al. Is limb immobilization a model of muscle disuse? Exp Neurol. 1983;80:147–156.
34. Gabriel, DA, Kamen, G, Frost, G. Neural adaptations to resistive exercise: mechanisms and recommendations for training practices. Sports Med. 2006;36:133–149.
35. Gandevia, SC. Spinal and supraspinal factors in human muscle fatigue. Physiol Rev. 2001;81:1725–1789.
36. Ghena, DR, Kurth, AL, Thomas, M, Mayhew, J. Torque Characteristics of the Quadriceps and Hamstring Muscles during Concentric and Eccentric Loading. J Orthop Sports Phys Ther. 1991;14:149–154.
37. Graves, AE, Kornatz, KW, Enoka, RM. Older adults use a unique strategy to lift inertial loads with the elbow flexor muscles. J Neurophysiol. 2000;83:2030–2039.
38. Haggmark, T, Eriksson, E. Cylinder or mobile cast brace after knee ligament surgery. A clinical analysis and morphologic and enzymatic studies of changes in the quadriceps muscle. Am J Sports Med. 1979;7:48–56.
39. Harridge, SDR, Bottinelli, R, Canepari, M, et al. Whole-muscle and single-fibre contractile properties and myosin heavy chain isoforms in humans. Pflugers Arch. 1996;432:913–920.
40. Henneman, E, Mendell, L. Functional organization of motoneuron pool and its inputs. In: Brookhart, JM, Mountcastle, VB, Brooks, VB, eds. Handbook of physiology, vol 2. Bethesda: American Physiological Society; 1981.
41. Hill, A. The first and last experiments in muscle mechanics. New York: Cambridge University Press; 1970.
42. Hill, A. The heat of shortening and the dynamic constraints of muscle. Proc R Soc Lond B Biol Sci. 1938;126:136–195.
43. Hodges, PW, Richardson, CA. Contraction of the abdominal muscles associated with movement of the lower limb. Phys Ther. 1997;77:132.
44. Hodges, PW, Richardson, CA. Inefficient muscular stabilization of the lumbar spine associated with low back pain. A motor control evaluation of transversus abdominis. Spine. 1996;21:2640–2650.
45. Hoffman, J. Resistance Training. In: Hoffman J, ed. Physiological aspects of sport training and performance. Champaign, Ill: Human Kinetics, 2002.
46. Hortobagyi, T, Dempsey, L, Fraser, D, et al. Changes in muscle strength, muscle fibre size and myofibrillar gene expression after immobilization and retraining in humans. J Physiol. 2000;524:293–304.
47. Hunter, SK, Critchlow, A, Shin, IS, Enoka, RM. Men are more fatigable than strength-matched women when performing intermittent submaximal contractions. J Appl Physiol. 2004;96:2125–2132.
48. Hunter, SK, Duchateau, J, Enoka, RM. Muscle fatigue and the mechanisms of task failure. Exerc Sport Sci Rev. 2004;32:44–49.
49. Hunter, SK, Ryan, DL, Ortega, JD, Enoka, RM. Task differences with the same load torque alter the endurance time of submaximal fatiguing contractions in humans. J Neurophysiol. 2002;88:3087–3096.
50. Hunter, SK, Thompson, MW, Adams, RD. Relationships among age-associated strength changes and physical activity level, limb dominance, and muscle group in women. J Gerontol A Biol Sci Med Sci. 2000;55:B264–B273.
51. Hunter, SK, Thompson, MW, Ruell, PA, et al. Human skeletal sarcoplasmic reticulum Ca2+ uptake and muscle function with aging and strength training. J Appl Physiol. 1999;86:1858–1865.
52. Hunter, SK, Yoon, T, Farinella, J, et al. Time to task failure and muscle activation vary with load type for a submaximal fatiguing contraction with the lower leg. J Appl Physiol. 2008;105:463–472.
53. Huxley, AF, Niedergerke, R. Structural changes in muscle during contraction; interference microscopy of living muscle fibres. Nature. 1954;173:971–973.
54. Huxley, H, Hanson, J. Changes in the cross-striations of muscle during contraction and stretch and their structural interpretation. Nature. 1954;173:973–976.
55. Johnson, MA, Polgar, J, Weightman, D, Appleton, D. Data on the distribution of fibre types in thirty-six human muscles. An autopsy study. J Neurol Sci. 1973;18:111–129.
56. Kawakami, Y, Abe, T, Fukunaga, T. Muscle-fiber pennation angles are greater in hypertrophied than in normal muscles. J Appl Physiol. 1993;74:2740–2744.
57. Kesar, TM, Ding, J, Wexler, AS, et al. Predicting muscle forces of individuals with hemiparesis following stroke. J Neuroeng Rehabil. 2008;5:7.
58. Kraemer, WJ, Adams, K, Cafarelli, E, et al. American College of Sports Medicine position stand. Progression models in resistance training for healthy adults. Med Sci Sports Exerc. 2002;34:364–380.
59. Kraemer, WJ, Deschenes, MR, Fleck, SJ. Physiological adaptations to resistance exercise. Implications for athletic conditioning. Sports Med. 1988;6:246–256.
60. Kraemer, WJ, Ratamess, NA. Fundamentals of resistance training: progression and exercise prescription. Med Sci Sports Exerc. 2004;36:674–688.
61. Krevolin, JL, Pandy, MG, Pearce, JC. Moment arm of the patellar tendon in the human knee. J Biomech. 2004;37:785–788.
62. Labeit, S, Kolmerer, B. Titins: giant proteins in charge of muscle ultrastructure and elasticity. Science. 1995;270:293–296.
63. Lexell, J, Taylor, CC, Sjostrom, M. What is the cause of the ageing atrophy? Total number, size and proportion of different fiber types studied in whole vastus lateralis muscle from 15- to 83-year-old men. J Neurol Sci. 1988;84:275–294.
64. Lieber, RL. Skeletal muscle structure, function and plasticity. Baltimore: Lippincott Williams & Wilkins; 2002.
65. Lieber, RL, Friden, J. Clinical significance of skeletal muscle architecture. Clin Orthop Relat Res. 2001;383:140–151.
66. Lombardi, V, Piazzesi, G. The contractile response during steady lengthening of stimulated frog muscle fibres. J Physiol. 1990;431:141–171.
67. Lynch, NA, Metter, EJ, Lindle, RS, et al. Muscle quality. I. Age-associated differences between arm and leg muscle groups. J Appl Physiol. 1999;86:188–194.
68. Magid, A, Law, DJ. Myofibrils bear most of the resting tension in frog skeletal muscle. Science. 1985;230:1280–1282.
69. Magnusson, SP, Narici, MV, Maganaris, CN, Kjaer, M. Human tendon behaviour and adaptation, in vivo. J Physiol. 2008;586:71–81.
70. Martin, PG, Smith, JL, Butler, JE, et al. Fatigue-sensitive afferents inhibit extensor but not flexor motoneurons in humans. J Neurosci. 2006;26:4796–4802.
71. Merletti, R, Hermens, HJ. Detection and conditioning of the surface EMG signal. In: Merletti R, Parker P, eds. Electromyography: physiology, engineering and noninvasive applications. Piscataway, NJ: IEEE Press, Wiley-Interscience, 2004.
72. Merletti, R, Parker, P. Electromyography: physiology, engineering and noninvasive applications. Piscataway, NJ: IEEE Press, Wiley-Interscience; 2004.
73. Merletti, R, Rainoldi, A, Farina, D. Surface electromyography for noninvasive characterization of muscle. Exerc Sport Sci Rev. 2001;29:20–25.
74. Monti, RJ, Roy, RR, Edgerton, VR. Role of motor unit structure in defining function. Muscle Nerve. 2001;24:848–866.
75. Monti, RJ, Roy, RR, Hodgson, JA, Edgerton, VR. Transmission of forces within mammalian skeletal muscles. J Biomech. 1999;32:371–380.
76. Munn, J, Herbert, RD, Hancock, MJ, Gandevia, SC. Training with unilateral resistance exercise increases contralateral strength. J Appl Physiol. 2005;99:1880–1884.
77. Narici, MV, Bordini, M, Cerretelli, P. Effect of aging on human adductor pollicis muscle function. J Appl Physiol. 1991;71:1277–1281.
78. Narici, MV, Maganaris, CN. Plasticity of the muscle-tendon complex with disuse and aging. Exerc Sport Sci Rev. 2007;35:126–134.
79. Neumann, DA. An electromyographic study of the hip abductor muscles as subjects with a hip prosthesis walked with different methods of using a cane and carrying a load. Phys Ther. 1999;79:1163.
80. Ng, AV, Miller, RG, Gelinas, D, Kent-Braun, JA. Functional relationships of central and peripheral muscle alterations in multiple sclerosis. Muscle Nerve. 2004;29:843–852.
81. Pasquet, B, Carpentier, A, Duchateau, J, Hainaut, K. Muscle fatigue during concentric and eccentric contractions. Muscle Nerve. 2000;23:1727–1735.
82. Peter, JB, Barnard, RJ, Edgerton, VR, et al. Metabolic profiles of three fiber types of skeletal muscle in guinea pigs and rabbits. Biochemistry. 1972;11:2627–2633.
83. Petrella, JK, Kim, JS, Tuggle, SC, et al. Age differences in knee extension power, contractile velocity, and fatigability. J Appl Physiol. 2005;98:211–220.
84. Petterson, SC, Barrance, P, Buchanan, T, et al. Mechanisms underlying quadriceps weakness in knee osteoarthritis. Med Sci Sports Exerc. 2008;40:422–427.
85. Prasartwuth, O, Taylor, JL, Gandevia, SC. Maximal force, voluntary activation and muscle soreness after eccentric damage to human elbow flexor muscles. J Physiol. 2005;567:337–348.
86. Proske, U, Morgan, DL. Muscle damage from eccentric exercise: mechanism, mechanical signs, adaptation and clinical applications. J Physiol. 2001;537:333–345.
87. Reeves, ND, Narici, MV, Maganaris, CN. Myotendinous plasticity to ageing and resistance exercise in humans. Exp Physiol. 2006;91:483–498.
88. Riley, ZA, Maerz, AH, Litsey, JC, Enoka, RM. Motor unit recruitment in human biceps brachii during sustained voluntary contractions. J Physiol. 2008;586:2183–2193.
89. Roig, M, O’Brien, K, Kirk, G, et al. The effects of eccentric versus concentric resistance training on muscle strength and mass in healthy adults: a systematic review with meta-analyses. Br J Sports Med. 2009;43:556–568.
90. Semmler, JG, Enoka, RM. Neural contributions to changes in muscle strength. In: Zatsiorsky VM, ed. Olympic encyclopaedia of sports medicine and science. Biomechanics in sport: the scientific basis of performance. Oxford, UK: Blackwell Science, 2000.
91. Sheean, GL, Murray, NM, Rothwell, JC, et al. An electrophysiological study of the mechanism of fatigue in multiple sclerosis. Brain. 1997;120:299–315.
92. Skelton, DA, Kennedy, J, Rutherford, OM. Explosive power and asymmetry in leg muscle function in frequent fallers and non-fallers aged over 65. Age Ageing. 2002;31:119–125.
93. Smith, JL, Martin, PG, Gandevia, SC, Taylor, JL. Sustained contraction at very low forces produces prominent supraspinal fatigue in human elbow flexor muscles. J Appl Physiol. 2007;103:560–568.
94. Soderberg, GL, Knutson, LM. A guide for use and interpretation of kinesiologic electromyographic data. Phys Ther. 2000;80:485–498.
95. Standring, S, Ellis, H, Healy, JC. Gray’s anatomy: the anatomical basis of clinical practice, ed 40. New York: Churchill Livingstone; 2009.
96. Staron, RS, Karapondo, DL, Kraemer, WJ, et al. Skeletal muscle adaptations during early phase of heavy-resistance training in men and women. J Appl Physiol. 1994;76:1247–1255.
97. Staron, RS, Leonardi, MJ, Karapondo, DL, et al. Strength and skeletal muscle adaptations in heavy-resistance-trained women after detraining and retraining. J Appl Physiol. 1991;70:631–640.
98. Sutherland, DH. The evolution of clinical gait analysis part l: Kinesiological EMG. Gait Posture. 2001;14:61–70.
99. Tabary, JC, Tabary, C, Tardieu, C, et al. Physiological and structural changes in the cat’s soleus muscle due to immobilization at different lengths by plaster casts. J Physiol. 1972;224:231–244.
100. Taylor, JL, Todd, G, Gandevia, SC. Evidence for a supraspinal contribution to human muscle fatigue. Clin Exp Pharmacol Physiol. 2006;33:400–405.
101. Thom, JM, Thompson, MW, Ruell, PA, et al. Effect of 10-day cast immobilization on sarcoplasmic reticulum calcium regulation in humans. Acta Physiol Scand. 2001;172:141–147.
102. Thompson, LV. Age-related muscle dysfunction. Exp Gerontol. 2009;44:106–111.
103. Tomlinson, BE, Irving, D. The numbers of limb motor neurons in the human lumbosacral cord throughout life. J Neurol Sci. 1977;34:213–219.
104. van Mameren, H, Drukker, J. Attachment and composition of skeletal muscles in relation to their function. J Biomech. 1979;12:859–867.
105. Wang, K, McCarter, R, Wright, J, et al. Viscoelasticity of the sarcomere matrix of skeletal muscles. The titin-myosin composite filament is a dual-stage molecular spring. Biophys J. 1993;64:1161–1177.
106. Westing, SH, Seger, JY, Thorstensson, A. Effects of electrical stimulation on eccentric and concentric torque-velocity relationships during knee extension in man. Acta Physiol Scand. 1990;140:17–22.
107. Williams, GN, Buchanan, TS, Barrance, PJ, et al. Quadriceps weakness, atrophy, and activation failure in predicted noncopers after anterior cruciate ligament injury. Am J Sports Med. 2005;33:402–407.
108. Woolstenhulme, MT, Conlee, RK, Drummond, MJ, et al. Temporal response of desmin and dystrophin proteins to progressive resistance exercise in human skeletal muscle. J Appl Physiol. 2006;100:1876–1882.
109. Yamaguchi, G, Sawa, A, Moran, D. A survey of human musculotendon actuator parameters. In: Winters JW, Woo S-LY, eds. Multiple muscle systems: biomechanics and movement organization. New York: Springer-Verlag, 1990.
110. Yoshida, Y, Mizner, RL, Ramsey, DK, Snyder-Mackler, L. Examining outcomes from total knee arthroplasty and the relationship between quadriceps strength and knee function over time. Clin Biomech. 2008;23:320–328.
111. Yue, G, Cole, KJ. Strength increases from the motor program: comparison of training with maximal voluntary and imagined muscle contractions. J Neurophysiol. 1992;67:1114–1123.
112. Zijdewind, I, Toering, ST, Bessem, B, et al. Effects of imagery motor training on torque production of ankle plantar flexor muscles. Muscle Nerve. 2003;28:168–173.
STUDY QUESTIONS
1. What functional purpose does pennation architecture serve within a muscle?
2. What tissues within a muscle are most responsible for the shape of the whole muscle’s (a) passive, (b) active, and (c) total length-tension curve?
3. How does an activated muscle generate force without an actual shortening of its myofilaments?
4. The duration of a single action potential can be as little as 10 msec as it propagates along the muscle fiber. With such a short duration, how can a muscle develop and sustain a state of tetanization?
5. Define muscle fatigue. Explain how electromyographic amplitude can be used to detect the onset of muscle fatigue in a prolonged submaximal-effort muscle contraction.
6. What factors limit the ability of a muscle’s electromyographic amplitude to be predictive of its relative force output in a freely activated muscle?
7. Define physiologic cross-sectional area.
8. Explain why internal torque produced by a muscle during isometric activation changes with a change in joint angle.
9. Consider the plot depicted in Figure 3-16.
a. Explain possible reasons why the peak torque of the knee extensor muscles exceeds that of the knee flexor muscles, regardless of the velocity of muscle activation.
b. Describe possible physiologic reasons for the nearly 40% reduction in peak torque of the knee extensor muscles at contraction velocities of 60 to 240 degrees/sec.
10. Describe the two fundamental strategies used by the nervous system to gradually increase muscle force.
11. Define motor unit. What is the Henneman Size Principle?
12. Describe how it is physiologically possible for a person to demonstrate clinically measurable increases in muscle strength before signs of muscle hypertrophy.
13. Explain how an otherwise healthy muscle within an immobilized limb can experience a relative transformation toward faster twitch characteristics.
14. What is the primary cause of reduced strength in healthy, aged persons?
15. What are some methods used to minimize unwanted “electrical noise” during collection of electromyographic signals?
 Answers to the study questions can be found on the Evolve website.