[level-membership-for-emergency-medicine-category]Chapter 5
Monitoring the Emergency Patient
Noninvasive Blood Pressure Measurement
Traditional blood pressure measurement by sphygmomanometer can be obtained by Doppler, palpation, auscultation, and oscillometric methods. Palpation allows for only systolic pressure determination, is time and resource intensive, and generally is used only in noisy environments (such as emergency medical services [EMS] transport) where measurement by oscillometric means may be difficult. Doppler is particularly helpful in identifying the presence of a systolic pulse in hypotensive individuals or in internally (i.e., atherosclerosis) or externally (i.e., compartment syndrome) flow-limited extremities. Auscultation, otherwise known as “manual” blood pressure measurement, remains a common, reliable, and reproducible method of blood pressure measurement 100 years after the Korotkoff technique was discovered. This method relies on placing the stethoscope at the antecubital fossa, inflating the blood pressure cuff, and recording the pressure at which auscultation of the pulse returns (the systolic blood pressure) and when it disappears (the diastolic blood pressure). Auscultation is generally considered to underestimate the systolic blood pressure and overestimate the diastolic pressure.1 Although accuracy has improved with standardization of the technology, this technique is occasionally prone to significant inaccuracy.2 The oscillometric technique measures oscillations in the pressure during deflation of the cuff; the maximal point of oscillation represents the mean arterial pressure. This is the most common noninvasive method of measuring blood pressure in the ED, commonly called the “automatic” blood pressure. This method has several advantages over auscultation, including less susceptibility to noise, the lack of necessity for specific placement of a transducer over the artery, less resource usage, regular measurement intervals, and the ability to embed readings into other clinical monitors. Comparisons of auscultation and oscillometric measurement with intra-arterial measurement have found good agreement (mean percent error ≤3%).3 Cuff-based blood pressure measurement is limited by technique and clinical circumstances. The quality of the device, cuff size, body positioning, and arm positioning are all components of the measuring technique that can affect the accuracy. Clinical circumstances such as obesity, dysrhythmias, and extremes of age (young children and elderly) may also affect the accuracy.4 The ease of use of oscillometric blood pressure measurement makes this modality ideal for ED noninvasive monitoring.
Other methods of providing continuous, noninvasive blood pressure monitoring often rely on partial radial artery compression or arterial loading counterpressure and offer results comparable to those of an arterial catheter with the benefit of added mobility.5,6 Newer continuous, noninvasive blood pressure monitors have the advantage of providing additional advanced hemodynamic measures, such as stroke volume and cardiac output,7 which may be beneficial in critically ill patients.
Pulse Oximetry
Early ED use of pulse oximetry came through extrapolation from anesthesiology literature, which demonstrated less frequent and shorter episodes of desaturation and earlier recognition of hypoxia during or after anesthesia.8,9 In the ED, pulse oximetry is largely used in initial triage of patients, particularly those with cardiopulmonary complaints, or in the monitoring and management of patients who are sedated or critically ill, particularly with respiratory distress or during endotracheal intubation. In the latter case, pulse oximetry has been shown to reduce the frequency of hypoxic episodes. SaO2 values at or below 96% have been shown to be 100% sensitive for detection of hypoxia (PaO2 < 70 torr), but such a cutoff can be different in patients with obstructive lung disease.10,11
Pulse oximetry has several important clinical limitations. By design, pulse oximetry measures only two wavelengths. At these wavelengths, traditional pulse oximeters are unable to distinguish oxyhemoglobin and deoxyhemoglobin from two other important dyshemoglobinemias: methemoglobin (MetHb) and carboxyhemoglobin (COHb). Multiwavelength CO-oximeters are now available that can distinguish the four wavelengths.12 Oxygen saturation by pulse oximetry will be equivalent to actual saturation, presuming insignificant amounts of MetHb and COHb exist in the blood. In the setting of MetHb or COHb exposure, the pulse oximeter will read falsely elevated levels of SaO2 even at relatively high exposures. In heavy smokers, COHb levels of 3 to 15% can commonly be found, but this has little impact on the accuracy of the SaO2. Although signal artifact is probably the most common technical limitation to adequate measurement, other limitations include low perfusion and therefore low pulsatile component, ambient light, deep skin pigmentation, methylene blue, and nail polish. Averaging saturation measurements over several seconds limits the impact of motion artifact and improves the accuracy.
End-Tidal Carbon Dioxide Monitoring
The concentration of carbon dioxide (CO2) in an exhaled breath is intrinsically linked to tissue metabolism, systemic circulation, and ventilation.13 Capnography is the graphic record, represented as a waveform, or capnogram, of the instantaneous CO2 concentrations in respired gases during a respiratory cycle.14,15 Capnography provides continuous, real-time, breath-to-breath feedback on the clinical status of the patient, allowing the clinician to determine the baseline ventilatory status and to track changes over time.16 Capnography is also a diagnostic monitoring modality because certain disease conditions are associated with characteristic waveforms.14–17 Although the concentrations of CO2 can be displayed continuously throughout the respiratory cycle, by convention only the maximum CO2 concentration at the end of each tidal breath, the ETCO2, is ordinarily displayed. Capnometry is the quantitative measurement of ETCO2 displayed as a number without a waveform. Colorimetric detectors use color scales to estimate ranges of ETCO2 but are not sufficiently accurate to give quantitative measurements. Their use is therefore limited to confirmation of correct endotracheal tube (ETT) placement and its continuous location in the trachea. Although originally used during general anesthesia in the operating room, ETCO2 monitoring has now become a standard monitoring modality in the ED and nonhospital medical setting.
Colorimetric CO2 detectors use pH-sensitive filter paper impregnated with metacresol purple, which changes color from purple (<4 mm Hg CO2) to tan (4-15 mm Hg CO2) to yellow (>20 mm Hg CO2) depending on the concentration of CO2.13,15 (See Chapter 1.) The indicator, housed in a plastic casing, is inserted between the ETT and the ventilator bag and detects changes on a breath-by-breath basis.13 These detectors are also inexpensive and easy to use and should be available in every ED and on every EMS unit that performs intubation for confirmation of ETT placement if capnography or capnometry is not available.
In patients with normal cardiopulmonary function, there is a close correlation between alveolar CO2 (PACO2) and arterial CO2 (PaCO2). The ETCO2 is usually 2 to 5 mm Hg less than the PaCO2 because of the dilution of the end-tidal gases by physiologic dead space gas.18,19 Conditions that affect ventilation-perfusion ratios (including pulmonary embolism), cardiac arrest, hypovolemia, obstructive lung disease, and the lateral decubitus position can widen the Pa-ETCO2 gradient.18–22 Several recent studies, however, have shown high concordance between ETCO2 and PaCO2 in adult asthmatics and in children with moderate and severe respiratory distress from bronchiolitis, asthma, and pneumonia.20 Although ETCO2 may not accurately reflect the absolute PaCO2 in critically ill patients, it is still valuable in detecting ventilatory trends and identifying sudden airway events.
Analysis of the shape of the capnogram can yield valuable diagnostic information.14–16 A normal capnogram has four phases (Fig. 5-1A). Phase 1-2 represents a CO2-free portion of the respiratory cycle. Most often this is the inspiratory phase, although it may represent apnea or a disconnection of the device from the patient. An elevation of this baseline above zero implies rebreathing of CO2, as in increased dead space in the circuit or contamination of the sensor.14–16
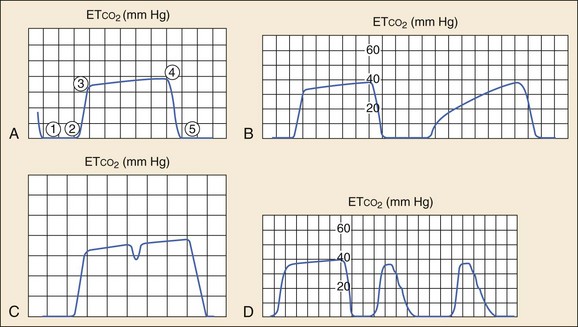
Phase 2-3, the rapid upstroke of the curve, represents the transition from inspiration to expiration and the mixing of dead space and alveolar gas. Prolongation of phase 2-3 (Fig. 5-1B) occurs with obstruction to expiratory gas flow (e.g., obstructive lung disease, bronchospasm, kinked ETT) or leaks in the breathing system.
Phase 3-4, the alveolar plateau, represents the predominance of CO2-rich alveolar gas in the breath stream and tends to slope gently upward with the uneven emptying of alveoli. Point 4 (the ETCO2) represents the maximum CO2 concentration in each breath and is the number that appears on the monitor. The slope of this phase can be increased by the same obstructive factors that increase the slope of phase 2-3 and is also a normal physiologic variation in pregnancy.13 A dip in the plateau indicates a spontaneous respiratory effort during mechanical ventilation, as in hypoxia, hypercarbia, or inadequate anesthesia (Fig. 5-1C).16,17
Phase 4-5, the inspiratory downstroke, is a nearly vertical drop to baseline. This slope can be prolonged and blend in with the expiratory phase in endotracheal cuff leaks (Fig. 5-1D). Abnormal respiratory patterns that are fast or chaotic limit the usefulness of ETCO2 monitoring because characteristic waveform patterns are difficult to discern.
Along with visualizing tracheal rings on bronchoscopy, capnography is the other gold standard used to confirm intubation of the trachea (see Chapter 1). Misleading ETCO2 readings can occur with esophageal intubation after bag or mask ventilation and ingestion of carbonated beverages or antacids. However, detection of ETCO2 usually ceases after six breaths, and if capnography is used, the waveform, which initially appears normal, progressively becomes smaller, losing height until it disappears (flatline) by the sixth breath.23 ETCO2 is also falsely elevated for 5 to 10 minutes after injection of sodium bicarbonate.24 Capnography can confirm intubation of the trachea but may give false-negative results in cardiac arrest if delivery of CO2 from the periphery to the lungs is sufficiently diminished. In these situations, it is difficult to determine whether the absence of the waveform is a result of esophageal intubation or poor pulmonary blood flow. In nonarrest settings the ETCO2 has 100% sensitivity and specificity in confirming correct tube placement and is also useful for monitoring for accidental tube dislodgement.
Airway, breathing, and circulatory assessment of critically ill or injured patients can be rapidly determined through use of ETCO2 values and the capnogram.25 The presence of a normal capnogram denotes a patent airway and spontaneous breathing, and normal ETCO2 levels indicate adequate ventilation and perfusion. Capnography can therefore be used to assess critically ill patients (including victims of chemical terrorism with nerve gas exposure) and patients who are actively seizing.25,26 Unlike pulse oximetry and electrocardiography, capnographic measurement is airway based and therefore is not subject to motion artifact. It also provides reliable readings in low-perfusion states.
Animal and human studies have shown that ETCO2 is a useful noninvasive measurement that is highly correlated with cardiac output and is the earliest indicator of return of spontaneous circulation (ROSC) in CPR.27,28 ROSC is heralded by an almost immediate increase in ETCO2 from baseline. Multiple studies have shown that ETCO2 has prognostic value in terms of mortality during CPR.27–32 No patient with a mean ETCO2 less than 10 mm Hg after 20 minutes of CPR has survived, giving ETCO2 measurement a high negative predictive value for failure of resuscitation. Despite these promising findings, capnography requires further prospective validation to confirm its usefulness as a prognostic tool in cardiac arrest.
Capnography is the only ventilation monitoring modality that is accurate and reliable in patients with active, generalized seizures.25,26 Capnographic data (capnogram, ETCO2, respiratory rate) can be used to distinguish among actively seizing patients with apnea (flatline waveform, no ETCO2 readings, and no chest wall movement), ineffective ventilation with low–tidal volume breathing (small capnograms, low ETCO2), and effective ventilation (normal capnogram, normal ETCO2).
Capnography can also rapidly detect the common airway, respiratory, and central nervous system complications associated with the nerve agents in chemical terrorism, including apnea, upper airway obstruction, laryngospasm, bronchospasm, and respiratory failure.15,25
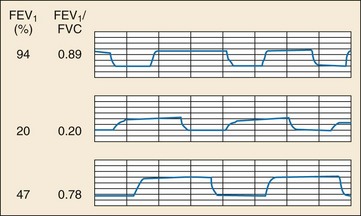
Bronchospasm in obstructive lung disease leads to upward slanting of the expiratory plateau of the capnogram (Fig. 5-2, middle panel). Changes in ETCO2 over time and the slope of this phase of the capnogram have been shown to correlate well with spirometric measurements (forced expiratory volume in 1 second [FEV1] and peak expiratory flow rate [PEFR]).33–35 Capnography has the advantage of being independent of effort, gender, age, and height and is a useful objective measure in asthmatic patients who are unwilling or unable to cooperate with spirometry (e.g., young children, ventilated patients, and patients in acute respiratory distress). Capnography can also be used to distinguish obstructive from restrictive lung disease.33 Characteristic capnographic patterns associated with restrictive and obstructive lung disease are shown in Figure 5-2 (bottom panel).
Capnography can also detect the common adverse airway and respiratory events associated with procedural sedation and analgesia (see Chapter 4).15 Both central and obstructive apnea can be almost instantaneously detected by capnography.15 Capnography is the earliest indicator of airway or respiratory compromise and displays an abnormally high or low ETCO2 5 to 240 seconds before pulse oximetry detects a falling oxyhemoglobin saturation, especially in patients receiving supplemental oxygen.36,37 Low ETCO2—that is, hypopneic hypoventilation—is commonly seen with sedative-hypnotic agents (especially propofol) and during deep sedation, represents low–tidal volume breathing (airway dead space remains constant but tidal volume decreases), and should not be misinterpreted as hyperventilation.15,38
Capnography appears to be more sensitive than clinical assessment of ventilation in the detection of apnea. Soto and colleagues found that during procedural sedation 10 of 39 patients (26%) experienced 20-second periods of apnea that were detected by capnography but not by the clinicians.39
Two recent randomized controlled trials on the use of capnography during procedural sedation demonstrated that use of capnography decreases hypoxia and allows for delivery of supplemental oxygen during sedation without affecting the accuracy of ventilatory monitoring.37,40 Both studies had the same design (two groups; standard monitoring blinded to capnography vs. standard monitoring and capnography) and the same outcome measure (hypoxia rate during sedation). The first study found a hypoxia rate of 42% in the no-capnography group and a rate of 25% in the capnography group. All patients with hypoxia exhibited capnographic changes before the hypoxic event. The second study found similar results: a hypoxia rate of 69% in the no-capnography group and 46% in the capnography group. The apnea rate was also significant: 62% in the no-capnography group and 41% in the capnography group.
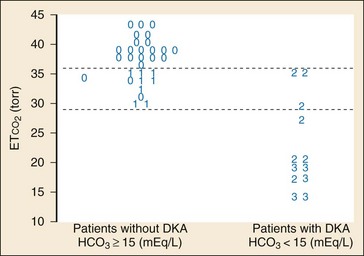
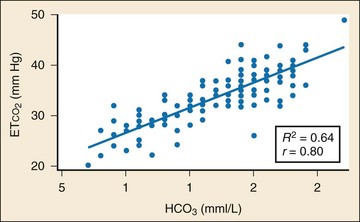
In addition to its established uses for assessment of ventilation and perfusion, capnography is a valuable tool for assessing metabolic status. Studies have shown a positive linear correlation between ETCO2 and serum bicarbonate (HCO3) in diabetes and in gastroenteritis and that ETCO2 can be used as an indicator of metabolic acidosis in these patients (Figs. 5-3 and 5-4, respectively).26,41,42 As a patient becomes acidotic, HCO3 decreases and a compensatory respiratory alkalosis develops with an increase in minute ventilation and a resultant decrease in ETCO2. The more acidotic the patient, the lower the HCO3; the higher the respiratory rate, the lower the ETCO2. Furthermore, ETCO2 can be used to distinguish diabetics with ketoacidosis (metabolic acidosis, compensatory tachypnea, low ETCO2) from those without (nonacidotic, normal respiratory rate, normal ETCO2). A similar association between ETCO2 and HCO3 was demonstrated in children with gastroenteritis.42
Cerebral Function Monitoring
The Bispectral Index (BIS) is used to monitor, analyze, and process a patient’s electroencephalogram during sedation to produce a single number—the BIS score. This unitless number, ranging from 0 to 100, is used as an indicator of the depth of sedation, with 0 representing electroencephalographic silence and 100 a fully awake adult.43
BIS monitoring has been studied in the ED in an attempt to objectify sedation endpoints by titrating to a target BIS score.44–46 However, the evidence of its ability to reliably reflect depth of sedation is conflicting. More important, the threshold beyond which ventilatory compromise occurs has not been determined, further limiting the usefulness of routine BIS monitoring for sedation in the ED.44–48 A recent study found that BIS monitoring reliably distinguished patients undergoing procedural sedation and analgesia who were sedated to the point of general anesthesia from those with lesser degrees of sedation but did not discriminate mild-to-moderate sedation from moderate-to-deep sedation.46 The findings of Miner and coauthors supported this contention in that the assignment of a preprocedural BIS target sedation level of moderate or deep procedural sedation did not influence the level of sedation achieved, the rate of respiratory depression, the occurrence of complications, the time to return of baseline mental status, or the success of the procedure. They concluded that the assignment of a preprocedural target sedation level was not an effective means of changing the outcome of procedural sedation in the ED.47
Two small pediatric ED studies found that BIS monitoring correlated with clinical sedation scores for nondissociative agents44,48 but not ketamine. Determination of usefulness and effectiveness on outcome for children undergoing procedural sedation and analgesia awaits larger trials.
Another technology that monitors cerebral function is cerebral oximetry. Cerebral tissue oxygenation (i.e., regional oxygen saturation, rSO2) is measured by near-infrared spectroscopy monitoring of the nonpulsatile signal component, reflecting tissue circulation of cerebral vasculature. This technology has been primarily studied in the operating room, with one ED study during procedural sedation showing poor correlation among changes in cerebral oximetry, pulse oximetry, and capnography.49
Fetal Monitoring
A small but significant percentage of all pregnancies (6-7%) are complicated by traumatic and/or accidental injury.50 Trauma represents the leading nonobstetric cause of death and carries a mortality rate of 6 to 7%.51 Whereas the majority of injuries are related to motor vehicle accidents, other common causes include assaults, domestic abuse, and falls. Uterine contractions occur in almost 50% of patients, although preterm labor and preterm delivery are much less common—5 to 15% and 1 to 2% of the time, respectively.50 However, these peripartum complications and early preterm birth are difficult to predict after trauma. As a result, the Eastern Association for the Surgery of Trauma recommendations include cardiotocographic monitoring for a minimum of 6 hours after trauma in women at more than 20 weeks’ gestation. In addition to serial examination, such fetal monitoring allows for the identification of uterine contractions and nonreassuring heart rate changes. Clinically concerning heart rate patterns can include persistent fetal tachycardia, bradycardia, loss of baseline variability, or late decelerations.
Monitor Alarms and Limits
Continuous vital sign monitoring, with alarm thresholds that notify staff regarding changes in physiologic conditions, has become a routine part of ED care. Although these alarms are designed to be highly sensitive, their lack of specificity has the potential to desensitize staff and reduce alarm effectiveness in identifying important changes in the clinical condition (i.e., “nuisance alarms”). Continuous monitoring in select patient populations, such as those with low-risk chest pain, has limited usefulness, with less than 1% of alarms resulting in a change in clinical management.52,53 A multidisciplinary team-based approach that focuses on identifying optimal application of monitoring, standardizing alarm limits and the staff response, and using improved alarm technology has the potential to improve patient safety and enhance workplace efficiency and satisfaction.54


References
1. Breit, SN, O’Rourke, MF. Comparison of direct and indirect arterial pressure measurements in hospitalized patients. Aust N Z J Med. 1974;4:485–491.
2. Perloff, D, et al. Human blood pressure determination by sphygmomanometry. Circulation. 1993;88(5 Pt 1):2460–2470.
3. Borow, KM, Newburger, JW. Noninvasive estimation of central aortic pressure using the oscillometric method for analyzing systemic artery pulsatile blood flow: Comparative study of indirect systolic, diastolic, and mean brachial artery pressure with simultaneous direct ascending aortic pressure measurements. Am Heart J. 1982;103:879–886.
4. Pickering, TG, et al. Recommendations for blood pressure measurement in humans and experimental animals. Part 1: Blood pressure measurement in humans. A statement for professionals from the Subcommittee of Professional and Public Education of the American Heart Association Council on High Blood Pressure Research. Hypertension. 2005;45:142–161.
5. Thomas, SH, Winsor, GR, Pang, PS, Driscoll, KA, Parry, BA. Use of a radial artery compression device for noninvasive, near-continuous blood pressure monitoring in the ED. Am J Emerg Med. 2004;22:474–478.
6. Fortin, J, et al. Continuous non-invasive blood pressure monitoring using concentrically interlocking control loops. Comput Biol Med. 2006;36:941–957.
7. Jansen, JR, et al. A comparison of cardiac output derived from the arterial pressure wave against thermodilution in cardiac surgery patients. Br J Anaesth. 2001;87:212–222.
8. McKay, WP, Noble, WH. Critical incidents detected by pulse oximetry during anaesthesia. Can J Anaesth. 1988;35(3 Pt 1):265–269.
9. Morris, RW, Buschman, A, Warren, DL, Philip, JH, Raemer, DB. The prevalence of hypoxemia detected by pulse oximetry during recovery from anesthesia. J Clin Monit. 1988;4:16–20.
10. Witting, MD, Lueck, CH. The ability of pulse oximetry to screen for hypoxemia and hypercapnia in patients breathing room air. J Emerg Med. 2001;20:341–348.
11. Kelly, AM, McAlpine, R, Kyle, E. How accurate are pulse oximeters in patients with acute exacerbations of chronic obstructive airways disease? Respir Med. 2001;95:336–340.
12. Roth, D, et al. Accuracy of noninvasive multiwave pulse oximetry compared with carboxyhemoglobin from blood gas analysis in unselected emergency department patients. Ann Emerg Med. 2011;58:74–79.
13. Buhre, W, Rossaint, R. Perioperative management and monitoring in anaesthesia. Lancet. 2003;362:1839–1846.
14. Swedlow, DB. Capnometry and capnography: The anesthesia disaster early warning system. Semin Anesth. 1986;5:194–205.
15. Krauss, B, Hess, DR. Capnography for procedural sedation and analgesia in the emergency department. Ann Emerg Med. 2007;50:172–181.
16. Smalhout, B, Kalenda, Z. An Atlas of Capnography. Zeist, Utrecht, The Netherlands: Kerckebusch; 1975.
17. Kalenda, Z. Mastering Infrared Capnography. Zeist, Utrecht, The Netherlands: Kerckebusch; 1989.
18. Hoffbrand, BI. The expiratory capnogram: A measure of ventilation-perfusion inequalities. Thorax. 1966;21:518–523.
19. Yamanaka, MK, Sue, DY. Comparison of arterial-end-tidal PCO2 difference and dead space/tidal volume ratio in respiratory failure. Chest. 1987;92:832–835.
20. Corbo, J, Bijur, P, Lahn, M, Gallagher, EJ. Concordance between capnography and arterial blood gas measurements of carbon dioxide in acute asthma. Ann Emerg Med. 2005;46:323–327.
21. Hardman, JG, Aitkenhead, AR. Estimating alveolar dead space from the arterial to end-tidal CO(2) gradient: A modeling analysis. Anesth Analg. 2003;97:1846–1851.
22. Kline, JA, Kubin, AK, Patel, MM, Easton, EJ, Seupal, RA. Alveolar dead space as a predictor of severity of pulmonary embolism. Acad Emerg Med. 2000;7:611–617.
23. Garnett, AR, Gervin, CA, Gervin, AS. Capnographic waveforms in esophageal intubation: Effect of carbonated beverages. Ann Emerg Med. 1989;18:387–390.
24. Okamoto, H, Hoka, S, Kawasaki, T, Okuyama, T, Takahashi, S. Changes in end-tidal carbon dioxide tension following sodium bicarbonate administration: Correlation with cardiac output and haemoglobin concentration. Acta Anaesthesiol Scand. 1995;39:79–84.
25. Krauss, B. Capnography as a rapid assessment and triage tool for chemical terrorism. Pediatr Emerg Care. 2005;21:493–497.
26. Abramo, TJ, Wiebe, RA, Scott, S, Goto, CS, McIntire, DD. Noninvasive capnometry monitoring for respiratory status during pediatric seizures. Crit Care Med. 1997;25:1242–1246.
27. Falk, JL, Rackow, EC, Weil, MH. End-tidal carbon dioxide concentration during cardiopulmonary resuscitation. N Engl J Med. 1988;318:607–611.
28. Garnett, AR, Ornato, JP, Gonzalez, ER, Johnson, EB. End-tidal carbon dioxide monitoring during cardiopulmonary resuscitation. JAMA. 1987;257:512–515.
29. Ahrens, T, et al. End-tidal carbon dioxide measurements as a prognostic indicator of outcome in cardiac arrest. Am J Crit Care. 2001;10:391–398.
30. Cantineau, JP, et al. End-tidal carbon dioxide during cardiopulmonary resuscitation in humans presenting mostly with asystole: A predictor of outcome. Crit Care Med. 1996;24:791–796.
31. Deakin, CD, Sado, DM, Coats, TJ, Davies, G. Prehospital end-tidal carbon dioxide concentration and outcome in major trauma. J Trauma. 2004;57:65–68.
32. Levine, RL, Wayne, MA, Miller, CC. End-tidal carbon dioxide and outcome of out-of-hospital cardiac arrest. N Engl J Med. 1997;337:301–306.
33. Krauss, B, et al. Capnogram shape in obstructive lung disease. Anesth Analg. 2005;100:884–888.
34. Yaron, M, Padyk, P, Hutsinpiller, M, Cairns, CB. Utility of the expiratory capnogram in the assessment of bronchospasm. Ann Emerg Med. 1996;28:403–407.
35. You, B, Peslin, R, Duvivier, C, Vu, VD, Grilliat, JP. Expiratory capnography in asthma: Evaluation of various shape indices. Eur Respir J. 1994;7:318–323.
36. Burton, JH, Harrah, JD, Germann, CA, Dillon, DC. Does end-tidal carbon dioxide monitoring detect respiratory events prior to current sedation monitoring practices? Acad Emerg Med. 2006;13:500–504.
37. Deitch, K, Miner, J, Chudnofsky, CR, Dominici, P, Latta, D. Does end tidal CO2 monitoring during emergency department procedural sedation and analgesia with propofol decrease the incidence of hypoxic events? A randomized, controlled trial. Ann Emerg Med. 2010;55:258–264.
38. Langhan, ML, Chen, L, Marshall, C, Santucci, KA. Detection of hypoventilation by capnography and its association with hypoxia in children undergoing sedation with ketamine. Pediatr Emerg Care. 2011;27:394–397.
39. Soto, RG, Fu, ES, Vila, H, Jr., Miguel, RV. Capnography accurately detects apnea during monitored anesthesia care. Anesth Analg. 2004;99:379–382.
40. Qadeer, MA, et al. Capnographic monitoring of respiratory activity improves safety of sedation for endoscopic cholangiopancreatography and ultrasonography. Gastroenterology. 2009;136:1568–1576.
41. Fearon, DM, Steele, DW. End-tidal carbon dioxide predicts the presence and severity of acidosis in children with diabetes. Acad Emerg Med. 2002;9:1373–1378.
42. Nagler, J, Wright, RO, Krauss, B. End-tidal carbon dioxide as a measure of acidosis among children with gastroenteritis. Pediatrics. 2006;118:260–267.
43. Rosow, C, Manberg, PJ. Bispectral index monitoring. Anesthesiol Clin North America. 2001;19:947–966.
44. Agrawal, D, Feldman, HA, Krauss, B, Waltzman, ML. Bispectral index monitoring quantifies depth of sedation during emergency department procedural sedation and analgesia in children. Ann Emerg Med. 2004;43:247–255.
45. Fatovich, DM, Gope, M, Paech, MJ. A pilot trial of BIS monitoring for procedural sedation in the emergency department. Emerg Med Australas. 2004;16:103–107.
46. Gill, M, Green, SM, Krauss, B. A study of the Bispectral Index Monitor during procedural sedation and analgesia in the emergency department. Ann Emerg Med. 2003;41:234–241.
47. Miner, JR, Huber, D, Nichols, S, Biros, M. The effect of the assignment of a pre-sedation target level on procedural sedation using propofol. J Emerg Med. 2007;32:249–255.
48. Overly, FL, et al. Bispectral analysis during pediatric procedural sedation. Pediatr Emerg Care. 2005;21:6–11.
49. Padmanabhan, P, Berkenbosch, JW, Lorenz, D, Pierce, MC. Evaluation of cerebral oxygenation during procedural sedation in children using near infrared spectroscopy. Ann Emerg Med. 2009;54:205–213.
50. Connolly, AM, Katz, VL, Bash, KL, McMahon, MJ, Hansen, WF. Trauma and pregnancy. Am J Perinatol. 1997;14:331–336.
51. Barraco, RD, et al. Practice management guidelines for the diagnosis and management of injury in the pregnant patient: The EAST Practice Management Guidelines Work Group. J Trauma. 2010;69:211–214.
52. Hollander, JE, Sites, FD, Pollack, CV, Jr., Shofer, FS. Lack of utility of telemetry monitoring for identification of cardiac death and life-threatening ventricular dysrhythmias in low-risk patients with chest pain. Ann Emerg Med. 2004;43:71–76.
53. Atzema, C, Schull, MJ, Borgundvaag, B, Slaughter, GR, Lee, CK. ALARMED: Adverse events in low-risk patients with chest pain receiving continuous electrocardiographic monitoring in the emergency department. A pilot study. Am J Emerg Med. 2006;24:62–67.
54. Graham, KC, Cvach, M. Monitor alarm fatigue: Standardizing use of physiological monitors and decreasing nuisance alarms. Am J Crit Care. 2010;19:28–34.
[/level-membership-for-emergency-medicine-category][not-level-membership-for-emergency-medicine-category]Chapter 5
Monitoring the Emergency Patient
Noninvasive Blood Pressure Measurement
Traditional blood pressure measurement by sphygmomanometer can be obtained by Doppler, palpation, auscultation, and oscillometric methods. Palpation allows for only systolic pressure determination, is time and resource intensive, and generally is used only in noisy environments (such as emergency medical services [EMS] transport) where measurement by oscillometric means may be difficult. Doppler is particularly helpful in identifying the presence of a systolic pulse in hypotensive individuals or in internally (i.e., atherosclerosis) or externally (i.e., compartment syndrome) flow-limited extremities. Auscultation, otherwise known as “manual” blood pressure measurement, remains a common, reliable, and reproducible method of blood pressure measurement 100 years after the Korotkoff technique was discovered. This method relies on placing the stethoscope at the antecubital fossa, inflating the blood pressure cuff, and recording the pressure at which auscultation of the pulse returns (the systolic blood pressure) and when it disappears (the diastolic blood pressure). Auscultation is generally considered to underestimate the systolic blood pressure and overestimate the diastolic pressure.1 Although accuracy has improved with standardization of the technology, this technique is occasionally prone to significant inaccuracy.2 The oscillometric technique measures oscillations in the pressure during deflation of the cuff; the maximal point of oscillation represents the mean arterial pressure. This is the most common noninvasive method of measuring blood pressure in the ED, commonly called the “automatic” blood pressure. This method has several advantages over auscultation, including less susceptibility to noise, the lack of necessity for specific placement of a transducer over the artery, less resource usage, regular measurement intervals, and the ability to embed readings into other clinical monitors. Comparisons of auscultation and oscillometric measurement with intra-arterial measurement have found good agreement (mean percent error ≤3%).3 Cuff-based blood pressure measurement is limited by technique and clinical circumstances. The quality of the device, cuff size, body positioning, and arm positioning are all components of the measuring technique that can affect the accuracy. Clinical circumstances such as obesity, dysrhythmias, and extremes of age (young children and elderly) may also affect the accuracy.4 The ease of use of oscillometric blood pressure measurement makes this modality ideal for ED noninvasive monitoring.
Other methods of providing continuous, noninvasive blood pressure monitoring often rely on partial radial artery compression or arterial loading counterpressure and offer results comparable to those of an arterial catheter with the benefit of added mobility.5,6 Newer continuous, noninvasive blood pressure monitors have the advantage of providing additional advanced hemodynamic measures, such as stroke volume and cardiac output,7 which may be beneficial in critically ill patients.
Pulse Oximetry
Early ED use of pulse oximetry came through extrapolation from anesthesiology literature, which demonstrated less frequent and shorter episodes of desaturation and earlier recognition of hypoxia during or after anesthesia.8,9 In the ED, pulse oximetry is largely used in initial triage of patients, particularly those with cardiopulmonary complaints, or in the monitoring and management of patients who are sedated or critically ill, particularly with respiratory distress or during endotracheal intubation. In the latter case, pulse oximetry has been shown to reduce the frequency of hypoxic episodes. SaO2 values at or below 96% have been shown to be 100% sensitive for detection of hypoxia (PaO2 < 70 torr), but such a cutoff can be different in patients with obstructive lung disease.10,11
Pulse oximetry has several important clinical limitations. By design, pulse oximetry measures only two wavelengths. At these wavelengths, traditional pulse oximeters are unable to distinguish oxyhemoglobin and deoxyhemoglobin from two other important dyshemoglobinemias: methemoglobin (MetHb) and carboxyhemoglobin (COHb). Multiwavelength CO-oximeters are now available that can distinguish the four wavelengths.12 Oxygen saturation by pulse oximetry will be equivalent to actual saturation, presuming insignificant amounts of MetHb and COHb exist in the blood. In the setting of MetHb or COHb exposure, the pulse oximeter will read falsely elevated levels of SaO2 even at relatively high exposures. In heavy smokers, COHb levels of 3 to 15% can commonly be found, but this has little impact on the accuracy of the SaO2. Although signal artifact is probably the most common technical limitation to adequate measurement, other limitations include low perfusion and therefore low pulsatile component, ambient light, deep skin pigmentation, methylene blue, and nail polish. Averaging saturation measurements over several seconds limits the impact of motion artifact and improves the accuracy.
End-Tidal Carbon Dioxide Monitoring
The concentration of carbon dioxide (CO2) in an exhaled breath is intrinsically linked to tissue metabolism, systemic circulation, and ventilation.13 Capnography is the graphic record, represented as a waveform, or capnogram, of the instantaneous CO2 concentrations in respired gases during a respiratory cycle.14,15 Capnography provides continuous, real-time, breath-to-breath feedback on the clinical status of the patient, allowing the clinician to determine the baseline ventilatory status and to track changes over time.16 Capnography is also a diagnostic monitoring modality because certain disease conditions are associated with characteristic waveforms.14–17 Although the concentrations of CO2 can be displayed continuously throughout the respiratory cycle, by convention only the maximum CO2 concentration at the end of each tidal breath, the ETCO2, is ordinarily displayed. Capnometry is the quantitative measurement of ETCO2 displayed as a number without a waveform. Colorimetric detectors use color scales to estimate ranges of ETCO2 but are not sufficiently accurate to give quantitative measurements. Their use is therefore limited to confirmation of correct endotracheal tube (ETT) placement and its continuous location in the trachea. Although originally used during general anesthesia in the operating room, ETCO2 monitoring has now become a standard monitoring modality in the ED and nonhospital medical setting.
Colorimetric CO2 detectors use pH-sensitive filter paper impregnated with metacresol purple, which changes color from purple (<4 mm Hg CO2) to tan (4-15 mm Hg CO2) to yellow (>20 mm Hg CO2) depending on the concentration of CO2.13,15 (See Chapter 1.) The indicator, housed in a plastic casing, is inserted between the ETT and the ventilator bag and detects changes on a breath-by-breath basis.13 These detectors are also inexpensive and easy to use and should be available in every ED and on every EMS unit that performs intubation for confirmation of ETT placement if capnography or capnometry is not available.
In patients with normal cardiopulmonary function, there is a close correlation between alveolar CO2 (PACO2) and arterial CO2 (PaCO2). The ETCO2 is usually 2 to 5 mm Hg less than the PaCO2 because of the dilution of the end-tidal gases by physiologic dead space gas.18,19 Conditions that affect ventilation-perfusion ratios (including pulmonary embolism), cardiac arrest, hypovolemia, obstructive lung disease, and the lateral decubitus position can widen the Pa-ETCO2 gradient.18–22 Several recent studies, however, have shown high concordance between ETCO2 and PaCO2 in adult asthmatics and in children with moderate and severe respiratory distress from bronchiolitis, asthma, and pneumonia.20 Although ETCO2 may not accurately reflect the absolute PaCO2 in critically ill patients, it is still valuable in detecting ventilatory trends and identifying sudden airway events.
Analysis of the shape of the capnogram can yield valuable diagnostic information.14–16 A normal capnogram has four phases (Fig. 5-1A). Phase 1-2 represents a CO2-free portion of the respiratory cycle. Most often this is the inspiratory phase, although it may represent apnea or a disconnection of the device from the patient. An elevation of this baseline above zero implies rebreathing of CO2
[/not-level-membership-for-emergency-medicine-category]
