Chapter 9 Monitoring of the Heart and Vascular System
HEMODYNAMIC MONITORING
Standard monitoring for cardiac surgical patients includes BP, ECG, central venous pressure (CVP), urine output, temperature, capnometry, pulse oximetry, and intermittent arterial blood gas analysis (Box 9-1). The next tier of monitoring includes PA catheters, left atrial pressure (LAP) catheters, thermodilution cardiac output (CO) measurements, TEE, and indices of tissue oxygen transport (Box 9-2). All of these measurements and their derivatives can be obtained and recorded. The interpretation of these complex data, however, requires an astute clinician who is aware of the patient’s overall condition and the limitations of the monitors.1
ARTERIAL PRESSURE MONITORING

or

Arterial Cannulation Sites
Allen’s test is performed by compressing the radial and ulnar arteries and by exercising the hand until it is pale. The ulnar artery is then released (with the hand open loosely), and the time until the hand regains its normal color is noted. With a normal collateral circulation, the color returns to the hand in about 5 seconds. If, however, the hand takes longer than 15 seconds to return to its normal color, cannulation of the radial artery on that side is controversial. The hand may remain pale if the fingers are hyperextended or widely spread apart, even in the presence of a normal collateral circulation. Variations on Allen’s test include using a Doppler probe or pulse oximeter to document collateral flow. If Allen’s test demonstrates that the hand depends on the radial artery for adequate filling, and other cannulation sites are not available, the ulnar artery may be selected.2
The brachial artery lies medial to the bicipital tendon in the antecubital fossa, in close proximity to the median nerve. Brachial artery pressure tracings resemble those in the femoral artery, with less systolic augmentation than radial artery tracings. Brachial arterial pressures were found to more accurately reflect central aortic pressures than radial arterial pressures before and after CPB. The complications from percutaneous brachial artery catheter monitoring are lower than those after brachial artery cutdown for cardiac catheterization.3 A few series of perioperative brachial arterial monitoring have documented the relative safety of this technique.
Indications
The indications for invasive arterial monitoring are provided in Box 9-3.
Insertion Techniques
Direct Cannulation
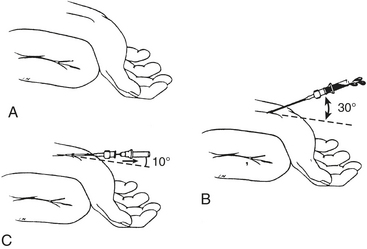
Proper technique is helpful in obtaining a high degree of success in arterial catheterization. The wrist should be placed in a dorsiflexed position on an armboard and immobilized in a supinated position. It is helpful to draw the course of the artery for 1 inch and to be comfortably seated. Doppler devices and ultrasonic vessel finders may also be of value. Local anesthetic is injected intradermally over the artery, and a small skin nick may be made to allow passage of the catheter-over-needle assembly into the subcutaneous tissue without crimping secondary to penetration of the unit through the skin. A 20-gauge or smaller, 3- to 5-cm, nontapered Teflon catheter over needle is used, without a syringe attached, to make the puncture. If a syringe is used, the plunger should be removed to allow free flow of blood to detect when the artery has been punctured. The angle between the needle and the skin should be shallow (30 degrees or less), and the needle should be advanced parallel to the course of the artery. When the artery is entered, the angle between the needle and skin is reduced to 10 degrees, the needle is advanced another 1 to 2 mm to ensure that the tip of the catheter also lies within the lumen of the vessel, and the outer catheter is then threaded off the needle while watching that blood continues to flow out of the needle hub (Fig. 9-1). After insertion of the catheter, the wrist should be taken out of the dorsiflexed position, because continued extreme dorsiflexion can lead to median nerve damage by stretching of the nerve over the wrist. An armboard may still be used to prevent the wrist from flexing, which causes kinking of the catheter and damping of the arterial waveform.
CENTRAL VENOUS PRESSURE MONITORING
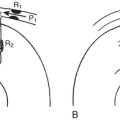
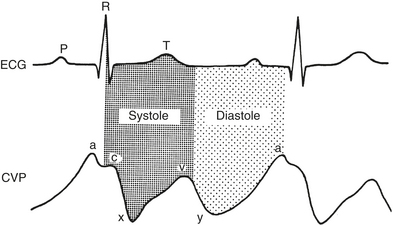
The normal CVP waveform consists of three upward deflections (A, C, and V waves) and two downward deflections (X and Y descents) (Fig. 9-2). The A wave is produced by right atrial contraction and occurs just after the P wave on the ECG. The C wave occurs because of the isovolumic ventricular contraction forcing the tricuspid valve to bulge upward into the right atrium. The pressure within the right atrium then decreases as the tricuspid valve is pulled away from the atrium during RV ejection, forming the X descent. RA filling continues during late ventricular systole, forming the V wave. The Y descent occurs when the tricuspid valve opens and blood from the right atrium empties rapidly into the right ventricle during early diastole.
Internal Jugular Vein
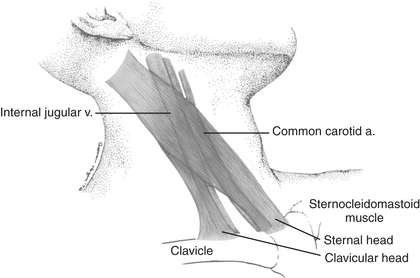
Cannulation of the internal jugular vein (IJV) was first described by English and coworkers in 1969. Its popularity among anesthesiologists has steadily increased since that time. Advantages of this technique include the high success rate as a result of the relatively predictable relationship of the anatomic structures; a short, straight course to the right atrium that almost always assures RA or superior vena cava (SVC) localization of the catheter tip; easy access from the head of the operating room table; and fewer complications than with subclavian vein catheterization. The IJV is located under the medial border of the lateral head of the sternocleidomastoid (SCM) muscle (Fig. 9-3). The carotid artery is usually deep and medial to the IJV. The right IJV is preferred, because this vein takes the straightest course into the SVC, the right cupola of the lung may be lower than the left, and the thoracic duct is on the left side.
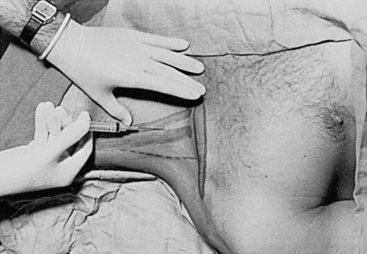
The preferred middle approach to the right IJV is shown in Figure 9-4. With the patient supine or in Trendelenburg position and the head turned toward the contralateral side, the fingers of the left hand are used to palpate the two heads of the SCM muscle and the carotid pulse. These fingers then hold the skin stable over the underlying structures while local anesthetic is infiltrated into the skin and subcutaneous tissues. A 22-gauge “finder” needle is placed at the apex of the triangle formed by the two heads of the SCM muscle at a 45-degree angle to the skin and directed toward the ipsilateral nipple. If venous blood return is not obtained, the needle is withdrawn to the subcutaneous tissue and then passed in a more lateral or medial direction until the vein is located. This needle reduces the risk of consequences related to inadvertent carotid arterial puncture and tissue trauma if localization of the vein is difficult. When venous blood is aspirated through the “finder” needle, the syringe and needle are withdrawn, leaving a small trail of blood on the drape to indicate the direction of the vein. Alternatively, the needle and syringe can be fixated and used as an identifying needle. Then, a syringe attached to an 18-gauge intravenous catheter-over-needle is inserted in an identical fashion. When venous return is present, the whole assembly is lowered to prevent the needle from going through the posterior wall of the central vein and advanced an additional 1 to 2 mm until the tip of the catheter is within the lumen of the vein. The catheter is then threaded into the vein.
ultrasonic guidance of internal jugular vein cannulation
Ultrasound has been increasingly used to define the anatomic variations of the IJV. A review and meta-analysis of randomized controlled trials looking at ultrasound-guided central venous cannulation found that real-time two-dimensional ultrasound for IJV cannulation had a significantly higher success rate overall and on the first attempt compared with the landmark method in adults.4 Most studies have demonstrated that two-dimensional ultrasonic guidance of IJV cannulation is helpful in locating the vein, permits more rapid cannulation, and decreases the incidence of arterial puncture.5 Circumstances in which ultrasonic guidance of IJV cannulation can be advantageous include patients with difficult neck anatomy (e.g., short neck, obesity), prior neck surgery, anticoagulated patients, and infants.
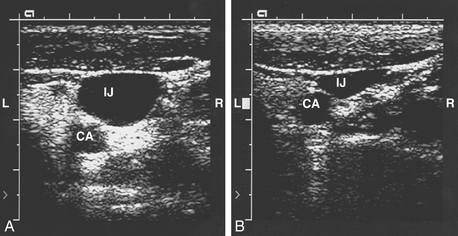
Ultrasound has provided more precise data regarding the structural relationship between the IJV and the carotid artery (Fig. 9-5). Troianos and associates found that in more than 54% of patients, more than 75% of the IJV overlies the carotid artery. Patients who were older than 60 years were more likely to have this type of anatomy.6 There was greater overlap of the IJV and the carotid artery when the head is rotated 80 degrees compared with head rotation of only 0 to 40 degrees. The data from 2 and 4 cm above the clavicle did not differ, and the percentage overlap was larger on the left side of the neck compared with the right. Excessive rotation of the head of the patient toward the contralateral side may distort the normal anatomy in a manner that increases the risk of inadvertent carotid artery puncture.7 Doppler ultrasonography has also been used to demonstrate that the Valsalva maneuver increases IJV cross-sectional area by approximately 25% and that the Trendelenburg position increases it by approximately 37%.
Indications
Central venous pressure monitoring is often performed to obtain an indication of intravascular volume status. The accuracy and reliability of CVP monitoring depend on many factors, including the functional status of the right and left ventricles, the presence of pulmonary disease, and ventilatory factors, such as positive end-expiratory pressure (PEEP). The CVP may reflect left-sided heart filling pressures, but only in patients with good LV function. Elderly patients have a high incidence of coronary artery and pulmonary disease, and the CVP is therefore less likely to accurately reflect left-sided filling pressures in this population. Perioperative indications for the insertion of a central venous catheter are listed in Box 9-4.
BOX 9-4 Indications for Central Venous Catheter Placement
Complications
The complications of central venous cannulation can be roughly divided into three categories: complications of vascular access, complications of catheter insertion, or complications of catheter presence. These are summarized in Box 9-5.
Strict aseptic technique is required to minimize catheter-related infections. Full barrier precautions during insertion of central venous catheters have been shown to decrease the incidence of catheter-related infections.8 Subcutaneous tunneling of central venous catheters inserted into the internal jugular and femoral veins, antiseptic barrier-protected hub for central venous catheters, and antiseptic/antibiotic-impregnated short-term central venous catheters have been shown to reduce catheter-related infections. Hospital policies differ with respect to the permissible duration of catheterization at particular sites, but routine replacement of central venous catheters to prevent catheter-related infections is not recommended.
PULMONARY ARTERIAL PRESSURE MONITORING
The introduction of the flow-directed PA catheter was a quantum advance in the monitoring of patients in the perioperative period. Since the 1970s, its use has increased the amount of diagnostic information that can be obtained at the bedside in critically ill patients. It is impressive to observe large changes in the PAP and PCWP with almost no reflection in the CVP. Connors and coworkers prospectively analyzed 62 consecutive PA catheterizations. They found that fewer than one half of a group of clinicians correctly predicted the PCWP or CO and that more than 50% made at least one change in therapy based on data from the PA catheterization. Waller and Kaplan demonstrated that a group of experienced cardiac anesthesiologists and surgeons who were blinded to the information from PA catheterization during CABG surgery were unaware of any problem during 65% of severe hemodynamic abnormalities. Similarly, Iberti and Fisher showed that ICU physicians were unable to accurately predict hemodynamic data on clinical grounds and that 60% made at least one change in therapy and 33% changed their diagnosis based on PA catheter data*. The clinical significance of these changes has been questioned because the weight of evidence-based medicine on the subject does not support improvements in outcome related to PA catheter monitoring, and the overall use of the PA catheter has decreased 60–80% over the past decade. Nevertheless, with increasing numbers of patients with multisystem organ dysfunction undergoing cardiac surgical procedures, PA catheter monitoring is prevalent in cardiac surgical settings. An understanding of the potential benefits and pitfalls of PA catheterization is therefore essential for anesthesiologists.
Specific information that can be gathered with the PA catheter and the quantitative measurements of cardiovascular and pulmonary function that can be derived from this information are listed in Tables 9-1 and 9-2.
| Location/Pressure | Mean (mm Hg) | Range (mm Hg) |
|---|---|---|
| Right atrial | 5 | 1-10 |
| Right ventricular | 25/5 | 15-30/0-8 |
| Pulmonary arterial systolic/diastolic | 23/9 | 15-30/5-15 |
| Mean pulmonary arterial | 15 | 10-20 |
| Pulmonary capillary wedge | 10 | 5-15 |
| Left atrial | 8 | 4-12 |
| Left ventricular end-diastolic | 8 | 4-12 |
| Left ventricular systolic | 130 | 90-140 |
Table 9-2 Derived Hemodynamic Parameters
| Parameter/Formula | Normal Values |
|---|---|
| Cardiac index: CI = CO/BSA | 2.8-4.2 L/min/m2 |
| Stroke volume: SV = CO × 1000/HR | 50-110 mL/beat |
| Stroke index: SI = SV/BSA | 30-65 mL/beat/m2 |
| Left ventricular stroke work index: LVSWI = 1.36 × (MAP − PCWP) × SI/100 | 45-60 g•m/m2 |
| Right ventricular stroke work index: RVSWI = 1.36 × (MPAP − CVP) × SI/100 | 5-10 g•m/m2 |
| Systemic vascular resistance: SVR = (MAP − CVP) × 80/CO | 900-1400 dynes•s•cm−5 |
| Systemic vascular resistance index: SVRI = (MAP − CVP) × 80/CI | 1500-2400 dynes•s•cm−5/m2 |
| Pulmonary vascular resistance: PVR = (MPAP − PCWP) × 80/CO | 150-250 dynes•s•cm−5 |
| Pulmonary vascular resistance index: PVRI = (MPAP − PCWP) × 80/CI | 250-400 dynes•s•cm−5/m2 |
BSA = body surface area; CI = cardiac index; CO = cardiac output; CVP = central venous pressure; HR = heart rate; LVSWI = left ventricular stroke work index; MAP = mean arterial pressure; PAP = pulmonary arterial pressure; PCWP = pulmonary capillary wedge pressure; PVR = pulmonary vascular resistance; PVRI = pulmonary vascular resistance index; RVSWI = right ventricular stroke work index; SI = stroke index; SV = stroke volume; SVR = systemic vascular resistance; SVRI = systemic vascular resistance index.
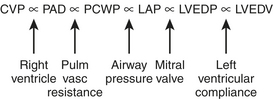
One of the main reasons that clinicians measure PCWP and PA diastolic pressure (PADP) is that these parameters are estimates of LAP, which is an estimate of left ventricular end-diastolic pressure (LVEDP). LVEDP is an index of left ventricular end-diastolic volume (LVEDV), which correlates well with left ventricular preload. The relationship between LVEDP and LVEDV is described by the left ventricular compliance curve. This nonlinear curve is affected by many factors, such as ventricular hypertrophy and myocardial ischemia. The PCWP and PADP do not directly measure LV preload. The relationship of these parameters is diagrammed in Figure 9-6.
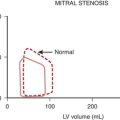
The presence of large V waves in the PCWP tracing of patients with mitral regurgitation leads to an overestimation of the LVEDP. In patients with mitral stenosis, using the PCWP instead of the LAP to assess the transmitral gradient has been shown to overestimate the severity of mitral stenosis. However, when the PCWP was adjusted for the time delay through the pulmonary vasculature, the mean LAP and mean PCWP correlated well. It has been demonstrated that there is a significant positive gradient between the PCWP and the LAP in the initial hour after CPB. Box 9-6 is a summary of conditions that may alter the relationship between the PCWP and the LVEDP.
Adapted from Tuman KJ, Carrol CC, Ivankovich AD: Pitfalls in interpretation of pulmonary artery catheter data. Cardiothorac Vasc Anesth Update 2:1, 1991.
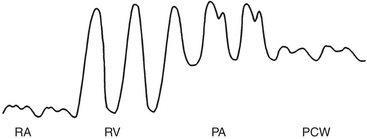
Placement of the Pulmonary Artery Catheter
Passage of the PA catheter from the vessel introducer to the PA can be accomplished by monitoring the pressure waveform from the distal port of the catheter or under fluoroscopic guidance. Waveform monitoring is the more common technique for perioperative right-sided heart catheterization. First, the catheter must be advanced through the vessel introducer (15 to 20 cm) before inflating the balloon. The inflation of the balloon facilitates further advancement of the catheter through the right atrium and right ventricle into the PA. Normal intracardiac pressures are shown in Table 9-1. The pressure waveforms seen during advancement of the PA catheter are illustrated in Figure 9-7. The RA waveform is seen until the catheter tip crosses the tricuspid valve and enters the right ventricle. In the right ventricle, there is a sudden increase in SBP but little change in DBP compared with the RA tracing. Arrhythmias, particularly premature ventricular complexes, usually occur at this point but almost always resolve without treatment once the catheter tip has crossed the pulmonary valve. The catheter is rapidly advanced through the right ventricle toward the PA.
Indications
The indications for PA catheterization are given in Box 9-7. The ability of PA catheters to positively influence patient outcome has never been conclusively proved in large-scale, prospective studies. There remains considerable controversy regarding the risk/benefit ratio of PA catheters. Many studies have reported no change or even worse outcome in patients who were monitored with PA catheters. Randomized trials on patients with myocardial infarction seemed to confirm these data, whereas earlier prospective studies on surgical patients showed improved outcome.9–11
Major problems with PA catheter outcome studies include flaws in study design and insufficient statistical power. The most common design flaws were a lack of therapeutic protocols or treatment algorithms and inadequate randomization, which introduce observer bias.12 Physician knowledge is another confounding variable, as demonstrated in multicenter studies that indicated competency in interpreting PA catheter–derived data was lacking in many individuals and depended on such factors as the level of training and the frequency of use. As many as 47% of physicians could not correctly determine the PCWP to within 5 mm Hg.
The operative procedures and medical conditions that are cited as indications for PA catheterization in the perioperative period remain controversial and vary by institution. In a global sense, the indications for using a PA catheter are assessing volume status, measuring CO, measuring  , and deriving hemodynamic parameters. In 2003, the American Society of Anesthesiologists (ASA) Task Force on Pulmonary Artery Catheterization published updated practice guidelines for PA catheterization (http://www.asahq.org/publicationsAndServices/pulm_artery.pdf).13 These guidelines emphasized that patient, surgery, and practice setting had to be considered. Generally, the routine use of PA catheters is indicated in high-risk patients (e.g., ASA 4 or 5) and high-risk procedures (e.g., where large fluid changes or hemodynamic disturbances are expected). The practice setting is important, because there is evidence that inadequate training or experience may increase the risk for perioperative complications associated with the use of a PA catheter. It is recommended that the routine use of a PA catheter should be confined to centers with adequate training and experience in the perioperative management of patients with the PA catheter (Box 9-8). A summary of procedural indications that is relatively aggressive is shown in Box 9-9.
BOX 9-8 American Society of Anesthesiologists’ Practice Guidelines for Pulmonary Artery Catheter Use
Opinions
Recommendations
Complications
Endobronchial Hemorrhage
Iatrogenic rupture of the PA has become more common since the advent of PA catheter monitoring in the ICU and operating room.14 Several risk factors have emerged: advanced age, female sex, pulmonary hypertension, mitral stenosis, coagulopathy, distal placement of the catheter, and balloon hyperinflation. Balloon inflation in distal pulmonary arteries is probably accountable for most episodes of PA rupture because of the high pressures generated by the balloon. Hypothermic CPB may also increase risk due to distal migration of the catheter tip with movement of the heart and hardening of the PA catheter. It is now common practice to pull the PA catheter back 3 to 5 cm when CPB is instituted.
Pacing Catheters
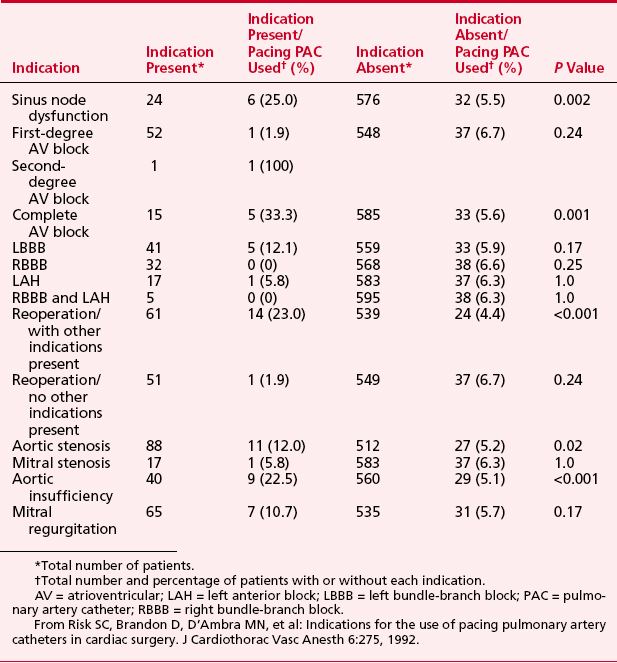
The possible indications for placement of a pacing PA catheter are shown in Box 9-10. The actual use in a group of 600 patients undergoing cardiac surgery is shown in Table 9-3.15
Mixed Venous Oxygen Saturation Catheters
 is a means of providing a global estimation of the adequacy of oxygen delivery relative to the needs of the various tissues. The formula for
  calculation can be derived by modifying the Fick equation and assuming that the effect of dissolved oxygen in the blood is negligible:
 can indicate one of the following situations: decreased CO; increased oxygen consumption; decreased arterial oxygen saturation; or decreased hemoglobin (Hb) concentration. To measure
  , blood is aspirated from the distal port of the PA catheter slowly, so as not to contaminate the sample with oxygenated alveolar blood.
 using reflectance spectrophotometry. The catheter is connected to a device that includes a light-emitting diode and a sensor to detect the light returning from the PA.
  is calculated from the differential absorption of various wavelengths of light by the saturated and desaturated hemoglobin.
If it is assumed that there is constant oxygen consumption and arterial oxygen content, changes in  should reflect changes in CO. Several investigators have come to the conclusion that it provides a valuable measure of CO during surgery. The
  has been shown to correlate with cardiac index during CABG surgery when oxygen consumption is constant, but not with the cardiac index when oxygen consumption is changing, such as during shivering after anesthesia. The usefulness of the catheter may primarily be its ability to continuously monitor the balance between oxygen delivery and consumption,16 and
  may also help predict survival after acute myocardial infarction.
CARDIAC OUTPUT MONITORING
Indicator Dilution

Thermodilution
continuous thermodilution cardiac output
The routine use of continuous CO catheters in cardiac surgery patients has not been shown to improve outcome, and they are more expensive than standard PA catheters. Bolus thermodilution CO still holds its place as the gold standard of CO measurements in the clinical setting.17
arteriac pressure-based cardiac output
Recently, the FloTrac/Vigileo system has been introduced into clinical pratice. It is a unique system that measures CO from the radial artery catheter and does not require calibration. This device has been shown to be accurate in cardiac surgial patients. It measures beat-to-beat stroke volume, and calculate stroke volume variation as a predictor of fluid reconsiveness or dynamic preload. Abnormal arterial pressure waveforms (eg: aortic regurgitation) will lead to incorrect CO measurements with this pulse contour technique.18
ANALYSIS AND INTERPRETATION OF HEMODYNAMIC DATA
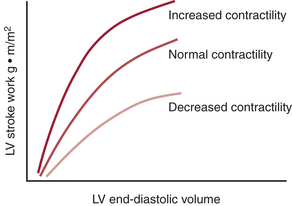
The information provided by hemodynamic monitoring permits the calculation of various derived parameters that assist in evaluating patients clinically. The formulas, normal values, and units for the calculation of various hemodynamic parameters are presented in Table 9-2. These parameters include the SVR, pulmonary vascular resistance (PVR), SV, left ventricular stroke work (LVSW), and right ventricular stroke work (RVSW). As an example of information that may be obtained, graphs of PCWP versus SV can be constructed for individual patients; these “Starling curves” provide insight into the contractile state of the heart. Although these parameters are easily derived using the standard formulas, many modern monitors perform these calculations. To compare data among patients of different body weights and types, the various hemodynamic parameters may be normalized by indexing them to body surface area.
Systemic and Pulmonary Vascular Resistances
Clinically, calculations of SVR are used to assess the response to inotropic, vasodilatory, and vasoconstrictive agents.19 For example, a patient who is hypotensive despite a high normal CO has a low SVR. The SVR is calculated, and then therapy is instituted (e.g., a vasoconstrictor). A repeat calculation of the SVR enables the clinician to titrate the therapy to the appropriate endpoint. Despite this common use in the operating room and ICU setting, there is good evidence that SVR is not an accurate indicator of true afterload. Nevertheless, SVR remains the clinical technique for measuring afterload at the present time.
Frank-Starling Relationships
Myocardial function depends on the contractile state and the preload of the ventricle (sarcomere length at end-diastole). The relationship between the ventricular preload and myocardial work (ventricular stroke work) is the Frank-Starling relationship. The slope of the curve indicates the contractile state of the myocardium (Fig. 9-8). For clinical purposes, it is usually not feasible to measure actual end-diastolic volumes (can be estimated with TEE), and approximations of end-diastolic pressure, such as the PCWP or LAP, are often substituted. This introduces error, because the relationship between end-diastolic pressure and volume is usually nonlinear (as described by the diastolic ventricular compliance curve) and is dynamic. Unfortunately, the Frank-Starling relationship is extremely sensitive to changes in afterload. Patients with LV or RV dysfunction may have severe decrements in SV with increased SVR or PVR, respectively.

 , which explain the severe ischemia seen with overdistention of the left ventricle. Tachycardia is also extremely detrimental because it decreases coronary filling time and increases oxygen demand. Subendocardial ischemia is commonly produced by a combination of tachycardia and elevated LVEDP.
ELECTROCARDIOGRAPHY
The practicing anesthesiologist relies on the ECG to make critical decisions at many phases of the perioperative period in patients undergoing cardiac or noncardiac (particularly vascular) surgery.20
Lead Systems
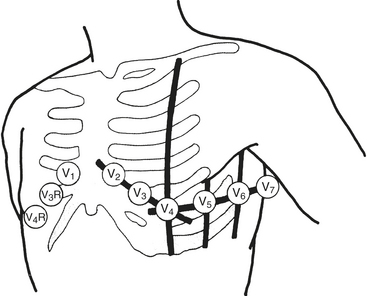
Wilson refined and introduced the unipolar precordial leads into clinical practice. To implement these leads, he postulated a mechanism whereby the absolute level of electrical potential could be measured at the site of the exploring precordial electrode (the positive electrode). A negative pole with zero potential was formed by joining the three limb electrodes in a resistive network in which equally weighted signals cancel each other out. He called this the central terminal. He described three additional limb leads (VL, VR, and VF). These leads measured new vectors of activation, and in this way the hexaxial reference system for determination of electrical axis was established. He subsequently introduced the six unipolar precordial V leads in 1935 (Fig. 9-9).
Detection of Myocardial Ischemia
Pathophysiology of ST-Segment Responses
The ST segment is the most important portion of the QRS complex for evaluating ischemia (Box 9-11). The origin of this segment, at the J point, is easy to locate. Its end, which is generally accepted as the beginning of any change of slope of the T wave, is more difficult to determine. In normal individuals there may be no discernible ST segment as the T wave starts with a steady slope from the J point, especially at rapid heart rates. The TP segment has been used as the isoelectric baseline from which changes in the ST segment are evaluated, but with tachycardia this segment is eliminated, and during exercise testing the PR segment is used. The PR segment is used in all ST-segment analyzers.
Repolarization of the ventricle proceeds from the epicardium to the endocardium, opposite to the vector of depolarization. The ST segment reflects the midportion, or phase 2, of repolarization during which there is little change in electrical potential. It is usually isoelectric. Ischemia causes a loss of intracellular potassium, resulting in a current of injury. The electrophysiologic mechanism accounting for ST-segment shifts (elevation or depression) remains controversial. The two major theories are based on a loss of resting potential as current flows from the uninjured to the injured area (i.e., diastolic current) and on a true change in phase 2 potential as current flows from the injured to the uninjured area (i.e., systolic current). With subendocardial injury, the ST segment is depressed in the surface leads. With epicardial or transmural injury, the ST segment is elevated. 21,22
Electrocardiographic Manifestations of Ischemia
The classic criterion for ischemia is 0.1 mV (1 mm) of ST-segment depression measured 60 to 80 ms after the J point.23–25 The slope of the segment must be horizontal or downsloping. Downsloping depression may be associated with a greater number of diseased vessels and a worse prognosis than horizontal depression. Slowly upsloping depression with a slope of 1 mV/s or less is also used but is considered less sensitive and specific (and difficult to assess clinically). Nonspecific ST-segment depression can be related to drug use, particularly digoxin. Interpretation of ST-segment changes in patients with LV hypertrophy is particularly controversial given the tall R-wave baseline, J-point depression, and steep slope of the ST segment. Although a number of studies have excluded such patients, others (including those using other modalities or epidemiologic studies) observed that LV hypertrophy is a highly significant predictor of adverse cardiac outcome.
Intraoperative Lead Systems
The recommended leads for intraoperative monitoring, based on several clinical studies, do not differ substantially from those used during exercise testing.26 Clinical studies using continuous 12-lead ECG analysis reported that almost 90% of responses involved ST-segment depression alone (75% in V5 and 61% in V4). In approximately 70% of patients, significant changes were observed in multiple leads. The sensitivity of each of the 12 leads is shown in Figure 9-10. When considered in combination (as occurs clinically), the use of leads V4 and V5 increased sensitivity to 90%, whereas sensitivity for the standard clinical combination of leads II and V5 was 80%. Use of leads V2 through V5 and lead II captured all episodes (Table 9-4).
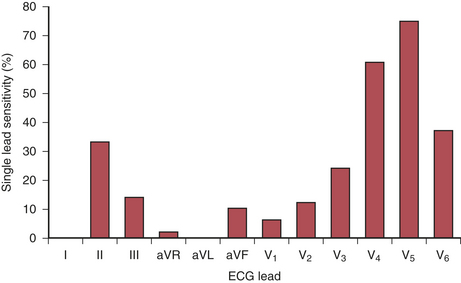
Table 9-4 Sensitivity for Different Electrocardiographic Lead Combinations
| Number of Leads | Combination | Sensitivity (%) |
|---|---|---|
| 1 lead | II | 33 |
| V4 | 61 | |
| V5 | 75 | |
| 2 leads | II/V5 | 80 |
| II/V4 | 82 | |
| V4/V5 | 90 | |
| 3 leads | V3/V4/V5 | 94 |
| II/V4/V5 | 96 | |
| 4 leads | II/V2-V5 | 100 |
Data from London MJ, Hollenberg M, Wong MG, et al: Intraoperative myocardial ischemia: Localization by continuous 12-lead electrocardiography. Anesthesiology 69:232, 1988.
SUMMARY
1. Dorje P., Tremper K. Systolic pressure variation: A dynamic measure of the adequacy of intravascular volume. Semin Anesth Periop Med Pain. 2005;24:147.
2. Barbeau G.R., Arsenault F., Dugas L., et al. Evaluation of the ulnopalmar arterial arches with pulse oximetry and plethysmography: Comparison with the Allen’s test in 1010 patients. Am Heart J. 2004;147:489.
3. Armstrong P.J., Han D.C., Baxter J.A., et al. Complication rates of percutaneous brachial artery access in peripheral vascular angiography. Ann Vasc Surg. 2003;17:107.
4. Hind D., Calvert N., McWilliams R., et al. Ultrasonic locating devices for central venous cannulation: Meta-analysis. BMJ. 2003;327:361.
5. Riopelle J., Ruiz D., Hunt J., et al. Circumferential adjustment of ultrasound probe position to determine the optimal approach to the internal jugular vein: A noninvasive geometric study in adults. Anesth Analg. 2005;100:512.
6. Troianos C.A., Kuwik R., Pasqual J., et al. Internal jugular vein and carotid artery anatomic relation as determined by ultrasonography. Anesthesiology. 1996;85:43.
7. Parry G. Trendelenburg position, head elevation and a midline position optimize right internal jugular vein diameter. Can J Anaesth. 2004;51:379.
8. Pawar M., Mehta Y., Kapoor P., et al. Central venous catheter-related bloodstream infections: Incidence, risk factors, outcome, and associated pathogens. J Cardiothorac Vasc Anesth. 2004;18:304.
9. Sandham J.D. Pulmonary artery catheter use—refining the question. Crit Care Med. 2004;32:1070.
10. Chittock D.R., Dhingra V.K., Ronco J.J., et al. Severity of illness and risk of death associated with pulmonary artery catheter use. Crit Care Med. 2004;32:911.
11. Sandham J.D., Hull R.D., Brant R.F., et al. A randomized, controlled trial of the use of pulmonary artery catheters in high-risk surgical patients. N Engl J Med. 2003;348:5.
12. Vender J. Pulmonary artery catheter utilization: The use, misuse, or abuse. J Cardiothorac Vasc Anesth. 2006;20:295-299.
13. American Society of Anesthesiologists Task Force on Pulmonary Artery Catheterization: Practice guidelines for pulmonary artery catheterization: An updated report by the American Society of Anesthesiologists Task Force on Pulmonary Artery Catheterization. Anesthesiology. 2003;99:988.
14. Abreu A.R., Campos M.A., Krieger B.P. Pulmonary artery rupture induced by a pulmonary artery catheter: A case report and review of the literature. J Intensive Care Med. 2004;19:291.
15. Risk S.C., Brandon D., D’Ambra M.N., et al. Indications for the use of pacing pulmonary artery catheters in cardiac surgery. J Cardiothorac Vasc Anesth. 1992;6:275.
16. Reinhart K., Kuhn H.J., Hartog C., Bredle D.L. Continuous central venous and pulmonary artery oxygen saturation monitoring in the critically ill. Intensive Care Med. 2004;30:1572.
17. Zollner C., Goetz A.E., Weis M., et al. Continuous cardiac output measurements do not agree with conventional bolus thermodilution cardiac output determination. Can J Anaesth. 2001;48:1143.
18. Manecke G.R., et al. Cardiac output from the arterial catheter: Deceptively simple. J Cardiothorac Vasc Anesth. 2007;21:629.
19. Bashore T. Afterload reduction in chronic aortic regurgitation: It sure seems like a good idea. J Am Coll Cardiol. 2005;45:1031.
20. Weinfurt P.T. Electrocardiographic monitoring: An overview. J Clin Monit. 1990;6:132.
21. Tsuda H., Tobata H., Watanabe S., et al. QRS complex changes in the V5 ECG lead during cardiac surgery. J Cardiothorac Vasc Anesth. 1992;6:658.
22. Crescenzi G., Scandroglio A.M., Pappalardo F., et al. ECG changes after CABG: The role of the surgical technique. J Cardiothorac Vasc Anesth. 2004;18:38.
23. Horacek B.M., Wagner G.S. Electrocardiographic ST-segment changes during acute myocardial ischemia. Card Electrophysiol Rev. 2002;6:196.
24. Carley S.D. Beyond the 12 lead: Review of the use of additional leads for the early electrocardiographic diagnosis of acute myocardial infarction. Emerg Med (Fremantle). 2003;15:143.
25. Zimetbaum P.J., Josephson M.E. Use of the electrocardiogram in acute myocardial infarction. N Engl J Med. 2003;348:933.
26. London M.J. Multilead precordial ST-segment monitoring: “The next generation?”. Anesthesiology. 2002;96:259.