CHAPTER 20 Molecular Imaging of the Brain with Positron Emission Tomography
Advances in our understanding of the molecular mechanisms of diseases are providing the clinician with new targets for therapeutic intervention. Long-term evaluation of these therapies will be necessary to provide critical information about efficacy, and an essential assessment modality will be the noninvasive molecular imaging technology of positron emission tomography (PET). PET is used to assess rates of biologic processes in vivo throughout the brain and body by using subnanomolar concentrations of radioactively labeled biologic probes. As such, PET provides quantitative radioassays of biochemical activity without producing significant disturbances in the biologic system being assessed. The types of data obtained with PET extend across different levels of biologic function. For example, PET can be used to assess glucose metabolic rates, blood flow, blood-brain barrier permeability, enzyme activity, synthesis and release of neurotransmitters, neuroreceptor densities, mood states, substance abuse, and most recently, gene expression.1,2 In the brain, PET has been used to image alterations in neurochemical activities related to normal development, aging, and disease states. For both the basic researcher and clinician, assessment of central nervous system function with PET has been extended to studies of quantitative features of motor, visual, somatosensory, behavioral, and cognitive function. In pharmacology studies, novel approaches have been developed to measure the in vivo pharmacokinetic and pharmacodynamic actions of therapeutic drugs in human subjects with tracer doses.3 For clinical applications, PET is used for the detection of tumor and planning of surgical procedures. Multiple PET studies over time can also be used to provide a chronologic record of the subject’s disease status and treatment efficacy.
Basic Principles of Positron Emission Tomography
The essential components of PET are as follows:
Each of these topics is described here in sufficient detail to enable the reader to interpret PET data from human studies. References to comprehensive reviews on each topic are included for further study.4,5
The Cyclotron and Radiochemical Procedures
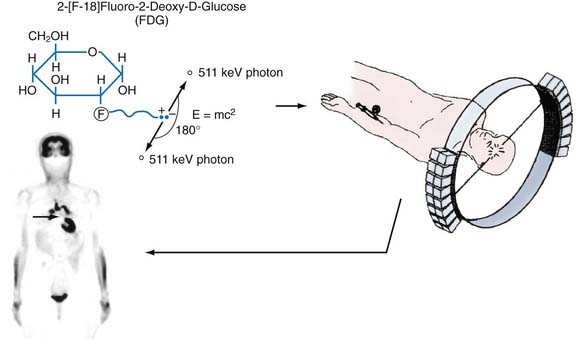
Positron-emitting radionuclides are generated in a cyclotron. In this machine, charged particles (protons, deuterons, or negative hydrogen ions) are accelerated in a circular path to achieve sufficient kinetic energy. The particles are then directed to bombard a stable isotope and the resultant interaction creates a new, unstable, proton-rich isotope. This isotope becomes a more stable atom by a nuclear process in which a proton is converted to a neutron, a positron (the antiparticle of the electron with the same mass but positively charged), and a neutrino. The positron and neutrino are emitted from the nucleus of the radioactive species at a characteristic decay rate, depending on the particular isotope. The positron-emitting isotopes most often produced for PET studies are radioactive forms of oxygen (15O), nitrogen (13N), carbon (11C), and fluorine (18F). These isotopes have decay rates in the range of minutes to hours (e.g., half-lives of 2 minutes for 15O and 109 minutes for 18F) and are ideally suited for biologic imaging because there is sufficient time to image their presence in the body without producing long-term radiation exposure (see Table 20-1 for the physical characteristics of radioisotopes). These radioisotopes can be readily incorporated into a wide variety of molecules, including the labeling of physiologic substrates (e.g., glucose, amino acids), neuroreceptor ligands, and substrates and inhibitors of enzymes. The injectable end product is then introduced into the body, usually by intravenous injection. Because these compounds are injected in minute quantities (subnanomolar concentrations) and do not produce pharmacologic effects, they are referred to as biologic tracers or probes. The tracer is then distributed throughout the body in accordance with its delivery, uptake, and metabolism characteristics. Throughout this time, the tracer continues to decay and emit positrons and neutrinos. The neutrinos pass through the body and are not detected. Wherever the tracer is trapped in tissues, the positrons travel only a short distance (≈1 mm) and lose energy in collisions with electrons in the tissue, until they collide with nearby electrons, which results in annihilation of the two particles and conversion of their masses into two gamma-ray photons, referred to as annihilation photons. These photons each have an energy of 511 keV and are projected linearly at approximately 180 degrees to each other. They have a high probability of escaping the body without attenuation, which allows their detection. A pair of detectors set at 180 degrees to each other can register the arrival of these photons and localize the positron emitter along that line of travel, referred to as a coincidence line, or line of response. For a given localized concentration of positron emitters, the resultant photon pairs are emitted in all directions and can be detected by a circumferential ring of scintillation detectors (Fig. 20-1). On combining the lines of response from many different angles, the data are reconstructed with a mathematical algorithm (special coincidence technique called a reconstruction algorithm) to establish their distribution pattern, a pattern that corresponds to regional concentrations of the radionuclide. These profiles are then used to produce tomographic brain images, which can then be coregistered with computed tomography (CT) or magnetic resonance imaging (MRI) to obtain precise anatomic localization.6
TABLE 20-1 Physical Properties of Selected Positron-Emitting Radionuclides
| RADIONUCLIDE | HALF-LIFE | MAXIMAL POSITRON ENERGY (MeV) |
|---|---|---|
| 18F | 109.7 min | 0.64 |
| 11C | 20.4 min | 0.96 |
| 13N | 9.96 min | 1.19 |
| 15O | 2.07 min | 1.72 |
| 22Na | 2.6 yr | 0.55 |
| 64Cu | 9.7 min | 0.65 |
| 68Ga | 67.6 min | 1.89 |
Camera and Brain Imaging
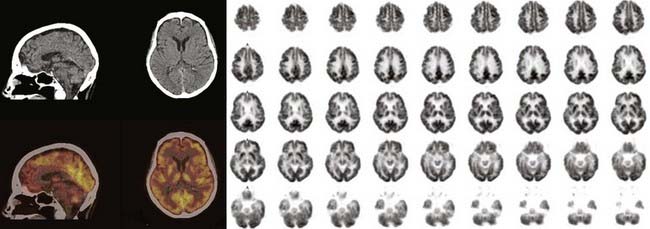
Spatial resolution, or the ability to accurately locate events, refers to the smallest distance between two points that can be distinguished by the PET scanner. This parameter defines the ability of the camera to differentiate spatial activity and is based primarily on the camera detector elements, with smaller elements providing better detail. A typical clinical PET camera has a spatial resolution of 5 to 8 mm; small animal scanners have a resolution as low as 2 mm.7 With recent advances in detector and scanner design technology, the sensitivity and spatial resolution of PET have dramatically improved, especially as data collection has evolved from a two- to a three-dimensional mode of acquisition (which increases the number of gamma rays being collected). State-of-the-art PET cameras can now image subregional cortical and subcortical structures throughout the brain (Fig. 20-2).
Partial volume correction describes methods for removing errors in the regional quantification of activity caused by analysis of regions that are smaller in width than twice the spatial resolution of the camera (i.e., regions with a diameter less than two times the FWHM). For example, if the FWHM is expressed as 4 to 5 mm, any structure less than 10 mm will be affected by concentrations of radioactivity in the surrounding areas. If the structure of interest has a higher concentration than adjacent structures, its concentration of radioactivity will be underestimated. In contrast, if the structure of interest has a lower concentration than adjacent structures, its radioactivity will be overestimated. In general, a region of interest should be quantified only when its size is twice that of the FWHM. Therefore, whenever a small region of interest is quantified, its dimensions should be stated relative to the spatial resolution of the camera. However, further processing of the data can correct for this partial volume effect, provided that the spatial resolution of the PET camera, the exact size and shape of the region, and the relative concentrations of radioactivity are all known. The methods of partial volume correction that have been developed require an MRI scan or other anatomic brain image of the individual.8
Image reconstruction refers to the mathematical process of creating an image from a series of detection events obtained from the PET camera. Radioactive decay events are detected as lines of response, and a reconstruction algorithm is used to determine the distribution of radioactivity from the summation of all observed lines of response. The most commonly used reconstruction algorithm initially was called filtered backprojection (FBP). With FBP, the counts from all detector pairs are projected back along the lines of response where they originated, which results in overlapping of backprojections and a corresponding two-dimensional distribution of emission origins. Before projection, these data are processed with a mathematical filter algorithm, relatively graded from sharp to smooth, to improve the signal characteristics. Sharp filters result in better spatial resolution and more statistical noise, whereas smooth filters result in less resolution and a reduction in statistical noise.9 The FBP method is increasingly being replaced by iterative reconstruction methods (e.g., maximal likelihood estimation) that essentially begin with an estimated image based on the intersection of lines of response followed by comparison of its calculated projection data with the actual projection data. With subsequent iterations, the image is revised until convergence is achieved, with limiting factors being the technical features of the detector system.
Tracer Kinetic Models
Hundreds of PET tracers have been synthesized for research in animal and human imaging studies. A representative list of positron-labeled compounds is presented in Table 20-2 to illustrate the wide range of imaging applications. It should be emphasized that the initial PET data acquisition reflects the total radioactivity in a region over the time that the data were acquired. Because only radioactivity is measured in the brain and not the relative concentrations of the tracer and its metabolites, optimal use of a particular PET tracer requires an appropriate tracer kinetic model to interpret the observed changes in radioactivity levels. Tracer kinetic models provide a mathematical framework by which the time course of tracer distribution and changes in regional concentrations of accumulated radioactivity are used to derive rates of biologic processes.
TABLE 20-2 Examples of Radiolabeled Compounds Used for Positron Emission Tomography
| LABELED COMPOUNDS | PRIMARY APPLICATION |
|---|---|
| Physiology | |
| H215O, C15O2 | Blood flow |
| 11CO, C15O, 68Ga-EDTA | Blood volume |
| 3-(O-[11C]methyl)-D-glucose | Glucose transport |
| Metabolism, Biosynthesis, Transport | |
| 2-[18F]Fluoro-2-deoxy-D-glucose | Glucose metabolic rates |
| [11C]Palmitic acid | Free fatty acid metabolism |
| [13N]Glutamate, [13N]alanine | Transaminase activity |
| [11C]Acetate | Krebs cycle function |
| 15O2 | Oxygen utilization |
| L-1-[11C]Leucine, L-1-[11C]valine | Protein synthesis |
| L-1-[11C]Tyrosine, L-1-[11C]phenylalanine, 6-[18F]fluoro-L-dopa, 2-[18F]fluorotyrosine, [11C]methyl-L-methionine | Brain tumors |
| [11C]Thymidine | DNA replication (cell growth) |
| [18F]Fluoride | Bone cell growth |
| [11C]Verapamil | P-glycoprotein |
| NEURORECEPTORS | RECEPTOR TYPE |
|---|---|
| [18F]SCH 23390, [11C]SCH 23390, [11C]NNC 112 | D1 |
| [11C]Raclopride, [18F]fluoroethylspiperone, [18F]fallypride | D2 |
| [18F]MPPF | 5-HT1A |
| [18F]Altanserin | 5-HT2A |
| 6-[18F]Fluoro-A-85380 | Nicotinic |
| [11C]Carfentanil, [11C]diprenorphine | Opioid |
| [11C]Flunitrazepam | Benzodiazepine |
| [11C]Flumazenil | Benzodiazepine/epilepsy |
| N-Methyl-[11C]PK 11195 | Benzodiazepine/glia |
| [11C]Scopolamine | Muscarinic |
| Neurotransmitter Biochemistry | |
| 6-[18F]Fluoro-L-dopa, 4-[18F]fluoro-m-tyrosine | Dopamine synthesis |
| [11C]WIN 35,428, [18F]FPCIT | Dopamine transporter |
| [11C] McN5652, [11C]DASB | Serotonin transporter |
| [11C]Dihydrotetrabenazine | Vesicular monoamine transporter |
| [11C]Ephedrine, [18F]fluorometaraminol, 6-[18F]fluorodopamine | Adrenergic terminals |
| Enzyme Probes | |
| 5-[18F]Fluoro-2′-deoxyuracil | Thymidylate synthetase |
| [11C]Deprenyl | Monoamine oxidase |
EDTA, ethylenediaminetetraacetic acid.
To construct kinetic models, the biologic process is categorized into compartments (e.g., plasma and a tissue region would represent a two-compartment model) and then formulated by differential equations that describe exchange of the isotope between compartments.10 In general, models contain parameters that are used to determine transport rates of the tracer into and out of the region of interest, the extent of tracer-receptor binding, and enzymatic activities. The images that are constructed from these parameters and subsequent model fitting are referred to as parametric images.
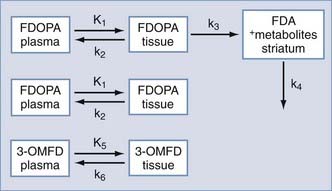
A typical three-compartment tracer kinetic model is presented in Figure 20-3. After intravenous injection of the tracer, the time course of the tracer concentration in plasma (obtained from arterial blood samples) is determined. This plasma-time activity curve is referred to as the input function and is used to provide a quantitative parameter on tracer availability to the brain as a function of time.
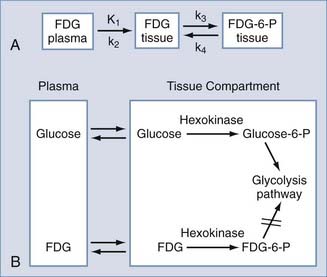
2-[18F]Fluoro-2-deoxy-D-glucose (FDG) is the most widely used tracer in PET studies. It was adapted from the 2-deoxyglucose (2-DG) method for imaging glycolysis by autoradiography as developed by Sokoloff.11,12 The 2-DG method established that measurement of 2-DG accumulation could be used to quantify metabolic rates of glucose, which are closely coupled to functional activity of the brain (e.g., increased glucose consumption with focal seizures, decreased glucose consumption with anesthesia or blockade of visual input).
FDG is a fluorinated analogue of 2-DG, and its use in PET is a direct extension of Sokoloff’s model. In the brain, FDG is used to measure the cerebral metabolic rate of glucose (CMRGlu) in selected regions. FDG and glucose are transported by the same carrier across the blood-brain barrier into tissues (see Fig. 20-3). Both compounds then enter the glycolysis cycle and are phosphorylated by the enzyme hexokinase. However, after this step, FDG-6-phosphate, unlike glucose-6-phosphate, is not a substrate for further metabolism, and it remains trapped in the tissue for at least 1 hour before slowly leaving the tissue. Accordingly, FDG-6-phosphate accumulates in the tissue proportional to that tissue’s metabolic rate of glucose. To correct for small relative differences between FDG and glucose as substrates for hexokinase activity, an additional factor—the “lumped” constant—is used in calculating the metabolic rate of glucose.

where Cp is the plasma glucose concentration and LC is the lumped constant. The parameter K1 is a rate coefficient (mL/min/g) that represents the transport of FDG from plasma to tissue and accounts for blood flow and extraction of tracer. First-order rate constants (min−1) represent the transport of FDG from tissue to plasma (k2) and phosphorylation of FDG to FDG-6-phosphate by hexokinase (k3); a correction factor (k4) can be added to account for the small amount of dephosphorylation of FDG-6-phosphate that can occur at later times (60 to 90 minutes after injection).
Detection and Diagnosis of Neurological Dysfunction
Movement Disorders
A wide range of movement disorders associated with basal ganglia dysfunction have been imaged with PET. Neurochemical deficits have been identified that uniquely characterize Parkinson’s disease, Huntington’s disease, progressive supranuclear palsy, multiple system atrophy, essential tremor, and dystonia. In particular, striatal dopamine system abnormalities have been studied with tracers specifically designed to assess different components of presynaptic and postsynaptic function.13 For example, dopamine synthesis capacity is used as an index of presynaptic terminal functional integrity, whereas binding of tracer to the dopamine transporter (DAT) is used to estimate nerve terminal density. For the postsynaptic system, ligands that bind to dopamine receptors have provided measures of receptor number (Bmax) and receptor affinity (Kd).14,15 The opportunity to conduct longitudinal studies with these tracers provides a unique noninvasive methodology for monitoring the temporal progression of many disease processes.16 The use of PET to assess nigrostriatal deficits in Parkinson’s disease and the striatal degeneration associated with Huntington’s disease is discussed next.
Parkinson’s Disease
The progressive loss of nigrostriatal neurons eventually exceeds a nonsymptomatic threshold, at which point motor and cognitive symptoms appear.17,18 However, even before symptoms begin, underlying deficits in the dopamine system can be detected with PET. The capability of detecting these biochemical deficits in the striatal dopamine system can provide insight into the differential diagnosis and therapeutic options.
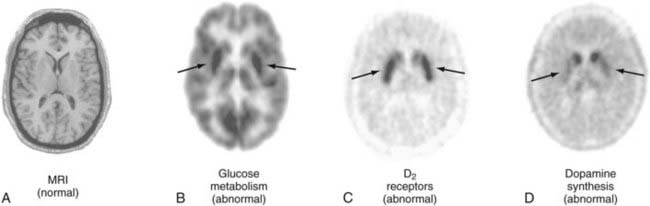
The first approach to imaging presynaptic integrity of the dopamine system in patients with Parkinson’s disease was based on the assessment of striatal dopamine synthesis capacity.19 The clinical application of exogenous L-dopa as a substrate for brain dopamine synthesis provided the rationale to synthesize a fluorinated analogue of L-DOPA, [18F]6-fluoro-L-dopa (FDOPA), as a PET tracer. FDOPA is transported across the blood-brain barrier into the brain by the large neutral amino acid transporter, as is L-DOPA and other large neutral amino acids.20 In dopaminergic presynaptic terminals, FDOPA is a substrate for aromatic amino acid decarboxylase and is converted to [18F]fluorodopamine (FDA), which is subsequently stored in vesicles. The extent of FDA accumulation in striatum during the imaging period is used to estimate dopamine synthesis rates.21 Thus, reductions in FDA accumulation in patients with Parkinson’s disease have been associated with decreases in dopaminergic terminal activity. Moreover, relative decreases in accumulation of FDA between the caudate and putamen, as well as between putaminal subregions, have been used to stage progression of Parkinson’s disease (Fig. 20-4).
Additionally, FDG has been used in conjunction with FDOPA to provide a complementary assessment of compensatory regional alterations in glucose metabolism.22 These PET assessments have been used to differentiate idiopathic Parkinson’s disease from related movement disorders.
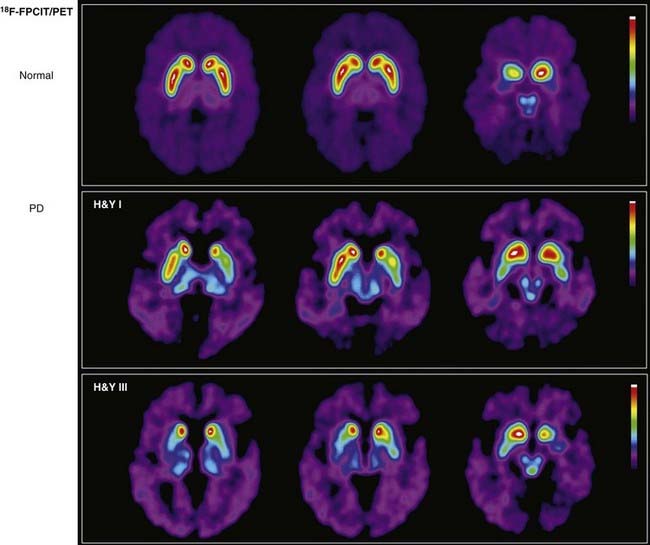
An alternative to FDOPA assessment of striatal dopamine system integrity is obtained with PET tracers that bind selectively to the presynaptic DAT and thereby may provide an index of its terminal density.23 For example, the cocaine congener N-(3-18F-fluoropropyl)-2β-carbomethoxy-3β-(4-iodophenyl)nortropane ([18F]FPCIT), which has high binding affinity for the DAT (Fig. 20-5), has been used to show how the pathology in Parkinson’s disease progresses from unilateral to bilateral striatal dopamine deficits and that their magnitude correlates with the severity of behavioral symptoms.24 Other [18F]FPCIT-PET studies have revealed 50% decreases in mean striatal DAT binding in patients with early-stage Parkinson’s disease who were imaged within 2 years of diagnosis, thus suggesting that significant nigrostriatal degeneration had occurred by the time that the first symptom appeared.25
For the postsynaptic striatal dopamine system, PET tracers have been synthesized for the dopamine D1 and D2 receptors.26 These receptors subserve different functions based on their signal transduction mechanisms of stimulation and inhibition of adenylyl cyclase, respectively.27 At present, PET studies of dopamine receptors have been limited to the assessment of receptor density and, in some instances, receptor affinity.
Nonetheless, changes in apparent ligand-receptor binding are indicative of dysfunctional neurotransmission at the synapse. For example, changes in D2 receptor density in patients with Parkinson’s disease as a result of compensatory reactions to the ongoing disease process have been measured with PET.28 Subregional striatal alterations that show larger increases in D2 receptor binding in the putamen than in the caudate have also been detected (see Fig. 20-4). These relative differences in receptor density are paralleled by a similar pattern of increases in FDG metabolism; that is, metabolic rates in the putamen are greater than those in the caudate.
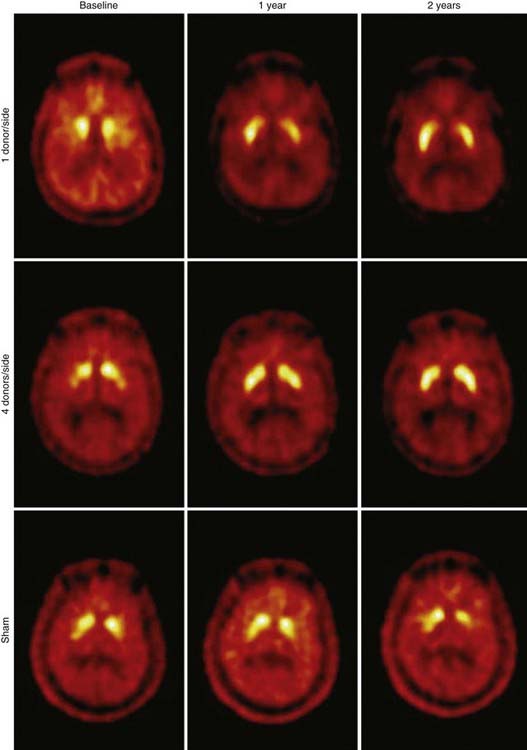
PET can also provide in vivo assessments of the efficacy of neurosurgical interventions. In the United States, two National Institutes of Health–sponsored double-blind trials were conducted in which fetal mesencephalon cells were transplanted into the striatum of patients with Parkinson’s disease.29,30 Although clinical improvements appeared only marginal and the primary end points were not met, the integrity of the grafts to survive in the host striatum was unequivocally demonstrated with FDOPA–PET studies (Fig. 20-6). At present, novel neurorepair and neurorestoration strategies are being developed that include stereotactic delivery into the brain of neuronal growth factors (e.g., glial cell line–derived neurotrophic factor, genetically engineered viral vectors that deliver genes of interest, and stem cells). The long-term efficacy of these interventions will be assessed by PET.
Huntington’s Disease
The neurodegeneration associated with this autosomal dominantly inherited disease results in a significant loss of the medium spiny GABAergic (secreting γ-aminobutyric acid [GABA]) neurons of the striatum. Because these cells contain the majority of dopamine receptors in the striatum, a decrease in dopamine receptor binding accompanies their loss.31 Accordingly, changes in dopamine receptor binding were targeted for assessment with PET. Because striatal GABAergic neurons express D1 and D2 receptors, PET studies initially focused on alterations in these receptor densities by using the D1 receptor ligand [11C]SCH 23390 and the D2 receptor ligand [11C]raclopride. PET studies have shown that progression of Huntington’s disease is accompanied by significant reductions in both striatal D1 and D2 receptor binding.31
Dementias and Mental Illness
At present, FDG-PET can diagnose Alzheimer’s disease and distinguish it from patterns of normal aging.16 Specifically, hypometabolism can be detected in cortical neuronal pathways, which represents the summative effect of decreases in regional synaptic activity. These deficits are most prominent in the parietal and temporal lobes rather than the motor and visual cortex and become more marked and widespread with increasing disease severity.32,33 Additionally, the hypometabolism is not generalized to subcortical structures such as the basal ganglia and thalamus.
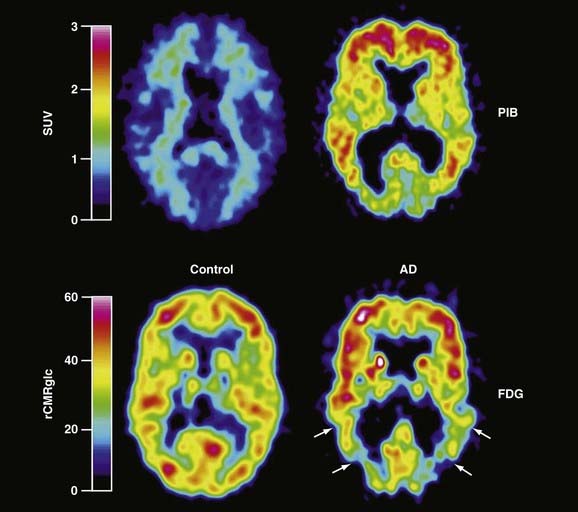
It is now apparent that the major histopathologic aspects of Alzheimer’s disease, namely, amyloid plaques and neurofibrillary tangles, are present in brain before the onset of cognitive decline.34–36 The predominant role hypothesized for β-amyloid in producing neuronal dysfunction has made it an attractive target for in vivo PET imaging, whereby disease progression and the efficacy of interventions designed to reduce the amyloid burden could be assessed. Recent advances in imaging amyloid in the brain have been achieved by using novel PET ligands that are modifications of histologic dyes with high binding affinity for amyloid. The most promising compound currently used for imaging amyloid is N-methyl-[11C]2-(4′-methylaminophenyl)-6-hydroxybenzothiazole, also referred to as the Pittsburg-B Compound ([11C]-PIB).37 Patients with Alzheimer’s disease imaged with [11C]-PIB show greater retention of [11C]-PIB in cortical regions associated with accumulation of amyloid than in the pons or cerebellum, where there is little or no amyloid (Fig. 20-7). Multiple studies of Alzheimer’s disease patients with [11C]-PIB and FDG imaging have now shown that the apparent amyloid burden remains relatively high and stable over a 2-year period while cerebral glucose metabolism continues to decline, thus suggesting that amyloid accumulation precedes the associated loss of cognitive function.38
PET has also contributed to refinement of the diagnosis and surgical treatment of mental illnesses such as severe major depression39 and obsessive-compulsive disorders.40 A clinical response to antidepressants is associated with decreases in rates of glucose metabolism in the limbic (subgenual cingulate cortex, hippocampus, insula, and pallidum) and striatal regions, with increases in the dorsal cortical (prefrontal, parietal, anterior, and posterior cingulate) regions.41 Mayberg and colleagues used the findings of increased blood flow in the subgenual cingulate cortex to identify a target for deep brain stimulation to abate the symptoms of medically refractory major depression. Their early work demonstrated the integral role played by the subgenual cingulate cortex in both normal and pathologic shifts in mood.42 Increases in limbic and paralimbic blood flow, as measured with PET, occur in the subgenual cingulate cortex and anterior insula during sadness. Furthermore, there is a significant inverse correlation between blood flow in the subgenual cingulate cortex and the right dorsolateral prefrontal cortex.43 In 2005, Mayberg and associates implanted deep brain stimulation electrodes into the bilateral subgenual cingulate cortex in six patients with medically refractory major depression. With stimulation, patients reported positive emotional phenomena.44 In the acute postoperative period, the patients experienced reproducible increases in activity and mood scores that were not seen during sham stimulation. Chronic stimulation at high frequency probably resulted in reduced functional stimulation in the site. Subsequently, significant improvement in behavioral responses and remission of depression were observed in four of the six patients at 6 months. These well-conducted studies showed the effectiveness of PET in enhancing our knowledge of brain function and leading to effective diagnosis and therapeutic interventions.
Changes in FDG-PET patterns of cortical uptake in the frontal areas have also been demonstrated in patients with internal capsule lesions,45 as well as with deep brain stimulation for the management of obsessive-compulsive disorder.46 Thus, evidence is accumulating to support the use of PET for determination of targets and follow-up of patients undergoing neurosurgical interventions for mental illness.
Clinical Applications
Epilepsy
The outcome of epilepsy surgery is directly linked to accurate localization of the focus of the seizures. Improvements in techniques for localization of the seizure focus have resulted from advances in brain imaging. Currently, electroencephalography (EEG) is used to localize the focus, and imaging studies are used to corroborate the EEG findings. In the future, imaging studies will be incorporated into standard protocols for localization because of the high degree of accuracy of PET and volumetric MRI studies. This trend evolved from earlier findings with pneumoencephalography that demonstrated hippocampal atrophy, but modern imaging techniques can decrease the use of invasive EEG methods such as implantation of grids and depth electrodes.47
FDG-PET scanning first demonstrated focal seizure abnormalities in the absence of structural changes.48 Currently, single-photon emission computed tomography (SPECT), magnetoencephalography (MEG), and magnetic resonance spectroscopy (MRS) are also capable of showing abnormalities consistent with seizure foci in the absence of structural changes.49 It is likely that these imaging modalities will provide complementary data for specific clinical situations. PET imaging with [11C]flumazenil is also used to detect focal abnormalities. [11C]Flumazenil is an antagonist with high binding affinity for the benzodiazepine site on GABAA postsynaptic receptors. The region of the epileptogenic focus is localized by detecting a reduced area of [11C]flumazenil binding, which can be overestimated as a larger area of hypometabolism when imaged with interictal FDG-PET.50 The merits of PET are discussed in this section; other modalities are evaluated elsewhere in this volume.
Temporal Lobe Epilepsy
Temporal lobe epilepsy has been extensively studied with PET because of the prevalence of its surgical treatment.51,52 At present, the process of resecting the seizure focus is divided into three phases. Phase I consists of noninvasive studies for localization of the seizure focus as defined by the semiology of the seizure, by scalp EEG findings, including needle electrodes (e.g., sphenoidal electrodes), and by imaging studies. Phase II is undertaken only if the phase I studies fail to localize the seizure focus. Phase II consists of invasive EEG studies, including electrocorticography with strips, grids, and depth electrodes implanted stereotactically. Because phase II studies substantially increase the morbidity of the surgical process, it is desirable to minimize their use.53 Phase III is resection of the seizure focus.54 Ideally, all the information necessary for characterization of the resection is obtained before the surgical procedure.
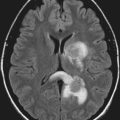
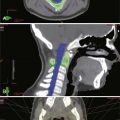
The need for accurate noninvasive localization becomes even more pressing for minimally invasive neurosurgery such as radiosurgery, which is now available for the treatment of focal epilepsy.55 FDG-PET has been the most reliable imaging technique for lateralization of the seizure focus in temporal lobe epilepsy and for identification of cortical dysplasias, even when findings on MRI are unremarkable.56,57 FDG-PET has provided detailed information on cell firing in minute foci, such as the origin of electrical discharges resulting in gelastic seizures in patients with hypothalamic hamartoma.58 Radiosurgery directed to such hypermetabolic foci can lead to significant decreases in and even complete resolution of seizures.59
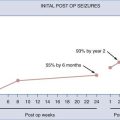
The University of California, Los Angeles, group showed in a retrospective study of patients undergoing temporal lobe resection that the use of FDG-PET resulted in 86% sensitivity and 100% specificity for lateralization of the seizure focus.53 This study demonstrated that localization was correct in all patients with glucose hypometabolism. Of the patients studied, only 14% of those undergoing resection did not have glucose hypometabolism in the resected lobe.51,52 These results were reproduced in a study in which all patients with unilateral temporal lobe hypometabolism as assessed by FDG-PET had congruent results with invasive EEG studies.57 Additionally, FDG-PET correlated with the semiology of the seizure. Patients with only aura and staring spells showed regional hypometabolism that was confined to the mesial temporal lobe structures, whereas patients with posturing as a component of their complex partial seizures had hypometabolism extending to the frontolateral cortex and motor cortex regions. Patients with complex automatism had hypometabolism in widespread areas, including the ipsilateral and contralateral limbic structures.47 At present, neuronal loss in the seizure focus is the most plausible hypothesis for the interictal hypometabolism detected by FDG-PET. Although hypometabolic regions distant from the focus are also observed, these decreases may arise secondarily from diaschisis (see Fig. 20-10) as a result of primary loss of neurons in the region of the seizure focus.60
MRI volumetric measurements of the hippocampus and amygdala also have high sensitivity and specificity in determining the seizure focus.61 T2 relaxometry denoting gliosis in the hippocampus offers additional information when MRI is used.62 When hippocampal atrophy is present, neuronal loss is highly predictable, especially in the CA1 subfield. Such characterization corresponds to FDG-PET–defined hypometabolism, and the PET results are more reliable than those obtained with T2 relaxometry.63 The results of visual inspection, including volume and T2 relaxometry, reached a concordance of 90% with EEG lateralization; the addition of volumetric calculations generated with computer workstations brought this concordance to 97%. The congruency of EEG, MRI volumetric, and T2 relaxometric findings with FDG-PET hypometabolism is now considered sufficient for lateralization of the focus.
Further information on lateralization can be obtained with MRS.64 MRS offers quantitative tissue spectra of N-acetylaspartate (NAA), choline, creatine, phosphocreatine, and lactate in the epileptic zone. NAA is found in neurons, whereas choline and creatine are found predominantly in glia. Therefore, relative decreases in NAA may represent neuronal loss, and increases in choline and creatine may denote gliosis.
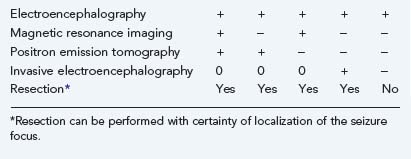
In one study of 16 patients with unilateral temporal lobe epilepsy as determined by EEG, concordance of these results with the NAA/choline + creatine ratio was observed for all subjects.65 Similar studies reported by others show that determination of the seizure focus based on MRI, MRS, and FDG-PET may be sufficient for surgical resection without invasive recordings.66,67 Algorithms based on imaging and recording studies can be used for decisions on resection (Table 20-3). It remains to be demonstrated whether only one of these techniques can provide sufficient accuracy for such determination.
Additional information can be obtained with SPECT. Although interictal SPECT offers inferior imaging results relative to FDG-PET, SPECT may be adequate for ictal studies because of its availability and the longer half-life of the imaging agents (6 hours) compared with FDG (110 minutes).49 Immediate postictal injection of technetium 99m hexamethyl-propyleneamine oxine followed by scanning can show cerebral hyperperfusion in the focus and surrounding areas of the epileptogenic zone.
Extratemporal Lobe Epilepsy
Similar to localization of temporal lobe epilepsy foci, extratemporal foci are also identified on FDG-PET in interictal studies as areas of glucose hypometabolism. EEG recordings and MRI detection of abnormalities on T1-weighted images or T2 relaxometry also provide localization, but volumetric studies do not reveal extratemporal seizure areas. For example, in patients with infantile spasms and normal findings on MRI, cortical dysplastic areas are identified by hypometabolic changes seen on FDG-PET. Based on such PET characterization, successful surgical results were achieved in the early 1990s.48,56 Advanced MRI techniques can now detect abnormalities in a substantial number of patients with normal conventional MRI findings.68 Additionally, the improved resolution of MRS in combination with FDG-PET can be used in the surgical treatment of extratemporal lobe epilepsy. The use of PET fusion techniques and functional MRI data will assist in localization of the focus and facilitate the stereotactic surgical approach by providing functional mapping of the surrounding brain regions.69–73
Brain Tumors
Tumor Metabolism
Regional cerebral blood flow (CBF), cerebral blood volume (CBV), oxygen extraction fraction (OEF), and cerebral oxygen utilization (CMRO2) have been evaluated by [15O]CO2, [11C]CO, and [15O]CO as tracers and constant infusion of [15O]H2O.74 Surprisingly, it has been shown that oxygen extraction and utilization are decreased in primary brain tumors in comparison to normal brain tissue.75 Moreover, there appears to be an uncoupling of regional CBF and regional CBV. CBF in gliomas is rather variable, particularly in high-grade gliomas. For example, edematous areas surrounding the tumor have decreased blood flow and oxygen utilization but normal oxygen extraction and are therefore not considered ischemic. These metabolic characteristics are altered by dexamethasone administration or radiotherapy.76 Dexamethasone causes a decrease in CBF and CBV in both hemispheres of patients with brain tumors, and radiotherapy effects a decrease in CMRO2 and CBF in the tumor, with an increase in these parameters in the opposite hemisphere.68 These findings are in accord with the rapid clinical improvement of patients with brain tumors undergoing steroid therapy. Similarly, the effects of radiotherapy on CBF and metabolism explain the clinical improvement of patients undergoing this therapy.
Tumor characterization with FDG-PET has been correlated with the histologic grade of primary brain tumors.77–80 Hypermetabolism is observed in high-grade gliomas because the rate of cell growth is directly related to tumor metabolism (Fig. 20-8).79,81 Areas of hypermetabolism in low-grade gliomas may suggest histologic deterioration to a higher grade. Therefore, FDG-PET has prognostic value because the histologic grade of a primary brain tumor determines the prognosis and treatment options, as has been confirmed by several investigators.82,83 For example, patients with MRI-detected low-grade gliomas can postpone undergoing biopsy if they are monitored carefully with serial FDG-PET and MRI. Then, when surgery is indicated, the FDG-PET profiles of tumor delimitation can be used to guide stereotactic biopsy to the areas most likely to yield the correct tumor grade.84
Hypometabolism, as measured by FDG-PET, has been the defining characteristic of low-grade gliomas. Areas of high glucose uptake in a low-grade glioma suggest malignant degeneration. However, differentiation of low-grade glioma histology based on FDG-PET imaging is problematic. Glucose metabolic rates are generally lower in low-grade astrocytomas and oligodendrogliomas than in normal brain tissue. Moreover, oligodendrogliomas have slightly higher metabolism than do low-grade astrocytomas. It has been suggested that histologic differentiation of these two tumors may be accomplished with [11C]methionine-PET.85 Oligodendrogliomas have significantly higher uptake of this tracer than do low-grade astrocytomas, and this observation may be related to cell density and turnover in each of these tumors. Higher cell turnover, presumably present in oligodendrogliomas,86 may also account for this difference. During the follow-up period, FDG-PET studies have value in differentiating radiation necrosis from tumor recurrence; radiation necrosis has very low cell turnover, and consequently, that region does not accumulate FDG significantly (Figs. 20-9 to 20-11; see also Fig. 20-8). This differential diagnosis is important for patients with malignant gliomas and metastatic tumors undergoing multimodality therapy.85,87
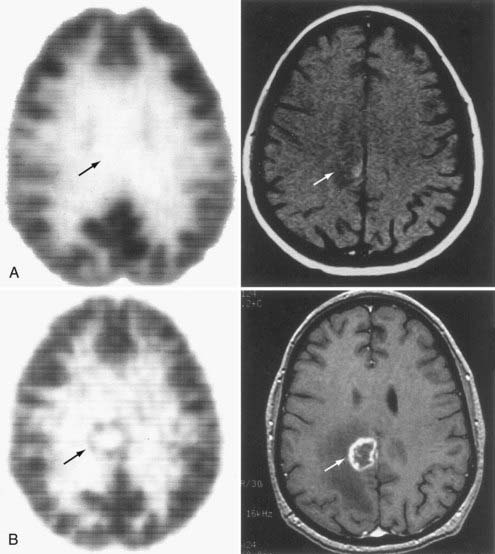
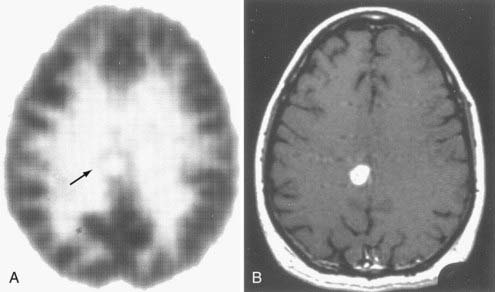
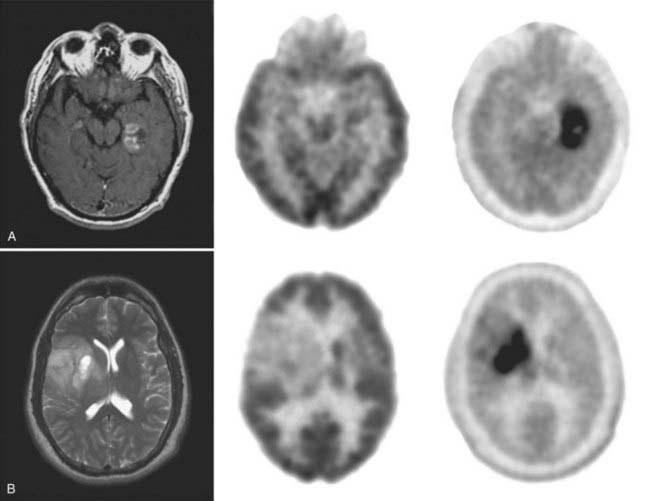
FIGURE 20-9 A, [18F]Fluoro-2-deoxy-D-glucose (FDG)–positron emission tomography (PET) (left) and magnetic resonance imaging (MRI) (right) 3 months after stereotactic radiosurgery for a melanoma. Arrows show the location of the previous tumor (presented in Fig. 20-8). B, FDG-PET and gadolinium-enhanced T1-weighted MRI at the time of recurrence, 3 months later. PET is instrumental in differentiating tumor recurrence from radiation necrosis, a distinction that cannot be ascertained with MRI. Arrows point to the tumor recurrence.
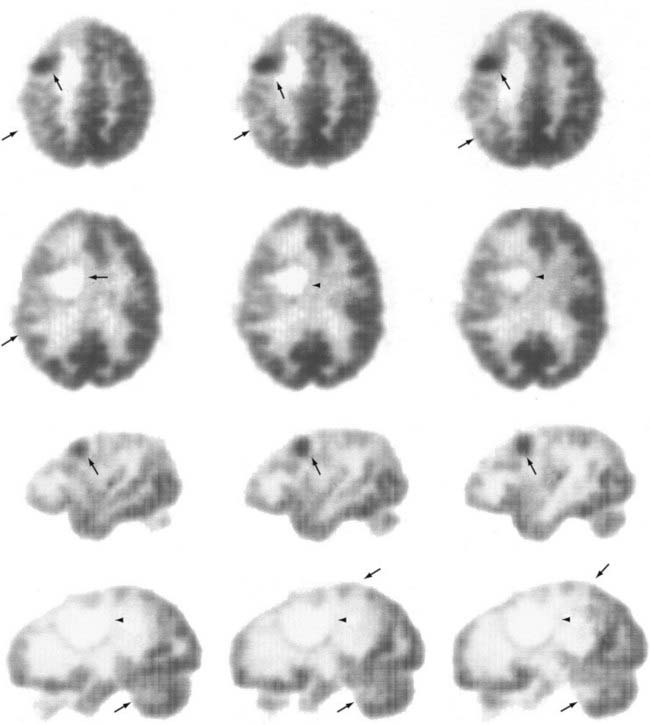
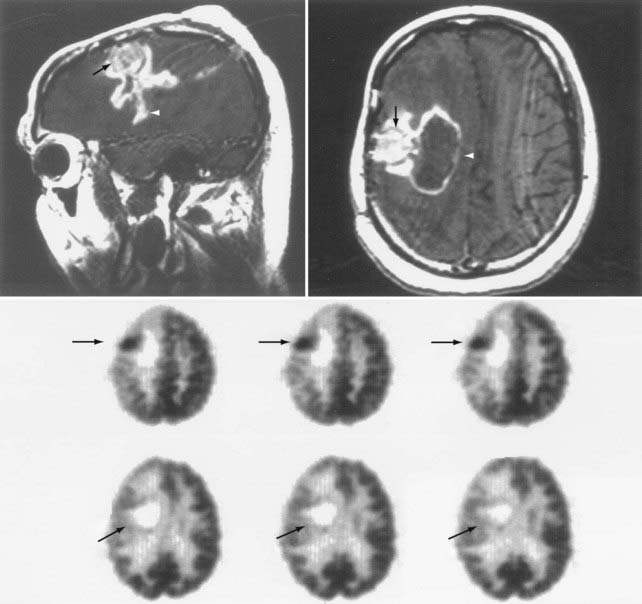
FIGURE 20-11 The upper images show sagittal and axial gadolinium-enhanced T1-weighted magnetic resonance imaging (MRI) scans of breakdown of the blood-brain barrier (white arrowheads) related to tumor (black arrows) presence (same study as in Fig. 20-10). [18F]Fluoro-2-deoxy-D-glucose (FDG)–positron emission tomography (PET) images (middle and bottom rows) show postoperative changes and the resection cavity devoid of FDG uptake (bottom row—oblique arrows). The darker areas represent higher metabolic rates (middle row—horizontal arrows). Note that the areas shown by arrowheads on MRI represent surgical changes and are not seen as hypermetabolism on the PET image.
Several other tracers have been used in brain tumor research, but most are related to breakdown of the blood-brain barrier and add little to the already exquisite imaging capabilities of MRI with gadolinium enhancement. They do add, however, to the study of alterations in various transport mechanisms across the blood-brain barrier.88 For example, [11C]methyl-glucose measures the facilitated diffusion rate of glucose, rubidium 82 uses the same active transport carrier as potassium,89 and [11C]albumin studies can be used to assess pinocytosis mechanisms related to the transport of much larger molecules and proteins.89,90 This unique ability of PET to image specific aspects of blood-brain barrier permeability makes it attractive for follow-up studies of chemotherapy trials.
Studies using FDOPA as an amino acid analogue (Fig. 20-12) have now shown that this tracer is sensitive for the detection of primary brain tumors and is superior to FDG (Fig. 20-13). FDOPA imaging is also helpful in the detection of tumor recurrence in the presence of radiation necrosis, but it has no specificity for tumor grade. Recent studies of amino acid PET tracers suggest that they are also more sensitive than FDG for imaging some recurrent tumors, in particular, recurrent low-grade astrocytomas. For example, the finding of high uptake versus no uptake of the amino acid [18F]fluoroethyltyrosine ([18F]FET) was shown to strongly correlate with malignant progression of nonspecific findings on MRI.91
Other new applications of PET tracers that image important aspects of tumor biology include the use of 3′-deoxy-3′-[18F]fluorothymidine, which can serve as an index of cell proliferation.92
Unfortunately, differentiation of tumor recurrence and radiation necrosis is still not definitive with these amino acid PET tracers. Therefore, PET continues as a complementary imaging technique in the management of brain tumors.93 Nonetheless, PET provides clinically relevant information for precisely targeting therapy (radiosurgery, gene therapy) by identifying the most biologically active areas within the tumor mass, as defined by breakdown of the blood-brain barrier seen on other imaging modalities such as MRI and CT.
Brain Injury
PET is unique in its ability to study brain energy metabolism because it is the only imaging modality that can provide all the parameters of energy metabolism (CBF, CBV, CMRO2, OEF, and CMRGlu) in the human brain in vivo.94 These parameters were briefly mentioned in the section on assessment of brain tumor metabolism. Their clinical relevance is exemplified by their use in assessing aspects of neurovascular disease. Alterations in these cerebrovascular factors are intimately related to areas of cerebral ischemia and provide both therapeutic and prognostic value when analyzed in situations of stressed cerebral tissue. For example, arterial obstruction or traumatic brain injury with a decrease in cerebral perfusion pressure (CPP) can be differentiated by different PET tracers. Patterns of cerebral vascular activity can be detected by PET with 15O-, 11C-, or 18F-labeled tracers, depending on the viability of the stressed tissue.95
Brain Energy Metabolism Parameters
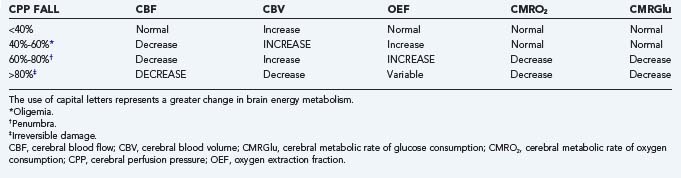
CBF is maintained within physiologic levels by blood pressure and by chemical autoregulation.96 When CBF falls to critical levels, CMRO2, OEF, and CMRGlu reflect the functional status of the tissue. Oxygen supply is continuously required in viable tissue, so OEF increases accordingly to maintain a normal CMRO2. The uncoupling of glucose metabolic rates from CBF and oxygen extraction reflects tissue stress that may be due to ischemia, traumatic injury, or seizure disorder. These changes have been characterized in relation to CPP.94 Briefly, a fall in CPP of up to 40% of baseline can be compensated if autoregulation is intact. A fall in CPP of 40% to 60% leads to levels of oligemia that are compensated by an increase in OEF to maintain CMRO2 and CMRGlu within normal limits. A 60% to 80% fall in CPP reaches levels of the ischemic penumbra. In this situation, OEF cannot compensate for the fall in CBF, and CMRO2 starts to decrease, with a consequent increase in glucose anaerobic metabolism (i.e., glycolysis). A fall of 80% or greater in CPP is accompanied by irreversible tissue damage. At this point, CBF is below critical levels, and as CBV decreases because of cerebral edema and stasis, OEF becomes variable as a result of large areas of tissue death. CMRO2 is then further decreased because of lack of metabolism, as indicated by concomitant decreases in CMRGlu.
Clinical Implications
The diagnosis of “misery-perfusion syndrome” has implications in the clinical management of patients with stroke, head trauma, or subarachnoid hemorrhage secondary to bleeding from an aneurysm or arteriovenous malformation. Misery-perfusion syndrome is characterized by a decrease in CBF with normal CMRO2 maintained by a compensatory increase in OEF (Table 20-4). Measures to increase CBF in this circumstance can result in progression from the phase of tapping into the perfusion reserve (also called oligemia) to true tissue stress, the ischemic penumbra, and irreversible tissue damage.97 Such measures may include the simple use of rheologic agents and triple-H therapy (hypertension, hypervolemia, and hemodilution) or surgical procedures such as arterioplasty, extracranial-to-intracranial arterial bypass, or carotid endarterectomy. Advantage is taken of the perfusion reserve to achieve an increase in CBV. There is a consistent increase in CBF, which leads to an increase in intracranial pressure during the initial phase of exhaustion of “autoregulation,” as well as in oligemia and the ischemic penumbra (see Table 20-4). This has particularly ominous repercussions not just for patients with severe head injury but for patients with borderline high intracranial pressure from cerebral infarction or subarachnoid hemorrhage as well. Maintenance of adequate CPP becomes the sine qua non, not only in these pathologic circumstances but also during general anesthesia, when patients with brain tumors have a risk for increased intracranial pressure.
Prolonged periods of inadequate CPP from any pathologic situation result in the accumulation of metabolites that have an important impact in the reperfusion phase.98 Terms such as luxury perfusion,99 hyperperfusion, relative luxury perfusion, and true hyperemia denote levels of vasodilation and paralysis secondary to metabolic influences in the cerebral vasculature. The degree of tissue damage depends on several factors, including the type and maturity of the tissue98 and tissue activity at the time of the metabolic demand. Determining the extent of the oligemic state and the degree to which penumbral areas have evolved to a state of irreversible damage is important for certain clinical trials and for the definition of inclusion criteria.100 Only PET studies can offer the detailed regional analysis necessary for these important decisions.
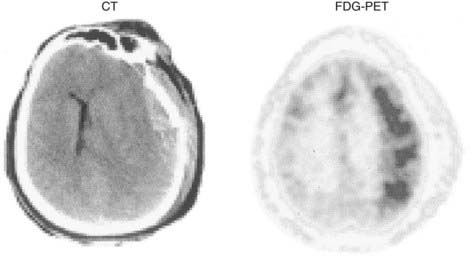
Regional aberrations in cerebral metabolism also appear in unique situations such as seizures, intracranial hematomas, and head trauma.101 In these situations, significant uncoupling of CBF and glucose metabolism can be detected by FDG-PET studies during the acute and subacute periods (Fig. 20-14). Hypermetabolism in the acute stage of traumatic brain injury has been well characterized.102 However, its regional nature and relationship to posttraumatic events, such as areas of contusion, subclinical seizures, and relief of pressure by surgical intervention, have only recently been demonstrated by serial FDG-PET studies.103 The pathophysiologic substrate of this hyperglycolysis has not been defined. Its presence and degree have been unequivocally related to prognosis after traumatic brain injury,102 although the repercussions for tissue recovery are currently unknown. In addition to these acute changes in cerebral metabolism that have been confirmed by PET studies, other alterations during the rehabilitative period are suggestive of brain plasticity. For instance, it has been demonstrated that recruitment of motor areas in nondamaged parts of the brain can affect recovery of lost regional function.104
In Vivo Drug Monitoring
An excellent example of a PET-based pharmacokinetic study in humans was conducted with deprenyl, an irreversible monoamine oxidase B (MAO-B) inhibitor used for Parkinson’s disease.105 To determine the regional MAO-B distribution in brain, [11C]deprenyl was synthesized for use as a PET tracer. [11C]Deprenyl-PET imaging studies then showed that the MAO-B content is 60% higher in the thalamus and basal ganglia than in cortical regions and the cerebellum. Subsequently, a series of [11C]deprenyl-PET studies were used to estimate the half-time for MAO-B synthesis in vivo in individual subjects. First, a [11C]deprenyl-PET scan was obtained for determining baseline values of brain MAO-B content. Before the next [11C]deprenyl-PET scan, the individuals were administered deprenyl in pharmacologic doses (5 mg/day for 7 days) to achieve essentially total irreversible inhibition of MAO-B. Thereafter, a second [11C]deprenyl-PET scan was obtained. Relative to the pretreatment scan values, [11C]deprenyl binding after administration of deprenyl was reduced by 90%, thus indicating nearly complete inactivation of the enzyme. Multiple scans in the individuals during the next 2 months revealed a protracted recovery of MAO-B binding, which was attributed to the time course needed for synthesis of new enzyme. These data were used to calculate a 40-day half-time for MAO-B synthesis. These results provided the first in vivo measurement of the synthesis rate of a specific protein in human brain. Furthermore, these results indicated that the recommended daily clinical dose of deprenyl (5 mg twice a day) exceeded the dose necessary for therapeutic efficacy. This study elegantly illustrates how PET can be used to determine appropriate drug dosages for optimal efficacy.
PET has also been used to determine the relationship between drug dose and receptor occupancy by using a PET tracer that binds to the same receptor site as the drug to be studied.106,107 In this paradigm, two PET studies are conducted. In the first study, only the tracer is administered and its receptor binding profile is determined. Then, in the second study, a pharmacologic dose of the drug is administered before injection of the tracer. Tracer binding will be reduced relative to the first study because now a fraction of the receptors are occupied by the drug. The percent reduction in tracer binding then corresponds to the percent receptor occupancy by the drug. These in vivo pharmacokinetic studies provide more accurate estimates of drug-receptor occupancy than those derived from calculations based on administered dose or drug plasma concentrations.
Baron J. Clinical use of positron emission tomography in cerebrovascular disease. Neurosurg Clin N Am. 1996;7:653-664.
Braak H, Braak E, Yilmazer D, et al. Neurofibrillary tangles and neuropil threads as a cause of dementia in Parkinson’s disease. J Neural Transm Suppl. 1997;51:49-55.
Chen W, Silverman DH. Advances in evaluation of primary brain tumors. Semin Nucl Med. 2008;38:240-250.
Cherry SR, Dahlbom M. PET. Physics, instrumentation, and scanners. In: Phelps ME, editor. PET Molecular Imaging and its Biological Applications. New York: Springer; 2004:70-93.
, 2008 Dresel S, ed. PET in Oncology, vol 170. Berlin: Springer-Verlag, 2008.
Freed CR, Greene PE, Breeze RE, et al. Transplantation of embryonic dopamine neurons for severe Parkinson’s disease. N Engl J Med. 2001;344:710-719.
Gunn RN, Gunn SR, Turkheimer FE, et al. Positron emission tomography compartmental models: a basis pursuit strategy for kinetic modeling. J Cereb Blood Flow Metab. 2002;22:1425-1439.
Huang C, Tang C, Feigin A, et al. Changes in network activity with the progression of Parkinson’s disease. Brain. 2007;130:1834-1846.
Klunk WE, Engler H, Nordberg A, et al. Imaging brain amyloid in Alzheimer’s disease with Pittsburgh Compound-B. Ann Neurol. 2004;55:306-319.
Kopell BH, Greenberg B, Rezai AR. Deep brain stimulation for psychiatric disorders. J Clin Neurophysiol. 2004;21:51-67.
Koutroumanidis M, Binnie CD, Panayiotopoulos CP. Positron emission tomography in partial epilepsies: the clinical point of view. Nucl Med Commun. 1998;19:1123-1126.
Martinez MJ, Ziegler SI, Beyer T. PET and PET/CT: basic principles and instrumentation. Recent Results Cancer Res. 2008;170:1-23.
Nordberg A. Amyloid imaging in Alzheimer’s disease. Curr Opin Neurol. 2007;20:398-402.
Olanow CW, Goetz CG, Kordower JH, et al. A double-blind controlled trial of bilateral fetal nigral transplantation in Parkinson’s disease. Ann Neurol. 2003;54:403-414.
Patronas N, Di Chiro G, Kufta C. Prediction of survival in glioma patients by means of positron emission tomography. J Neurosurg. 1995;62:816-822.
Phelps ME. PET Molecular Imaging and its Biological Applications. New York, NY: Springer; 2004.
Rosenow JM, Mogilnert AY, Ahmed A, et al. Deep brain stimulation for movement disorders. Neurol Res. 2004;26:9-20.
Slifstein M, Laruelle M. Models and methods for derivation of in vivo neuroreceptor parameters with PET and SPECT reversible radiotracers. Nucl Med Biol. 2001;28:595-608.
Soret M, Bacharach SL, Buvat I. Partial-volume effect in PET tumor imaging. J Nucl Med. 2007;48:932-945.
Uppoor RS, Mummaneni P, Cooper E, et al. The use of imaging in the early development of neuropharmacological drugs: a survey of approved NDAs. Clin Pharmacol Ther. 2008;84:69-74.
Volkow ND, Fowler JS, Gatley SJ, et al. PET evaluation of the dopamine system of the human brain. J Nucl Med. 1996;37:1242-1256.
Wang J, Maurer L. Positron emission tomography: applications in drug discovery and drug development. Curr Top Med Chem. 2005;5:1053-1075.
Widjaja E, Raybaud C. Advances in neuroimaging in patients with epilepsy. Neurosurg Focus. 2008;25(3):E3.
1 Gambhir SS, Barrio JR, Phelps ME, et al. Imaging adenoviral-directed reporter gene expression in living animals with positron emission tomography. Proc Natl Acad Sci U S A. 1999;96:2333-2338.
2 Phelps ME. PET: the merging of biology and imaging into molecular imaging. J Nucl Med. 2000;41:661-681.
3 Wang J, Maurer L. Positron emission tomography: applications in drug discovery and drug development. Curr Top Med Chem. 2005;5:1053-1075.
4 Phelps ME. PET Molecular Imaging and its Biological Applications. New York: Springer; 2004.
5 PET in Oncology, vol 170. Berlin: Springer-Verlag, 2008.
6 Martinez MJ, Ziegler SI, Beyer T. PET and PET/CT: basic principles and instrumentation. Recent Results Cancer Res. 2008;170:1-23.
7 Chatziioannou AF, Cherry SR, Shao Y, et al. Performance evaluation of microPET: a high-resolution lutetium oxyorthosilicate PET scanner for animal imaging. J Nucl Med. 1999;40:1164-1175.
8 Soret M, Bacharach SL, Buvat I. Partial-volume effect in PET tumor imaging. J Nucl Med. 2007;48:932-945.
9 Cherry SR, Dahlbom M. PET. Physics, instrumentation, and scanners. In: Phelps ME, editor. PET Molecular Imaging and its Biological Applications. New York: Springer; 2004:70-93.
10 Gunn RN, Gunn SR, Turkheimer FE, et al. Positron emission tomography compartmental models: a basis pursuit strategy for kinetic modeling. J Cereb Blood Flow Metab. 2002;22:1425-1439.
11 Sokoloff L. Cerebral circulation, metabolism, and synthesis. In: Phelps M, editor. PET and Autoradiography: Principles and Applications for the Brain and the Heart. New York: Raven Press, 1986.
12 Sokoloff L, Fitzgerald G, Kaufman E. Cerebral nutrition and energy metabolism. In: Wurtman RJ, Wurtman JJ, editors. Nutrition and the Brain, vol 1. New York: Raven Press; 1977:87-139.
13 Volkow ND, Fowler JS, Gatley SJ, et al. PET evaluation of the dopamine system of the human brain. J Nucl Med. 1996;37:1242-1256.
14 Slifstein M, Laruelle M. Models and methods for derivation of in vivo neuroreceptor parameters with PET and SPECT reversible radiotracers. Nucl Med Biol. 2001;28:595-608.
15 Laruelle M, Slifstein M, Huang Y. Positron emission tomography: imaging and quantification of neurotransporter availability. Methods. 2002;27:287-299.
16 Frey KA, Minoshima S, Kuhl DE. Neurochemical imaging of Alzheimer’s disease and other degenerative dementias. Q J Nucl Med. 1998;42:166-178.
17 Brooks DJ. Advances in imaging Parkinson’s disease. Curr Opin Neurol. 1997;10:327-331.
18 Morrish P, Sawle G, Brooks D. Clinical and [18]dopa PET findings in early Parkinson’s disease. J Neurol Neurosurg Psychiatry. 1995;59:597-600.
19 Firnau G, Garnett ES, Chirakal R, et al. [18F]fluoro-L-dopa for the in vivo study of intracerebral dopamine. Int J Radiat Appl Instrum [A]. 1986;37:669-675.
20 Barrio J, Huang S, Melega W, et al. 6-[18F]fluoro-L-dopa probes dopamine turnover rates in central dopaminergic structures. J Neurosci Res. 1990;27:487-493.
21 Huang SC, Yu DC, Barrio JR, et al. Kinetics and modeling of L-6-[18F]fluoro-dopa in human positron emission tomographic studies. J Cereb Blood Flow Metab. 1991;11:898-913.
22 Eidelberg D, Moeller JR, Dhawan V, et al. The metabolic anatomy of Parkinson’s disease: complementary [18F]fluorodeoxyglucose and [18F]fluorodopa positron emission tomography. Mov Disord. 1990;5:203-213.
23 Madras BK. 11C-WIN 35,428 for detecting dopamine depletion in mild Parkinson’s disease. Ann Neurol. 1994;35:376-377.
24 Kazumata K, Dhawan V, Chaly T, et al. Dopamine transporter imaging with fluorine-18-FPCIT and PET. J Nucl Med. 1998;39:1521-1530.
25 Huang C, Tang C, Feigin A, et al. Changes in network activity with the progression of Parkinson’s disease. Brain. 2007;130:1834-1846.
26 Stoessl AJ, de la Fuente-Fernandez R. Dopamine receptors in Parkinson’s disease: imaging studies. Adv Neurol. 2003;91:65-71.
27 Robertson HA. Dopamine receptor interactions: some implications for the treatment of Parkinson’s disease. Trends Neurosci. 1992;15:201-205.
28 Brooks DJ, Ibanez V, Sawle GV, et al. Striatal D2 receptor status in patients with Parkinson’s disease, striatonigral degeneration, and progressive supranuclear palsy, measured with 11C-raclopride and positron emission tomography. Ann Neurol. 1992;31:184-192.
29 Freed CR, Greene PE, Breeze RE, et al. Transplantation of embryonic dopamine neurons for severe Parkinson’s disease. N Engl J Med. 2001;344:710-719.
30 Olanow CW, Goetz CG, Kordower JH, et al. A double-blind controlled trial of bilateral fetal nigral transplantation in Parkinson’s disease. Ann Neurol. 2003;54:403-414.
31 Lawrence AD, Weeks RA, Brooks DJ, et al. The relationship between striatal dopamine receptor binding and cognitive performance in Huntington’s disease. Brain. 1998;121:1343-1355.
32 Haxby JV, Grady CL, Koss E, et al. Longitudinal study of cerebral metabolic asymmetries and associated neuropsychological patterns in early dementia of the Alzheimer type. Arch Neurol. 1990;47:753-760.
33 Mielke R, Heiss W-D. Positron emission tomography for diagnosis of Alzheimer’s disease and vascular dementia. J Neural Transm Suppl. 1998;53:237-250.
34 Braak H, Braak E. [Morphological changes in the human cerebral cortex in dementia.]. J Hirnforsch. 1991;32:277-282.
35 Braak H, Braak E. Neuropathological staging of Alzheimer-related changes. Acta Neuropathol. 1991;82:239-259.
36 Braak H, Braak E, Yilmazer D, et al. Neurofibrillary tangles and neuropil threads as a cause of dementia in Parkinson’s disease. J Neural Transm Suppl. 1997;51:49-55.
37 Klunk WE, Engler H, Nordberg A, et al. Imaging brain amyloid in Alzheimer’s disease with Pittsburgh Compound-B. Ann Neurol. 2004;55:306-319.
38 Nordberg A. Amyloid imaging in Alzheimer’s disease. Curr Opin Neurol. 2007;20:398-402.
39 Mayberg HS, Brannan SK, Tekell JL, et al. Regional metabolic effects of fluoxetine in major depression: serial changes and relationship to clinical response. Biol Psychiatry. 2000;48:830-843.
40 Kopell BH, Greenberg B, Rezai AR. Deep brain stimulation for psychiatric disorders. J Clin Neurophysiol. 2004;21:51-67.
41 Drevets WC, Bogers W, Raichle ME. Functional anatomical correlates of antidepressant drug treatment assessed using PET measures of regional glucose metabolism. Eur Neuropsychopharmacol. 2002;12:527-544.
42 Mayberg HS, Liotti M, Brannan SK, et al. Reciprocal limbic-cortical function and negative mood: converging PET findings in depression and normal sadness. Am J Psychiatry. 1999;156:675-682.
43 Liotti M, Mayberg HS, Brannan SK, et al. Differential limbic-cortical correlates of sadness and anxiety in healthy subjects: implications for affective disorders. Biol Psychiatry. 2000;48:30-42.
44 Mayberg HS, Lozano AM, Voon V, et al. Deep brain stimulation for treatment-resistant depression. Neuron. 2005;45:651-660.
45 Liu K, Zhang H, Liu C, et al. Stereotactic treatment of refractory obsessive compulsive disorder by bilateral capsulotomy with 3 years follow-up. J Clin Neurosci. 2008;15:622-629.
46 Rosenow JM, Mogilnert AY, Ahmed A, et al. Deep brain stimulation for movement disorders. Neurol Res. 2004;26:9-20.
47 Savic I, Altshuler L, Baxter L, et al. Pattern of interictal hypometabolism in PET scans with fluorodeoxyglucose F-18 reflects focus detection and surgical outcome. Epilepsy. 1997;3:81-86.
48 Chugani HT. PET in preoperative evaluation of intractable epilepsy. Pediatr Neurol. 1993;5:411-413.
49 Boling W, Olivier A. The current state of epilepsy surgery. Curr Opin Neurol. 1998;11:155-161.
50 Widjaja E, Raybaud C. Advances in neuroimaging in patients with epilepsy. Neurosurg Focus. 2008;25(3):E3.
51 Henry T, Mazziotta J, Engel JJ. The functional anatomy of frontal lobe epilepsy studied with PET. Adv Neurol. 1992;57:449-463.
52 Engel JJ. Clinical neurophysiology, neuroimaging, and the surgical treatment of epilepsy. Curr Opin Neurol Neurosurg. 1993;6:240-249.
53 Engel JJ, Henry TR, Risinger MW, et al. Presurgical evaluation for partial epilepsy: relative contributions of chronic depth-electrode recordings versus FDG-PET and scalp-sphenoidal ictal EEG. Neurology. 1990;40:1670-1677.
54 De Salles AA, Swartz BE, Lee TT, et al. Subdural recording and electrical stimulation for cortical mapping and induction of usual seizures. Stereotact Funct Neurosurg. 1994;62:226-231.
55 Regis J, Semah F, Bryan RN, et al. Early and delayed MR and PET changes after selective temporomesial radiosurgery in mesial temporal lobe epilepsy. AJNR Am J Neuroradiol. 1999;2:213-216.
56 Chugani H, Shields W, Shewmon D. Infantile spasms: I. PET identifies focal cortical dysgenesis in cryptogenic cases for surgical treatment. Ann Neurol. 1990;27:406-413.
57 Theodore W, Sato S, Kufta C, et al. FDG-positron emission tomography and invasive EEG: seizure focus detection and surgical outcome. Epilepsy. 1997;38:81-86.
58 Shahar E, Goldsher D, Genizi J, et al. Intractable gelastic seizures during infancy: ictal positron emission tomography (PET) demonstrating epileptiform activity within the hypothalamic hamartoma. J Child Neurol. 2008;23:235-239.
59 Selch MT, Gorgulho A, Mattozo C, et al. Linear accelerator stereotactic radiosurgery for the treatment of gelastic seizures due to hypothalamic hamartoma. Minim Invasive Neurosurg. 2005;48:310-314.
60 O’Brian T, Newton M, Cook M, et al. Hippocampal atrophy is not the major determinant of hypometabolism in temporal lobe epilepsy. Epilepsy. 1997;38:74-80.
61 Lee N, Tien R, Lewis D, et al. Fast spin-echo, magnetic resonance imaging–measured hippocampal volume: correlation with neuronal density in anterior temporal lobectomy patients. Epilesy. 1995;36:899-904.
62 Koutroumanidis M, Binnie CD, Panayiotopoulos CP. Positron emission tomography in partial epilepsies: the clinical point of view. Nucl Med Commun. 1998;19:1123-1126.
63 Van Paesschen W, Duncan J, Stevens J, et al. Etiology and early prognosis of newly diagnosed partial seizures in adults: a quantitative hippocampal MRI study. Neurology. 1997;49:753-757.
64 Breiter S, Arroyo S, Mathews V, et al. Proton MR spectroscopy in patients with seizure disorders. AJNR Am J Neuroradiol. 1994;15:373-384.
65 Ende G, Laxder K, Knowlton R, et al. Temporal lobe epilepsy: bilateral hippocampal metabolite changes revealed at proton MR spectroscopy imaging. Radiology. 1997;202:809-817.
66 Cross J, Connelly A, Jackson C, et al. Proton magnetic resonance spectroscopy in children with temporal lobe epilepsy. Ann Neurol. 1996;39:107-113.
67 Vermathen P, Ende G, Laxer K, et al. Hippocampal N-acetylaspartate in neocortical epilepsy and mesial temporal lobe epilepsy. Ann Neurol. 1997;42:194-199.
68 Sissodiya S, Moran N, Free S, et al. Correlation of widespread preoperative magnetic resonance imaging changes with unsuccessful surgery for hippocampal sclerosis. Ann Neurol. 1997;41:490-496.
69 Bittar R, Olivier A, Sadikot A, et al. Localization of somatosensory function by using positron emission tomography scanning: a comparison with intraoperative cortical stimulation. J Neurosurg. 1999;90:478-483.
70 Bookheimer S, Zeffiro T, Blaxton T, et al. A direct comparison of PET activation and electrocortical stimulation mapping for language localization. Neurology. 1997;48:1056-1065.
71 McDonald JD, Chong BW, Lewine JD, et al. Integration of preoperative and intraoperative functional brain mapping in a frameless stereotactic environment for lesions near eloquent cortex. Technical note. J Neurosurg. 1999;90:591-598.
72 Hodge CJJr, Huckins SC, Szeverenyi NM, et al. Patterns of lateral sensory cortical activation determined using functional magnetic resonance imaging. J Neurosurg. 1998;89:769-779.
73 Pujol J, Conesa G, Deus J, et al. Clinical application of functional magnetic resonance imaging in presurgical identification of the central sulcus. J Neurosurg. 1998;88:863-869.
74 Jueptner M, Weiller C. Review: does measurement of regional cerebral blood flow reflect synaptic activity: implications for PET and fMRI? Neuroimage. 1995;2:148-156.
75 Beaney R. Positron emission tomography in the study of human tumors. Semin Nucl Med. 1984;4:324-341.
76 Jarden J, Dhawan V, Poltorak A. Positron emission tomographic measurement of blood-to-brain and blood-to-tumor transport of 82Rb: the effect of dexamethasone and whole brain radiation therapy. Ann Neurol. 1985;18:636-646.
77 Di Chiro G, De La Paz R, Brooks R. Glucose utilization of cerebral gliomas measured by 18F fluorodeoxyglucose and positron emission tomography. Neurology. 1982;32:1323-1329.
78 Di Chiro G. Positron emission tomography using [18F]fluorodeoxyglucose on brain tumors. A powerful diagnostic and prognostic tool. Invest Radiol. 1986;22:360-371.
79 Di Chiro G, Hatazawa J, Katz D. Glucose utilization by intracranial meningiomas as an index of tumor aggressivity and probability of recurrence: a PET study. Radiology. 1987;164:521-526.
80 Di Chiro G, Brooks R. PET quantitation: blessing and curse. J Nucl Med. 1988;29:1603-1604.
81 Herholz K, Hendel W, Luyten P. In vivo imaging of glucose consumption and lactate concentration in human gliomas. Ann Neurol. 1992;31:319-327.
82 Patronas N, Di Chiro G, Kufta C. Prediction of survival in glioma patients by means of positron emission tomography. J Neurosurg. 1995;62:816-822.
83 Herholz K, Friendrichs B, Jeske J. Prognostic significance of positron emission tomography with F-18-fluorodeoxyglucose in gliomas. J Cancer Res Clin Oncol. 1992;118:119.
84 Levivier M, Goldman S, Bidaut LM. Positron emission tomography–guided stereotactic brain biopsy. Neurosurgery. 1992;31:792-797.
85 Bustany P, Chatel M, Derlon JM, et al. Brain tumor protein synthesis and histological grades: a study by positron emission tomography (PET) with C11-L-methionine. J Neurooncol. 1986;3:397-404.
86 Dumas-Duport C. Histological grading of gliomas. Curr Opin Neurol Neurosurg. 1992;5:924-931.
87 Doyle W, Budinger T, Valk P. Differentiation of cerebral radiation necrosis from tumor recurrence by [18F] FDG and 82-Rb positron emission tomography. J Comp Assist Tomogr. 1987;11:563-570.
88 Wienhard K, Herholz K, Coenen HH, et al. Increased amino acid transport into brain tumors measured by PET of L-(2-18F)fluorotyrosine. J Nucl Med. 1991;32:1338-1346.
89 Yen CK, Yano Y, Bundinger TF, et al. Brain tumor evaluation using Rb-82 and positron emission tomography. J Nucl Med. 1982;23:532-537.
90 Wienhard K, Herholz K, Coenen H. Increased amino acid transport into brain tumors measured by PET of L-(2-18F)fluorotyrosine. J Nucl Med. 1991;32:1338-1346.
91 Floeth FW, Sabel M, Stoffels G, et al. Prognostic value of 18F-fluoroethyl-L-tyrosine PET and MRI in small nonspecific incidental brain lesions. J Nucl Med. 2008;49:730-737.
92 Chen W, Silverman DH. Advances in evaluation of primary brain tumors. Semin Nucl Med. 2008;38:240-250.
93 Terakawa Y, Tsuyuguchi N, Iwai Y, et al. Diagnostic accuracy of 11C-methionine PET for differentiation of recurrent brain tumors from radiation necrosis after radiotherapy. J Nucl Med. 2008;49:694-699.
94 Baron J. Clinical use of positron emission tomography in cerebrovascular disease. Neurosurg Clin N Am. 1996;7:653-664.
95 Gallagher CN, Hutchinson PJ, Pickard JD. Neuroimaging in trauma. Curr Opin Neurol. 2007;20:403-409.
96 Acherman R, Zilkha E, Bull J, et al. The relationship of the CO2 reactivity of cerebral vessels to blood pressure and mean resting blood flow. Neurology. 1973;23:21-26.
97 Baron JC, Bousser MG, Rey A. Reversal of focal “misery-perfusion syndrome” by extra-intracranial arterial bypass in hemodynamic cerebral ischemia: a case study with 15O positron emission tomography. Stroke. 1981;12:454-459.
98 De Salles A. Role of stereotaxis in the treatment of cerebral palsy. J Child Neurol. 1996;11:S43-S50.
99 Lassen N. The luxury perfusion syndrome and its possible relation to acute metabolic acidosis localized within the brain. Lancet. 1966;2:1113-1115.
100 Baron J, Von Kummer R, Del Zoppo G. Treatment of acute ischemic stroke. Challenging the concept of rigid and universal time window. Stroke. 1995;26:2219-2221.
101 Matz P, Pitts L. Monitoring in traumatic brain injury. Clin Neurosurg. 1997;44:267-294.
102 De Salles A, Kontos H, Becker D. Prognostic significance of CSF lactic acidosis after severe head injury. J Neurosurg. 1986;65:615-624.
103 Bergsneider M, Hovda D, Shalmos E. Cerebral hyperglycolysis following severe traumatic brain injury in humans: a positron emission tomography study. J Neurosurg. 1997;86:241-251.
104 Di Piero V, Chollet F, MacCarthy P. Motor recovery after acute ischaemic stroke: a metabolic study. J Neurol Neurosurg Psychiatry. 1992;55:990.
105 Fowler JS, Volkow ND, Logan J, et al. Slow recovery of human brain MAO B after L-deprenyl (selegiline) withdrawal. Synapse. 1994;18:86-93.
106 Farde L. The advantage of using positron emission tomography in drug research. Trends Neurosci. 1996;19:211-214.
107 Uppoor RS, Mummaneni P, Cooper E, et al. The use of imaging in the early development of neuropharmacological drugs: a survey of approved NDAs. Clin Pharmacol Ther. 2008;84:69-74.