[level-membership-for-hematology-oncology-and-palliative-medicine-category]
9 Molecular Imaging and PET/CT
Molecular Imaging in Radiation Oncology
Noninvasive biologic imaging has been developed and enhanced for more than a half century since the first medical ultrasonic measurement in 1954,1 the invention of a clinical x-ray computed tomography (CT) scanner in 1972,2 and the acquisition of the first magnetic resonance image (MRI) in 1973.3 These methods have evolved to offer high imaging performance in terms of scanning time, spatial resolution, and image quality, and now are commonplace in medical settings. In general, the source of contrast in these imaging modalities is gross tissue anatomy or structure. For example, x-ray CT differentiates tissues on the basis of their density and x-ray absorption, which vary greatly between bone, air, and water but minimally between different soft tissue types. MRI detects differences in proton density and magnetic relaxation, which can vary substantially between soft tissues. Many of these properties have only tangential relationships to the physiologic or functional aspects of the tissue being imaged, however. A tumor may be difficult to localize on CT because its absorption properties are not significantly different than the tissue from which it arose. This shortcoming of conventional anatomic imaging prompted the development of molecular imaging, loosely defined as the noninvasive detection, localization, and quantitation of specific molecular entities or physiologic processes in a living organism.
Positron Emission Tomography
Basic Physics
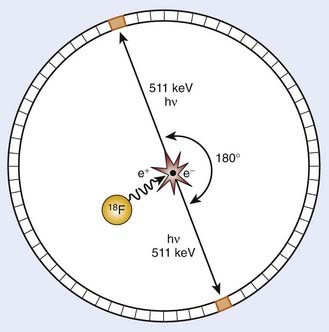
PET is an imaging modality derived from the unique physics of radioactive decay of positron-emitting radionuclides. Such non-natural isotopes, including 11C, 13N, 18F, 64Cu, and 124I (Table 9-1), are unstable and decay through the conversion of a proton within the nucleus into a neutron, a neutrino, and a positron that is subsequently emitted from the atom. This decay process reduces the atomic number of the atom by 1 and ejects the positron from the nucleus. The emitted positron has a mean travel distance, dependent on the medium and its energy, in the range of 1 to 10 mm. After traveling some distance, the positron annihilates with its opposite particle the electron, and their energy is converted into two “annihilation” photons of 511 keV emitted in opposite directions.
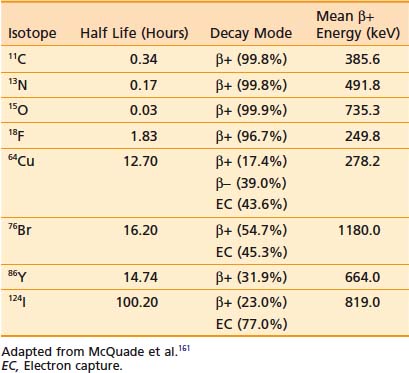
To detect and localize such events, PET devices were developed as arrays of detectors that can convert the high-energy photons into optical photons through scintillation crystals, such as bismuth germanate and lutetium oxyorthosilicate, and subsequently into electrical pulses using photomultiplier tubes. Unlike similar devices for single-photon emission computed tomography that must rely on physical collimators to restrict the field of view of each detector to a defined spatial volume, PET scanners operate on the principle of coincidence detection. Because each positron emission event results in two photons traveling at 180 degrees to each other, PET detector arrays are designed to identify pairs of detectors that report events within a short (typically 6-20 nanoseconds) window of each other. These pairs of events are termed coincidence events. A typical PET acquisition involves the measurement of millions of coincidence events from a subject containing a distribution of a positron-emitting compound. This detection strategy is demonstrated in Figure 9-1. The concept of PET scanning was conceived in the late 1950s and early 1960s,4 resulting in the advent of a clinically useful scanning device in the early 1970s.5,6 Modern clinical PET scanners achieve spatial resolutions of 4 to 6 mm, with sensitivities in units of counts per second for a 1 µCi point source at the center of the scanner of 200 to 2000.7
The performance of modern PET scanners is dictated by a number of factors. To conserve momentum in the positron-electron annihilation, the directions of travel of the annihilation photons are not perfectly collinear, with the divergence from collinearity approximately 1 degree or less. This slight noncollinearity between the emitted photons limits the resolution of PET, becoming more severe with increasing detector bore sizes. In addition, thick scintillator crystals are typically used in detectors to increase their photon-stopping ability. However, the thickness of the crystal can cause uncertainties in localizing events, particularly for detector pairs whose joining lines are at oblique angles to the detector face (such as detector pairs on the same side of the circular array). This causes a loss in spatial resolution for regions of the image away from the center of the scanner. Emerging “depth of interaction” detector technology has been developed to estimate where within a crystal an event occurred to mitigate this effect.8,9 Scattered photons detected by the PET scanner as well as random coincidences occurring when photons from two separate positron events are recorded as a coincidence affect both the quantitative ability of PET as well as the spatial characteristics of resulting images. Strategies for random coincidence corrections and scatter rejection have been developed to combat these phenomena, and are discussed in the Image Reconstruction and Analysis section.
A recent achievement in PET scanner design has been the realization of time-of-flight (TOF) PET systems. From the inception of PET, engineers have striven to construct detectors with temporal responses fast enough to not only identify coincidence photons measured on separate detectors, but also to quantify the time lag between the arrival of each of the coincidence photons. This time can then be used to calculate where along the line connecting the two detectors the positron event occurred, increasing the quality of reconstructed PET images. One vendor now has a TOF PET-CT system available, the performance of which has been favorably compared with conventional PET scanners.10 In addition, combination of PET imaging technology with respiratory monitoring devices has resulted in the acquisition of motion-resolved, four-dimensional (4-D) PET data sets using methods analogous to 4-D CT.11,12
Integration With Computed Tomography
The principal advantage of PET/CT is the ability to interpret the PET images in the context of the anatomic reference provided by a high-spatial-resolution CT data set. This has been shown clinically to enhance the diagnostic interpretation of these data beyond that possible through consideration of the PET or CT in isolation.13 However, the integration of PET and CT has yielded other benefits as well. A key technical improvement afforded by PET/CT is the ability to correct the PET data for photon absorption within the subject, using the CT image to estimate the anticipated photon attenuation along the line joining each detector pair. Whereas attenuation correction was previously performed in standalone PET scanners using transmission images acquired with the PET detectors using a rotating rod source, the high signal-to-noise ratio and spatial resolution of CT images has significantly enhanced the performance of this correction. Furthermore, the development of hybrid PET/CT scanners has accelerated the inclusion of PET data in radiation treatment planning because it is possible using these devices to acquire coregistered PET data at the time of CT simulation.
Image Reconstruction and Analysis
The traditional method of reconstruction for PET data has been the filtered backprojection technique, analogous to that used in x-ray CT. This method involves filtering the projection data using a ramp filter in the frequency domain, and uniformly distributing each filtered projection along the projection direction. This “backprojection,” when applied to a complete tomographic data set, then gives a reconstructed image. The sensitivity of this algorithm to high-frequency noise necessitates further filtering at the cost of spatial resolution. More computationally expensive iterative reconstruction techniques have evolved to address the shortcomings of analytic backprojection methods. In general, these methods operate through successive adjustments of the reconstructed parameter distribution, which is then subjected to a forward projection operator producing the corresponding expected measured data set that can be compared directly with the experimentally measured data. This strategy allows modeling of the acquisition process and can account for attenuation, scatter, noise, and other experimental factors. Examples of reconstruction methods of this type now in commercial use include maximum-likelihood expectation maximization,14 ordered-subset expectation maximization,15 and row-action maximization-likelihood16 algorithms. Following reconstruction of the data into spatial images, a system calibration factor determined from quality assurance procedures is then applied to convert the images from units of counts per second into units of activity per unit volume (µCi/mL).
Positron Emission Tomography Radiotracers
The prevalent radiotracer in use in PET imaging is 2-deoxy-2-18F-FDG. FDG is an analog of glucose in which the hydroxy group typically found in the second position of the six-member ring has been replaced with 18F.17 Originally developed as an anticancer agent, 2-deoxyglucose (2DG) was designed to be cytotoxic to tumor cells that depend on glycolysis for energy production.18 This compound is taken up into cells by glucose transporters, and undergoes phosphorylation by hexokinase in the first step of glycolysis. However, because of the absence of the 2-hydroxyl group, the molecule cannot be further metabolized, and because at this stage the molecule has been phosphorylated and acquired a charge, it cannot easily cross the cell membrane and be cleared. This “trapping” of FDG within glycolytically active cells therefore generates a PET signal that can be imaged. Although 2DG as a cancer therapeutic has suffered largely because of the large doses required to out-compete endogenous glucose and the normal tissue toxicities thereby incurred, FDG has proven successful as a PET radiotracer because the trace doses administered avoid toxicity and because the uptake of this compound by tumors can be as much as 20 times that of surrounding normal tissue. A typical clinical dose for human imaging is up to 15 mCi of FDG at a specific activity of greater than 200 mCi/µmol, corresponding to a maximum mass dose of FDG of 75 nmol.
Although FDG PET now has proven clinical applications in a variety of oncologic sites, it has several shortcomings. Observation of elevated FDG uptake on a PET scan of a cancer patient could be associated with (1) increased tumor mass or cellularity, (2) upregulation of glucose transporters, (3) upregulation of hexokinase, (4) inflammatory responses, or (5) muscle activity. Therefore, although FDG PET can provide valuable clinical information, there have been subsequent efforts to develop more specific PET radiotracers that can report on specific aspects of an individual patient’s cancer and more fully characterize it so as to select and monitor the most effective course of treatment. 18F-fluorothymidine (FLT) is a thymidine analog that is taken up into cells and phosphorylated by thymidine kinases, resulting in a trapping similar to that of FDG.19 Although FLT is not incorporated into deoxyribonucleic acid, the association of thymidine kinase activity with S-phase cells suggests that FLT uptake gives a measure of cellular proliferation. FLT PET images acquired from human lung tumors have been correlated with proliferation measured using Ki-67 immunohistochemistry.20
An area of PET tracer development with great relevance to radiation oncology is that of agents targeting hypoxic cells. A number of compounds employing the “cellular trapping” localization scheme have been synthesized and evaluated for their ability to accumulate in cells lacking oxygen. A number of these are based on 2-nitroimidazole–containing groups, which are reduced by cellular reductase enzymes to reactive species that bind covalently to intracellular macromolecules and are thus trapped. These reduction reactions can be reversed by molecular oxygen, resulting in radiotracer trapping occurring primarily in hypoxic cells.21 Radiotracers of this type that have been evaluated in the clinic include 18F-fluoromisonidazole,22 18F-fluoroazomycin arabinoside,23,24 and 2-(2-nitro-1H-imidazol-1-yl)-N-(2,2,3,3,3-pentafluoropropyl)-actamide (18F-EF5).25,26 64Cu-Diacetyl-bis (N4-methylthiosemicarbazone) (64Cu-ATSM) is another hypoxia-selective PET radiotracer, employing a longer-lived 64Cu radionuclide label, which employs bioreductive pathways causing the molecule to become charged to induce intracellular trapping.27,28
In addition to radiotracers that become trapped within cells, a second class of PET agents are those that bind to specific proteins expressed on the surface of cells. Radiotracers of this type are common in neurologic studies of neuronal receptors; however, this localization method has frequently been applied to oncologic imaging as well. An emerging radiotracer of this type is arginine-glycine-aspartic acid peptides labeled with 18F or 64Cu. These compounds have been shown to bind to αςβ3 integrins expressed on endothelial cells of angiogenic vessels, allowing imaging of the molecular aspects of angiogenesis using PET.29,30 In addition to small molecule probes, labeled antibodies against a variety of targets have been developed as PET radiotracers,31 providing a mechanism for translating antibodies developed for molecular biology applications into imaging agents. A key design constraint for receptor-binding PET radiotracers is that they must have high specific activity so as to avoid competition for binding sites between labeled (detectable) and unlabeled (undetectable) probe molecules within the radiotracer formulation.
A final class of PET radiotracers deserving mention are those that are used to measure vascular perfusion, such as 13N-NH3 and 15O-H2O. The short half-lives of these compounds as well as their biodistributions limit their use in PET experiments to short time frames after injection. Commonly, dynamic images are acquired rapidly after injection and fit to compartmental models to extract estimates of vascular volume or perfusion from the measured time-activity data.32–34
Magnetic Resonance Spectroscopy
Basic Physics
 ) in water in biologic tissues to encode spatial information and create an image, MRS exploits the latter property given previously to differentiate protons or other nuclei with quantum spin based on their molecular association. This technique forms the basis of the use of NMR techniques for the identification and measurement of chemical structure. Although MRS can be used to study any nuclei possessing quantum spin, including 1H, 19F, and 31P, the proton (1H) has the highest intrinsic sensitivity for nuclear measurement and has been studied in the most detail in vivo, and is the subject of this discussion.
Magnetic resonance pulse sequences used for the acquisition of spectroscopic data began with the simplest “pulse and measure” technique in which a 90-degree excitation pulse is applied to a sample under a strong static magnetic field, and the resulting free induction decay signal is recorded using an inductive coil. More sophisticated spin echo sequences employing a subsequent 180-degree refocusing pulse35 were developed to avoid signal losses caused by field inhomogeneities and other static disturbances characterized by the relaxation rate T2*. To apply MRS to living subjects, a number of further technical issues must be resolved. Although it is feasible to obtain a homogeneous sample of a chemical for NMR analysis, for in vivo subjects, a mechanism of restricting the imaging volume is required. In the most straightforward sense, this can be achieved by using acquisition hardware with a limited sensitive volume. Surface coils have been applied in this regard as their transmission and reception sensitivity is very high near the coil aperture but falls off quickly.36 More flexible methods have been developed to select volumes for spectroscopic measurement through software rather than hardware. This can be done in a manner identical to that done for slice selection in MRI, through the marriage of excitation pulses with a well-defined bandwidth and linear magnetic field gradients applied along a specific spatial dimension. Biologic spectroscopy acquisitions can apply three sequential selective excitations to excite orthogonal planes of spins, resulting in the final selection of a rectangular volume of interest. This technique can be implemented using either three 90-degree pulses, termed stimulated echo acquisition mode (STEAM),37 or by one 90-degree and two refocusing 180-degree pulses, termed point resolved spectroscopy (PRESS).38 PRESS is unable to achieve the short echo times (TEs) of STEAM because it uses multiple refocusing pulses, but it has the advantage of being a true spin echo technique and therefore insensitive to T2* signal losses.
In addition to the problem of suppressing signals from spins outside the volume of interest, in vivo MRS also faces the difficulty of removing signals from spins present in compounds other than those of biochemical interest. The largest of these is water, which is present in biologic tissues in molar concentrations and is several orders of magnitude more abundant than the metabolites of interest. Such an overwhelming signal can dominate the dynamic range of an MR system and prevent accurate quantitation of other less intense spin resonances. Strategies for suppressing the water signal from spectroscopic acquisitions focus on either destroying the coherent magnetization produced by water protons or on excluding the resonance frequency of water protons from the bandwidth of the excitation pulse. The former technique has been achieved through use of chemical shift selective saturation (CHESS) pulses, which consist of a 90-degree excitation pulse, specific to the resonance frequency of water protons, followed by a strong dephasing gradient pulse.39 CHESS methods can be expanded to other potentially unwanted resonances such as lipid by modification of the pulse bandwidth or inclusion of additional CHESS pulses prior to measurement. The alternate approach, that of excluding the unwanted resonances from the bandwidth of the excitation pulses, can be achieved using frequency-selective techniques analogous to those described for STEAM and PRESS. However, the difficulty of simultaneously selecting both a restricted spatial volume (in conjunction with magnetic field gradients) and a restricted spectral range using a single pulse is apparent. This problem has been solved through the development of spectral-spatial selective pulses that incorporate complex varying gradient and pulse waveforms.40
Although single-voxel spectroscopic acquisitions remain useful for a variety of diagnostic purposes, application of MRS in radiation oncology has been contingent on the development of methods for imaging spectroscopic signals. This goal is complicated by the dependence of spin resonance frequency and hence chemical shift information on the applied magnetic field, which prevents the use of frequency-encoding readout gradients like those used in MRI. The simplest solution to this problem is to apply a series of phase-encoding gradients along the spatial axes prior to the acquisition of an echo, and to step the intensities of these gradients so as to map out frequency space, or “k space,” to the desired extent and resolution. This procedure, termed chemical shift imaging (CSI) or magnetic resonance spectroscopic imaging (MRSI), has been applied to acquire MR spectra from two- and three-dimensional (3-D) grids of voxels. The time required for such acquisitions is given by the number of acquired voxels multiplied by the repetition time of the sequence. Faster spectroscopic imaging solutions have been pursued by applying time-varying gradients during readout and deconvolving the contribution of these gradients from the measured spectroscopic information during reconstruction,41 in an approach similar to that of echo-planar MRI. This technique, termed fast or spiral CSI, can reduce the acquisition time required for spectroscopic imaging at the expense of more pronounced susceptibility and aliasing artifacts also encountered with echo-planar MRI.
Image Reconstruction and Analysis
The raw data obtained from a spectroscopic acquisition must first be processed, corrected, and reconstructed. Spectroscopic imaging data must first be Fourier transformed along each phase encoding direction to separate the data into spatial voxels. Because of the nature of the frequency domain acquisition of MRSI data, the relatively coarse voxels can be retrospectively positioned and reconstructed within the excitation volume by multiplying the acquired data array by a complex exponential. This data is then Fourier transformed to generate a frequency spectrum, which is then subjected to a variety of corrections for spectral frequency and baseline and peak phase.42 When this reconstruction and correction procedure has been completed, the peaks of interest within the acquired spectra may then be identified and peak parameters (height, area, width) calculated.
A general difficulty in interpreting MRS relative to other molecular imaging modalities is that the measured data includes both spatial dimensions as well as a spectral, frequency dimension. A variety of classification techniques have been reported for discriminating normal from neoplastic tissues on the basis of spectroscopic information.43–49 Of these, the work of McKnight and colleagues is particularly relevant to radiation oncology because it condenses the data contained in a spectrum into a single metric, or alternately translates a 4-D MRSI data set into a 3-D volume image more immediately familiar to modern radiologists and clinicians. This is accomplished for brain MRSI data by performing a regression analysis using the choline and N-acetyl aspartate (NAA) levels calculated for all voxels in an MRSI data set, and classifying each spectrum based on the distance its choline and NAA levels lie from the regression line calculated for an automatically selected population of “normal” spectra. This distance is called the z score or abnormality index, and serves as a measure of the deviation between a voxel’s spectrum and that of normal tissue.
Site Restrictions
Several phenomena limit the application of MRSI methods to several well-suited anatomic sites. First, the tissue of interest must contain a metabolic or molecular signature that makes it worthwhile to investigate with spectroscopy. To be detected by in vivo MRS, a metabolite must be present in appreciable concentrations to produce a detectable signal. In general, this requirement necessitates millimolar concentrations for the spin groups of interest.50,51 Furthermore, the transverse relaxation time (T2) of the spin population must be sufficiently long relative to the TE used in the acquisition sequence to avoid complete relaxation of the magnetization before signal measurement. This precludes detection of macromolecules or compounds that are tethered to large complexes, such as membrane-associated molecules. Finally, the peaks of interest must be adequately removed from other peaks present in the spectrum so that they can be independently resolved and quantified. In addition, the macroscopic structure of the tissue must be amenable to the acquisition of high-quality spectroscopic data. This mandates that it be of relatively homogeneous magnetic susceptibility. In addition, because of the relatively long duration of MRS acquisitions, the tissue should not be subject to excessive motion.
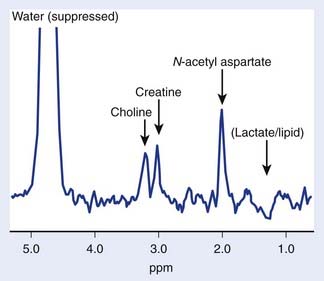
The brain is particularly suited for interrogation with 1H MRS techniques. It is a relatively static organ and is largely free of air–tissue interfaces that can introduce difficulties in producing a constant magnetic field across it. A long TE spin echo acquisition sequence can detect five basic types of metabolites in the brain: choline-containing compounds, creatine, NAA, lactate, and mobile lipids, as shown in Figure 9-2. Choline levels in glioma are generally increased relative to normal cerebrum52–59 reflecting altered membrane phospholipid metabolism54,59,60 or increased cellularity in neoplastic tissue.54,59–61 High-grade (World Health Organization grade 4) gliomas do not show the same magnitude of choline elevation as lower grade gliomas; this is thought to be related to the micronecrotic nature of these lesions.54 The appearance of the MRS creatine peak in brain neoplasms appears to be inversely correlated to tumor grade, with grade 4 lesions demonstrating the most reduced creatine levels relative to normal tissue.60 NAA has been shown to be localized in neuronal cells,62–64 allowing its use as an MRS marker of viable neurons. Dramatic reductions in the MRS NAA signal are observed in studies of gliomas, which are indicative of the death of neurons as they are encroached upon by the invading neoplasm, or the displacement of neuronal tissue by tumor-related mass effects.52–59 The ability to simultaneously observe both a tumor-associated resonance (choline) as well as a marker associated with normal tissue (NAA) enhances the diagnostic ability of MRS. Lactate and lipid protons both resonate in the 1.0 to 1.5 ppm range. Lactate, the end product of anaerobic glycolysis, has a controversial status in clinical brain MRS; some have associated its presence with poor clinical outcome indicative of tumor hypoxia,60 whereas others have noted that lactate accumulation is nonspecific and can be either an intrinsic property of the tumor or an effect of treatment-induced ischemia.54 Lipid signals in brain MRS can either come from spectral contamination from subcutaneous fatty tissues included in the MRS volume, or from micronecrosis and cellular breakdown present in high-grade or post-treatment lesions.56,65 Lipid resonances may be an indicator of membrane breakdown and necrosis, potentially reflective of the necrotic nature of glioblastoma multiforme. Increasing magnetic field strength and decreasing echo times and spatial resolutions have facilitated the detection of an increased number of metabolites from brain tissue, including glutamine, glutamate, taurine, inositol, and aspartate.66
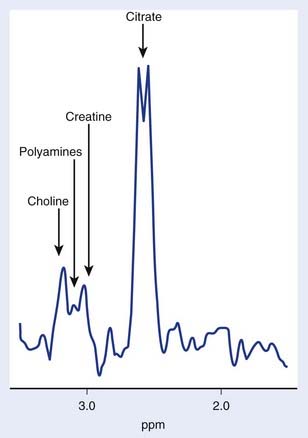
The use of transmission and reception coils inserted into the rectum has allowed the acquisition of high signal-to-noise ratio MRI and MRS data from the prostate. Long-echo MRS studies of the prostate allow quantitation of choline, creatine, and citrate as demonstrated in Figure 9-3. As in brain MRS, choline is a marker of altered neoplastic membrane metabolism, and the MRS peak it generates can similarly be used as a biomarker of cancer.67 A peak containing contributions from polyamine compounds including spermine and spermidine is found at 3.1 ppm, but its detection can be complicated by broad line widths and by its proximity to the choline and creatine peaks, especially at 1.5 T. Decreased polyamine levels have been associated with malignant prostate cancer.68 However, the principal marker of normal prostate metabolism in spectroscopic measurements is citrate, present in the MR spectrum as a quartet centered at 2.6 ppm. Citrate is produced, accumulated, and secreted by normal epithelial cells within the gland. During the process of malignant transformation, prostatic cells become dedifferentiated and correspondingly lose their capacity for citrate production and secretion. This results in levels of MRS-visible citrate being reduced in neoplastic tissue relative to normal tissue.
Several groups have attempted to study breast cancer using spectroscopic methods. The problems of water and lipid suppression are exacerbated when measuring within the breast; however, improved techniques have proven adequate for the robust detection of relative choline levels across the breast.69 However, in breast spectroscopy there is no easily detectable normal marker to play the role that NAA does in brain MRS and citrate does in prostate MRS.
Molecular Imaging in the Clinic
Lung Cancer
In the evaluation of lung cancer, 18F-FDG PET and PET/CT is helpful for the evaluation of lung nodules, as well as for the staging and restaging of established non–small cell lung cancer (NSCLC). As demonstrated by a meta-analysis by Gould in 2001, PET has a sensitivity of greater than 96% for detecting and characterizing malignant lung nodules greater than 1 cm, while maintaining an overall specificity of 77%.70 18F-FDG PET is an excellent modality for staging mediastinal and hilar lymph nodes, with an overall sensitivity in the range of 85% and specificity of 80%. A meta-analysis that directly compared patients staged by both 18F-FDG PET and CT showed that PET is superior, with a sensitivity range of 85% to 95% and specificity range of 81% to 100% versus a sensitivity of 64% and specificity of 62% for CT.71 In addition, PET is well suited for detecting distant metastases because it is routinely performed as a whole-body examination (from the base of the skull to the mid-thighs) and may find distant metastases in as many as 10% to 25% of lung cancer patients. PET is particularly useful for evaluating metastatic disease within the adrenal glands, because they pose a diagnostic challenge on CT.72
Melanoma
In contrast to lung cancer, 18F-FDG PET has little role for the initial screening and detection of melanoma because of a significant decrease in sensitivity for detecting lesions smaller than 7 mm.73,74 However, 18F-FDG PET does have a role at initial staging for patients at high risk for metastatic disease.75 This includes those patients with extensive locoregional disease at initial biopsy, a clinical history and examination suspicious for metastases, and those patients with known metastatic disease (for whom an alternative therapy may be sought if additional metastases are found). In a retrospective review of 257 patients with stage III and IV melanoma by Bastiaannet et al., 21.8% of the patients were upstaged as a result of PET findings and in 17.1% the treatment was changed from surgery to systemic therapy.76 For those patients with early stage melanoma at initial diagnosis, the added value of PET over conventional imaging is likely limited. In a prospective randomized trial of 144 patients (139 had primary cutaneous melanoma and five had local recurrent melanoma), Wagner et al. noted that PET scanning did not affect the care of patients with early stage melanoma already staged with standard techniques and thus is not recommended for the initial staging in this population.74
Breast Cancer
18F-FDG PET has a limited role in the initial screening of breast cancer largely because of two limiting factors: low sensitivity of PET for lesions smaller than 7 mm and low FDG avidity for lobular carcinomas and carcinoma in-situ.77 In addition, PET is not as sensitive as sentinel lymph biopsy for the detection of axillary lymph node disease.78 Although PET has a limited role in the detection of primary breast cancer and staging the axilla, it can be important in detecting distant disease and in helping to plan surgical and medical treatment.79–84
Jacobs et al. reported a preliminary study of 18 patients with histologically verified breast disease,85 in which useable MRS imaging data was acquired for 83% of the patients. Partial suppression of the lipid and water resonances allowed relative quantitation of choline as well as lipid and water signals across the breast. Choline levels in patients with malignant lesions were on average 2.5 times larger than those in patients with benign lesions. Similar results have been reported by Bartella and Huang, who have observed that the choline level measured by MRS may be an early indicator of breast tumor response to chemotherapy.86
Esophageal Cancer
In esophageal cancer, the initial diagnostic workup includes evaluation by a combination of endoscopy, endoscopic ultrasound (EUS) and CT, with 18F-FDG PET playing an adjunctive role. 18F-FDG PET is used primarily for initial staging and evaluating response to neoadjuvant treatment for both adenocarcinoma and squamous cell carcinoma.87 Direct comparisons of the staging sensitivity and specificity of PET, CT, and combination CT and EUS have yielded mixed results. Locoregional lymph node staging appears to be most accurate with EUS, with one comparison study reporting an accuracy of 75% for EUS versus 63% for PET.88 For distant nodal and organ metastases, PET appears to have greater sensitivity than CT and a greater effect in appropriately upstaging patients who would have otherwise undergone unwarranted surgery. Overall, the optimal initial staging strategy may be the decision-analysis model proposed by Wallace et al. in 2002, which demonstrated that the combination of 18F-FDG PET with EUS and fine-needle aspiration biopsy is most effective.89
Colorectal Carcinoma
Because of the presence of nonspecific normal variant bowel activity and its relatively high cost, 18F-FDG PET is generally not recommended for colorectal cancer screening, with some reports suggesting that premalignant and malignant lesions cannot be reliably detected by this modality.90 In addition, PET is not effective in evaluating tumor depth or locoregional nodal disease (T and N staging, respectively). 18F-FDG PET does have a high sensitivity for detecting distant metastatic disease, particularly in the liver, and may alter the intent of surgical procedures (from curative to palliative measures).
Head and Neck Cancer
The use of 18F-FDG PET for the identification and characterization of head and neck tumors has been described primarily for squamous cell carcinoma. The primary utility of 18F-FDG PET in head and neck cancer is for the detection of locoregional nodal disease and distant metastases. Numerous studies that directly compared 18F-FDG PET to CT and clinical examination showed that PET has a higher sensitivity and specificity than either CT91 or physical examination for the initial pretreatment evaluation of metastatic lymph nodes of the head and neck. Furthermore, several reports also demonstrate that 18F-FDG PET and MRI have comparable sensitivities, but PET has superior specificity in evaluating metastatic lymph nodes. PET is most commonly used for those patients with suspected local lymph node metastases in which the identification of additional contralateral or distant malignant lymph nodes needs to be elucidated. However, in those patients with negative nodal (N0) disease by clinical examination and CT or MRI, the role of PET is uncertain. In current practice, N0 patients undergo minimally invasive sentinel lymph node biopsy to determine the presence of locoregional nodal metastases and subsequent need for an elective neck dissection. At least one prospective report shows the sensitivity of 18F-FDG PET is unacceptably low in detecting occult metastases when compared with sentinel lymph node biopsy. In patients with more advanced disease, PET is useful and superior to CT for detecting distant sites of disease as well as synchronous tumors.
Thyroid Cancer
FDG PET has little to no role in the initial staging of differentiated thyroid cancer. However, it may be used adjunctively for initial staging of anaplastic thyroid cancer. The standard imaging management of differentiated thyroid cancer is initial and follow-up 123I scintigraphy after surgery and radioiodine therapy. During the follow-up phase of clinical management, FDG PET is performed in the setting of discordantly high blood levels of thyroglobulin (Tg) and negative 123I scintiscans. There are many reports of the value of PET in thyroid cancer, with the first one as early as 1987.92 Several reports deal in particular with iodine-negative, Tg-positive patients.93–101 Stokkel et al. have tabulated the results in 18 published series. The sensitivity of PET varies from approximately 50% to 100%, and the range is likely due to the degree of differentiation of residual cancer and the volume of tissue. In general, poorly differentiated cancers demonstrate higher uptake of FDG, whereas well-differentiated cancers that trap iodine might fail to be imaged.102
Lymphoma
18F-FDG PET and PET/CT are commonly used for initial staging of Hodgkin and non-Hodgkin lymphoma.103,104 18F-FDG PET has shown high accuracy in the early prediction of response to chemotherapy.105 Therefore, PET may play a role in tailoring the intensity of the treatment to the individual patient.
Brain Tumors
FDG PET has a limited role in the management of brain tumors because of strong FDG uptake by normal cerebral tissue. However, brain MRS has a solid biologic basis and has been applied in a number of studies to improve diagnosis and staging of tumors, including differentiation of active tumor from radiation necrosis,106,107 and discrimination of low-grade and high-grade gliomas.108,109 A study of 176 intracranial lesions using single-voxel spectroscopy by Möller-Hartmann et al. revealed that MRS improved diagnosis beyond MRI alone, increasing the number of correct diagnoses by 15.4% and reducing the number of incorrect diagnoses by 6.2%.110 A separate study by Murphy et al. of 100 patients demonstrated that MRS provided useful diagnostic information in 6 of 26 patients in which the MRI and clinical information were inconclusive.111
Prostate Cancer
FDG PET is not part of the standard workup for prostate cancer patients, both because of difficulties imaging a structure adjacent to the bladder and because of limited FDG uptake by prostate tumors. MRS studies of prostate cancer, however, have demonstrated that this molecular imaging modality can significantly enhance the diagnosis and staging of prostate tumors. A specificity of 91% has been reported for combined MRI and MRS imaging examinations,112 whereas incorporation of MRI, MRS imaging, and step-section pathologic examination has demonstrated a higher sensitivity, specificity, and positive predictive value relative to standard sextant biopsy of the prostate.113 In addition, staging of prostate tumors has been shown to be improved by inclusion of MRS imaging data, with a study by Bartolozzi et al. reporting sensitivities and specificities of a combined MRI and MRS examination in diagnosing capsular invasion of 95% and 82%, and in diagnosing seminal vesicle invasion of 80% and 93%, respectively.114
Consistency of Target Delineation and Changes in Treatment Plans with PET
PET provides an additional contrast mechanism for distinguishing tumor from normal anatomy compared with CT alone, and as such can reduce the variability in image interpretation. A number of studies have compared tumor volumes contoured by multiple observers based on CT alone compared with PET-CT. Two studies in lung cancer115,116 and a study in rectal cancer117 demonstrated substantial improvement in interobserver contouring consistency when fused PET-CT images were used. Of note, in the Memorial Sloan-Kettering Cancer Center study116 the comparison was between visual incorporation of PET information versus fused PET-CT acquired in the treatment position, highlighting the importance of accurate fusion and PET imaging integrated in the actual treatment planning scan. That study also found improved consistency in intraobserver recontouring with fused PET-CT. On the other hand, a study in head and neck cancer found high interobserver variability whether contouring on CT or PET-CT that improved when a standardized protocol was implemented, indicating the importance of consistent training and guidelines.118
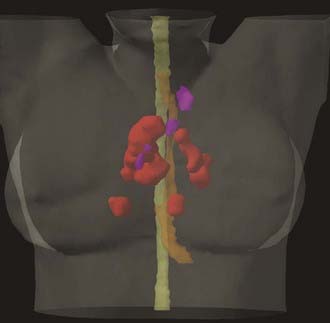
Given the known differences in sensitivity and specificity between CT and PET for tumor detection, significant changes in tumor volumes can be expected when using PET in addition to CT for treatment planning. One of the most significant changes is identification of previously unsuspected distant metastases that would make definitive therapy unfeasible. In a study at Peter McCallum Cancer Institute, metastatic disease was found in 27 of 153 patients initially thought to be candidates for radical radiation therapy for NSCLC.119 With respect to changes in target volumes, a literature review of PET-CT planning studies across multiple tumor sites found that the incorporation of FDG PET imaging information resulted in altered target volumes in between 10% and 100% of patients.120 The discordance between PET and CT resulted in both exclusion of CT-based targets and inclusion of new targets. To the extent that PET-CT target definition is more accurate, this would be expected to reduce geographic misses and decrease unnecessary normal tissue irradiation and toxicity (Figure 9-4).
Preliminary Clinical Outcomes Data
The Peter McCallum Cancer Institute conducted a retrospective comparison of patients who received radical radiation therapy for NSCLC, 80 of whom had pretreatment FDG PET staging and 77 of whom did not.119 The median survival of these groups was 31 versus 16 months, respectively. This largely reflects stage migration introduced by PET, which screened patients with distant metastatic disease detectable only by PET from receiving futile radical therapy, but may also represent an improved outcome from better targeting of the GTV. A prospective Dutch study of 44 patients with stage I–III NSCLC receiving definitive radiation therapy targeting only PET-positive nodes without inclusion of elective nodal regions demonstrated only a single recurrence isolated to an initially PET-negative nodal region outside the radiation field (and only two others with concurrent relapse either in-field or distantly) with a median follow up of 16 months.121 A retrospective analysis of patterns of locoregional recurrence in 35 patients treated at M.D. Anderson Cancer Center with FDG PET–based definitive radiation therapy for NSCLC using recursive partitioning analysis identified standardized uptake value (SUV) greater than 13.8 as the strongest factor predicting recurrence on a per-lesion basis, followed by tumor volume larger than 1.2 mL and SUV less than 13.8.122 In a series of patients from Memorial Sloan-Kettering Cancer Center who had locoregional recurrences after definitive radiation therapy for NSCLC, the recurrences at the primary tumor site were predominantly within the GTV when lower doses (<60 Gy) were used, but at the margin of the target volume with higher doses (>60 Gy), whereas the nodal recurrences were primarily marginal or geographic misses.123 These observations were interpreted to indicate the importance of high radiation dose for tumor control, and the inadequacy of visual incorporation of PET data (used in this series) for GTV definition, particularly for nodal targets. A retrospective study of failure patterns in head and neck squamous cell carcinoma at the University of Michigan found that 9 of 61 patients had locoregional failure, all within the targeted GTV, 8 of which were in PET-positive regions and 1 of which was in a PET-negative region included in the GTV based on other criteria.124
Practical Considerations
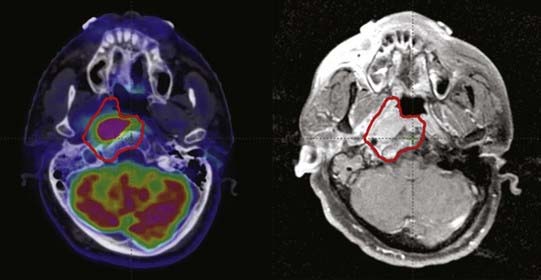
Particularly in the skull base, MRI can detect perineural enhancement or marrow space changes indicative of tumor extension along nerves or into bone, respectively, that FDG PET frequently fails to detect (Figure 9-5). It is possible that such changes represent reactive changes to microscopic tumor rather than the presence of macroscopic tumor, and pathologic confirmation generally is not available, but we recommend including such areas in the GTV. This illustrates the importance of considering all available information when determining target volumes.
Magnetic Resonance Spectroscopy–Based Treatment Planning
Because of the common hardware used to acquire both MRI and MRS data, the role of MRS in radiation treatment planning is enhanced by the coregistration of functional spectroscopic data with anatomic MR images that are acquired as part of the staging or treatment-planning process for many cancer types. However, the widespread adoption of MRS as a component of radiation treatment planning has been slowed by several factors. It is generally known that irregularities in the magnetic field of an MR scanner can cause distortions in reconstructed MR images and correspondingly in MRS data. Although it does not significantly affect the diagnostic quality of these images, this warping can be problematic for radiotherapy planning in which precise target localization is needed for beam delivery. Furthermore, use of MRS data to define spatial treatment volumes is complicated by the poor spatial resolution of MRS relative to MRI as well as to PET, as well as the need to combine MRI and MRS data with the CT needed for dosimetric calculations during radiotherapy planning.125 Nonetheless, preliminary investigations of the utility of MRS in planning radiation therapies for brain and prostate tumors have shown promising results.
A study of 36 patients with recurrent gliomas treated with gamma knife radiosurgery showed a significant association between change in tumor volume, progression-free survival, and overall survival with the extent of the pretreatment MRS-abnormal region relative to the radiosurgical target.126 This suggested that MRS might be used to define the radiation target to treat regions of glioma not apparent on MRI. A subsequent planning study of 34 glioma patients indicated that the contrast-enhancing volume apparent on T1-weighted MRI is considerably smaller than the volume of abnormality visible with MRS imaging, and that although the abnormal volume seen on T2-weighted MRI is of similar size to the MRS abnormality, the MRS abnormality extended beyond the T2-abnormal volume in 88% of patients by a maximum extent as great as 28 mm.127 Similar results have been obtained and correlated with patterns of failure for patients treated with 3-D conformal radiotherapy.128 Incorporation of MRS into radiotherapy planning may therefore significantly alter the treatment plan for malignant gliomas, although results of prospective studies employing such planning methods have yet to be obtained.129
In the prostate, MRS has been applied in the treatment planning context for the guidance of brachytherapy implants as well as intensity-modulated radiotherapy. A planning study of a patient with a Gleason 7 prostate cancer demonstrated that MRS imaging may be used to optimize the placement of brachytherapy seeds, allowing dose escalation to the dominant intraprostatic lesion and resulting in improvements in calculated tumor control probability.130,131 The use of MRS imaging to detect extracapsular extension and to predict response to external-beam radiotherapy has been demonstrated.132 Several studies have demonstrated how the identification of abnormal voxels on a prostate MRS imaging examination can be used to direct boost doses to tumor-associated regions within the prostate.133–135
Monitoring Tumor Response
Lung Cancer
For lung cancer patients undergoing treatment, 18F-FDG PET can be used to monitor response to chemotherapy and radiation therapy. Although the data for using PET in this clinical scenario are not as strong as for staging, there is nevertheless reasonable validation in patients with nonresectable disease that reduction of FDG activity after chemotherapy correlates with intermediate-term survival.136 Pilot data has been reported that associates reductions in FDG uptake observed after 30 to 36 Gy of a definitive course of radiation for NSCLC with progression-free survival.137
Melanoma
The strength of 18F-FDG PET in melanoma is likely for restaging and surveillance. When compared with conventional imaging and physical examination, PET is both more sensitive and specific in this clinical scenario. As reported by Iagaru et al.,138 18F-FDG PET/CT is well-suited for restaging melanoma patients, in particular those with advanced disease (stage III and IV), with a sensitivity of 89.3% (95% CI: 78.5-95) and a specificity of 88% (95% CI: 76.2-94.4).
Breast Cancer
FDG PET has been demonstrated to offer important information for monitoring response to treatment and recurrence of breast cancers.79–84 Some authors consider 18F-FDG PET/CT and MRI complementary modalities for detecting local-regional breast cancer recurrence, with PET confirming the diagnosis in cases in which MRI is indeterminate because of nonspecific findings.139 However, MRI has been shown to be able to detect smaller lesions (less than 10 mm in size) and those that conventional mammography and PET scanning may miss.79,140 It has been reported to have better correlation with pathologic findings than physical examination, mammography, and sonography.141,142 PET, on the other hand, may be more specific in detecting local-regional breast cancer recurrence, with PET again able to detect additional metastases outside of the field of view of MRI. A combination of the two modalities has been suggested to result in sensitivity and specificity near 95%.143 Walter et al. agree, but suggest MR mammography first and PET if differentiation of benign versus malignant lesion is needed, to avoid the high costs of both of these examinations.144 The use of dual-time imaging to differentiate benign from malignant lesions has been reported successfully by some authors.145
Esophageal Cancer
In patients with locally advanced esophageal cancer undergoing initial neoadjuvant therapy prior to possible follow-up surgical resection, PET appears effective in selecting those patients who have had a significant response to therapy to merit surgery versus those who do not. In this clinical setting, 18F-FDG PET is typically performed at initial staging and after completion of chemotherapy. Several reports have demonstrated that a reduction in 18F-FDG uptake at tumor sites correlates well with pathologic results of successfully treated disease, including patients undergoing radiation therapy. Brucher et al. specifically demonstrated that when using a decrease in 18F-FDG activity of greater than 50%, as measured by the SUV, 18F-FDG PET has a positive predictive value of 72% for residual disease and a negative predictive value of 100% for good response.146
Colorectal Carcinoma
18F-FDG PET is primarily used for detecting and restaging recurrent colorectal cancer after initial therapy has been completed. Several reports have demonstrated that PET has a sensitivity of greater than 90% and specificity of greater than 75% in detecting recurrent colorectal cancer.147,148 PET is particularly helpful for detecting liver metastases as well as for ruling out distant disease for those patients with proven liver metastases in which curative local resection is being contemplated.149 Moreover, PET is helpful in confirming and localizing sites of disease in patients with suspicious increases in carcinoembryonic antigen levels after treatment.150 The use of 18F-FDG PET for monitoring therapy, including neoadjuvant chemotherapy, has shown mixed results in the literature, with several studies showing that PET may identify patients with more favorable prognosis.151 In addition, integrated PET/CT appears superior to CT alone when assessing the liver for residual tumor after radiofrequency ablation of metastases.152
Head and Neck Cancer
PET has demonstrated utility in following the response of head and neck tumors to chemotherapy and radiation.153 However, several authors have described a reduction in specificity in PET scanning in postradiation cases, particularly when performed within 3 months of therapy.
Lymphoma
18F-FDG PET and PET/CT has a high diagnostic accuracy for restaging lymphoma after initial treatment.103,104 18F-FDG PET has shown high accuracy in the early prediction of response to chemotherapy and in the evaluation of residual masses after chemotherapy or radiation therapy.105 A pretreatment PET study is essential for accurate assessment of residual masses and early monitoring of response to the treatment. In addition, a baseline PET scan will help detect relapse or residual disease, because relapse occurs most often in the region of previous disease.
Brain Tumors
One of the initial applications of 1H MRS for brain tumors was the differentiation of recurrent tumor from radiation necrosis, a distinction that is difficult on the basis on contrast-enhanced MRI alone.106,107 In addition, serial MRS imaging examinations have been shown to detect response in gliomas treated with brachytherapy,154 radiosurgery,155 and external-beam radiotherapy,156 and to detect radiation damage in normal white matter.157 Tumors exhibiting a treatment response demonstrated a reduction in choline levels, which in the case of gamma knife radiosurgery were observed in 9 of 18 cases prior to changes on T2- and contrast-enhanced T1-weighted MRI.155
Prostate Cancer
Although serum tests quantifying the level of prostate-specific antigen (PSA) in the blood are the most common means of assessing prostate tumor response to treatment, the time course of PSA decreases after therapy as well as the observation of fluctuating PSA values. Imaging of tumor metabolism using MRS has been proposed as an adjunct to PSA surveillance following both brachytherapy and external-beam radiotherapy.158,159 A strong correlation was observed between outcome determined by MRI and MRS and biopsy findings, whereas only a weak correlation was noted between PSA and biopsy findings, suggesting that the inclusion of MRS may improve the assessment of therapeutic outcome.
Conclusions
The emergence of molecular imaging as a clinically feasible means of mapping tissue function and physiologic features has clear potential to improve the delivery and evaluation of radiation therapy. At present the incorporation of molecular imaging into clinical practice is very much a work in progress. FDG PET and MRS, two of the most established clinical molecular imaging modalities, have demonstrated utility in the diagnosis, staging, treatment planning, and followup of tumors of the lung, skin, breast, esophagus, colon, rectum, head and neck, thyroid, lymphatic system, brain, and prostate. However, many of these possible roles for molecular imaging have been evaluated only in pilot studies, and larger clinical trials using standardized image acquisition and analysis methods as well as prospective treatment strategies are still forthcoming. This is particularly true of applications of molecular imaging in radiation oncology, in which a number of studies examining how radiation treatment plans could be constructed incorporating functional imaging data have been performed but have yet to be delivered to actual patients. The term biologically conformal radiation therapy (BCRT) was coined by Ling et al. in 2000 as they developed a formalism for using imaging data to construct radiation treatments that are optimally tailored to a specific patient’s disease.160 Currently, however, we are caught between a “bottom-up” approach to this problem, in which imaging methods are developed to provide estimates of specific molecular and cellular parameters to apply a BCRT treatment model, and a “top-down” approach in which existing imaging methods such as FDG PET and MRS are used to develop treatment strategies in the absence of a rigorous radiobiologic model at the molecular level. As is commonly the case, the most efficient path forward appears to be to combine these two paths for development. In the next 10 years we can expect modest improvements in the performance of imaging methods such as PET and MRS, in terms of quantitative accuracy, sensitivity, and spatial resolution. Many PET radiotracers are currently in evaluation in preclinical settings that may allow quantitation of specific parameters of radiobiologic interest, moving us closer to the bottom-up BCRT model described previously. However, a number of clinical trials evaluating molecular imaging–based diagnostic, staging, and treatment strategies are also in progress, ensuring we are most fully exploiting the clinical power of existing imaging modalities.
1 Edler I, Hertz CH. The use of the ultrasonic reflectoscope for the continuous recordings of the movements of heart walls. Kungl Fysiogr Sällsk Lund Förh. 1954;24:40-58.
2 Ambrose J, Hounsfield G. Computerized transverse axial tomography. Br J Radiol. 1973;46:148-149.
3 Lauterbur PC. Image formation by induced local interactions: examples employing nuclear magnetic resonance. Nature. 1973;242:190-191.
4 Kuhl DE, Edwards RQ. Image separation isotope scanning. Radiology. 1963;80:653-662.
5 Phelps ME, Hoffman EJ, Mullani NA, et al. Application of annihilation coincidence detection to transaxial reconstruction tomography. J Nucl Med. 1975;16:210-224.
6 Ter-Pogossian MM, Phelps ME, Hoffman EJ. A positron-emission transaxial tomograph for nuclear imaging (PET). Radiology. 1975;114:89-98.
7 Zanzonico P. Positron emission tomography: a review of basic principles, scanner design and performance, and current systems. Sem Nucl Med. 2004;34:87-111.
8 Yang Y, Dokhale PA, Silverman RW, et al. Depth of interaction resolution measurements for a high resolution PET detector using position sensitive avalanche photodiodes. Phys Med Biol. 2006;51:2131-2142.
9 Du H, Yang Y, Cherry SR. Comparison of four depth-encoding PET detector modules with wavelength shifting (WLS) and optical fiber read-out. Phys Med Biol. 2008;53:1829-1842.
10 Karp J, Surti S, Daube-Witherspoon M, et al. Benefit of time-of-flight in PET: experimental and clinical results. J Nucl Med. 2008;49:462-470.
11 Nehmeh SA, Erdi YE, Pan T, et al. Quantitation of respiratory motion during 4D-PET/CT acquisition. Med Phys. 2004;31:1333-1338.
12 Li T, Thorndyke B, Schreibmann E, et al. Model-based image reconstruction for four-dimensional PET. Med Phys. 2006;33:1288-1298.
13 Bar-Shalom R, Yefremov N, Guralnik L, et al. Clinical performance of PET/CT in evaluation of cancer: additional value for diagnostic imaging and patient management. J Nucl Med. 2003;44:1200-1209.
14 Miller TR, Wallis JW. Clinically important characteristics of maximum-likelihood reconstruction. J Nucl Med. 1992;33:1678-1684.
15 Hudson HM, Larkin RS. Accelerated image reconstruction using ordered subsets of projection data. IEEE Trans Med Imag. 1994;13:601-609.
16 Daube-Witherspoon M, Matej S, Karp JS, et al. Applications of the 3D row action maximum likelihood algorithm to clinical PET imaging. IEEE Trans Nucl Sci. 2001;48:24-30.
17 Fowler JS, Ido T. Initial and subsequent approach for the synthesis of 18FDG. Sem Nucl Med. 2002;32:6-12.
18 Pelicano H, Martin DS, Xu RH, et al. Glycolysis inhibition for anticancer treatment. Oncogene. 2006;25:4633-4646.
19 Barthel H, Cleij M, Collingridge DR, et al. 3′-Deoxy-3′-[18F] fluorothymidine as a new marker for monitoring tumor response to antiproliferative therapy in vivo with positron emission tomography. Cancer Res. 2003;63:3791-3798.
20 Buck A, Halter G, Schirrmeister H, et al. Imaging proliferation in lung tumors with PET: 18F-FLT versus 18F-FDG. J Nucl Med. 2003;44:1426-1431.
21 Chapman JD, Engelhardt EL, Stobbe CC, et al. Measuring hypoxia and predicting tumor radioresistance with nuclear medicine assays. Radiother Oncol. 1998;46:229-237.
22 Rasey JS, Wui-Jin K, Evans ML, et al. Quantifying regional hypoxia in human tumors with positron emission tomography of [18F]fluoromisonidazole: a pretherapy study of 37 patients. Int J Radiat Oncol Biol. 1996;36:417-428.
23 Reischl G, Ehrlichmann W, Bieg C, et al. Preparation of the hypoxia imaging PET tracer [18F]FAZA: reaction parameters and automation. Appl Radiat Isot. 2005;62:897-901.
24 Grosu A, Souvatzoglou M, Roper B, et al. Hypoxia imaging with FAZA-PET and theoretical considerations with regard to dose painting for individualization of radiotherapy in patients with head and neck cancer. Int J Radiat Oncol Biol Phys. 2007;69:541-551.
25 Evans SM, Jenkins WT, Joiner B, et al. 2-Nitroimidazole (EF5) binding predicts radiation resistance in individual 9L s.c. tumors. Cancer Res. 1996;56:405-411.
26 Komar G, Seppanen M, Eskola O, et al. 18F-EF5: A new PET tracer for imaging hypoxia in head and neck cancer. J Nucl Med. 2008;49:1944-1951.
27 Dehdashti F, Grigsby PW, Mintun MA, et al. Assessing tumor hypoxia in cervical cancer by positron emission tomography with 60Cu-ATSM: relationship to therapeutic response-a preliminary report. Int J Radiat Oncol Biol Phys. 2003;55:1233-1238.
28 Dehdashti F, Mintun MA, Lewis JS, et al. In vivo assessment of tumor hypoxia in lung cancer with 60Cu-ATSM. Eur J Nucl Med Mole Imag. 2003;30:844-850.
29 Beer AJ, Haubner R, Sarbia M, et al. Positron emission tomography using [18F]Galacto-RGD identifies the level of integrin alpha(v)beta3 expression in man. Clin Cancer Res. 2006;12:3942-3949.
30 Li ZB, Cai W, Cao Q, et al. (64)Cu-labeled tetrameric and octameric RGD peptides for small-animal PET of tumor alpha(v)beta(3) integrin expression. J Nucl Med. 2007;48:1162-1171.
31 Wu AM, Olafsen T. Antibodies for molecular imaging of cancer. Cancer J. 2008;14:191-197.
32 Schwaiger M, Muzik O. Assessment of myocardial perfusion by positron emission tomography. Am J Cardiol. 1991;67:35D-43D.
33 Bruehlmeier M, Roelcke U, Schubiger PA, et al. Assessment of hypoxia and perfusion in human brain tumors using PET with 18F-fluoromisonidazole and 15O-H2O. J Nucl Med. 2004;45:1851-1859.
34 Gupta N, Saleem A, Kotz B, et al. Carbogen and nicotinamide increase blood flow and 5-fluorouracil delivery but not 5-fluorouracil retention in colorectal cancer metastases in patients. Clin Cancer Res. 2006;12:3115-3123.
35 Hahn EL. Spin Echoes. Phys Rev. 1950;80:580-594.
36 Moyher SE, Vigneron DB, Nelson SJ. Surface coil MR imaging of the human brain with an analytic reception profile correction. J Mag Reson Imag. 1995;5:139-144.
37 Frahm J, Bruhn H, Gyngell ML, et al. Localized high-resolution proton NMR spectroscopy using stimulated echoes: initial applications to human brain in vivo. Mag Reson Med. 1989;9:79-93.
38 Bottomley PA. Spatial localization in NMR spectroscopy in vivo. Ann N Y Acad Sci. 1987;508:333-348.
39 Haase A, Frahm J, Hänicke W, et al. 1H NMR chemical shift selective imaging. Phys Med Biol. 1985;30:341-344.
40 Star-Lack J, Vigneron DB, Pauly J, et al. Improved solvent suppression and increased spatial excitation bandwidths for three-dimensional PRESS CSI using phase-compensating spectral/spatial spin-echo pulses. J Mag Reson Imag. 1997;7:745-757.
41 Adalsteinsson E, Irarrazabal P, Spielman DM, et al. Three-dimensional spectroscopic imaging with time-varying gradients. Mag Reson Med. 1995;33:461-466.
42 Nelson SJ. Analysis of volume MRI and MR spectroscopic imaging data for the evaluation of patients with brain tumors. Mag Reson Med. 2001;46:228-239.
43 Opstad KS, Ladroue C, Bell BA, et al. Linear discriminant analysis of brain tumour 1H MR spectra: a comparison of classification using whole spectra versus metabolite quantification. NMR Biomed. 2007;20:763-770.
44 Laudadio T, Pels P, De Lathauwer L, et al. Tissue segmentation and classification of MRSI data using canonical correlation analysis. Mag Reson Med. 2005;54:1519-1529.
45 Herminghaus S, Dierks T, Pilatus U, et al. Determination of histopathological tumor grade in neuroepithelial brain tumors by using spectral pattern analysis of in vivo spectroscopic data. J Neurosurg. 2003;98:74-81.
46 Bakken IJ, Axelson D, Kvistad KA, et al. Classification of in vivo 1H MR spectra from breast tissue using artificial neural networks. Anticancer Res. 2001;21:1481-1485.
47 Poptani H, Kaartinen J, Gupta RK, et al. Diagnostic assessment of brain tumours and non-neoplastic brain disorders in vivo using proton nuclear magnetic resonance spectroscopy and artificial neural networks. J Cancer Res Clin Oncol. 1999;125:343-349.
48 Hagberg G. From magnetic resonance spectroscopy to classification of tumors. A review of pattern recognition methods. NMR Biomed. 1998;11:148-156.
49 McKnight TR, Noworolski SM, Vigneron DB, et al. An automated technique for the quantitative assessment of 3D-MRSI data from patients with glioma. J Mag Reson Imag. 2001;13:167-177.
50 Frahm J, Bruhn H, Gyngell L, et al. Localized proton NMR spectroscopy in different regions of the human brain in vivo. Relaxation times and concentrations of cerebral metabolites. Mag Reson Med. 1989;11:47-63.
51 Michaelis T, Merboldt KD, Bruhn H, et al. Absolute concentrations of metabolites in the adult human brain in vivo: quantification of localized proton MR spectra. Radiology. 1993;187:219-227.
52 Bruhn H, Frahm J, Gyngell ML, et al. Noninvasive differentiation of tumors with use of localized H-1 MR spectroscopy in vivo: initial experience in patients with cerebral tumors. Radiology. 1989;172:541-548.
53 Demaerel P, Johannik K, Van Hecke P, et al. Localized 1H NMR spectroscopy in fifty cases of newly diagnosed intracranial tumors. J Comput Assist Tomogr. 1991;15:67-76.
54 Fulham MJ, Bizzi A, Dietz MJ, et al. Mapping of brain tumor metabolites with proton MR spectroscopic imaging: clinical relevance. Radiology. 1992;185:675-686.
55 Kinoshita Y, Kajiwara H, Yokota A, et al. Proton magnetic resonance spectroscopy of brain tumors: an in vitro study. Neurosurgery. 1994;35:606-613.
56 Negendank W, Sauter R. Intratumoral lipids in 1H MRS in vivo in brain tumors: experience of the Siemens Cooperative Clinical Trial. Anticancer Res. 1996;16:1533-1538.
57 Nelson SJ, Huhn S, Vigneron DB, et al. Volume MRI and MRSI techniques for the quantitation of treatment response in brain tumors: presentation of a detailed case study. J Mag Reson Imag. 1997;7:1146-1152.
58 Nelson SJ, Vigneron DB, Dillon WP. Serial evaluation of patients with brain tumors using volume MRI and 3D 1H MRSI. NMR Biomed. 1999;12:123-138.
59 Vigneron DB, Nelson SJ, Kurhanewicz J. Proton chemical shift imaging of cancer. In: Higgins CB, Hricak H, Helms CA, editors. Magnetic resonance imaging of the body. ed 3. New York: Lippincott-Raven Press; 1997:205-220.
60 Kugel H, Heindel W, Ernestus RI, et al. Human brain tumors: spectral patterns detected with localized H-1 MR spectroscopy. Radiology. 1992;183:701-709.
61 Miller BL, Chang L, Booth R, et al. In vivo 1H MRS choline: correlation with in vitro chemistry/histology. Life Sci. 1996;58:1929-1935.
62 Bruhn H, Frahm J, Gyngell ML, et al. Cerebral metabolism in man after acute stroke: new observations using localized proton NMR spectroscopy. Mag Reson Med. 1989;9:126-131.
63 Koller KJ, Zaczek R, Coyle JT. N-acetyl-aspartyl-glutamate: regional levels in rat brain and the effects of brain lesions as determined by a new HPLC method. J Neurochem. 1984;43:1136-1142.
64 Simmons ML, Frondoza CG, Coyle JT. Immunocytochemical localization of N-acetyl aspartate with monoclonal antibodies. Neuroscience. 1991;45:37-45.
65 Kuesel AC, Sutherland GR, Halliday W, et al. 1H MRS of high grade astrocytomas: mobile lipid accumulation in necrotic tissue. NMR Biomed. 1994;7:149-155.
66 Ugurbil K, Adriany G, Andersen P, et al. Ultrahigh field magnetic resonance imaging and spectroscopy. Mag Reson Imag. 2003;21:1263-1281.
67 Kurhanewicz J, Swanson MG, Nelson SJ, et al. Combined magnetic resonance imaging and spectroscopic imaging approach to molecular imaging of prostate cancer. J Mag Reson Imag. 2002;16:451-463.
68 Shukla-Dave A, Hricak H, Moskowitz C, et al. Detection of prostate cancer with MR spectroscopic imaging: an expanded paradigm incorporating polyamines. Radiology. 2007;245:499-506.
69 Hu J, Yu Y, Kou Z, et al. A high spatial resolution 1H magnetic resonance spectroscopic imaging technique for breast cancer with a short echo time. Mag Reson Imag. 2008;26:360-366.
70 Gould MK, Maclean CC, Kuschner WG, et al. Accuracy of positron emission tomography for diagnosis of pulmonary nodules and mass lesions: a meta-analysis. J Am Med Assoc. 2001;285:914-924.
71 Gould MK, Kuschner WG, Rydzak CE, et al. Test performance of positron emission tomography and computed tomography for mediastinal staging in patients with non-small-cell lung cancer: a meta-analysis. Ann Intern Med. 2003;139:879-892.
72 Kumar R, Xiu Y, Yu JQ, et al. 18F-FDG PET in evaluation of adrenal lesions in patients with lung cancer. J Nucl Med. 2004;45:2058-2062.
73 Crippa F, Leutner M, Belli F, et al. Which kinds of lymph node metastases can FDG PET detect? A clinical study in melanoma. J Nucl Med. 2000;41:1491-1494.
74 Wagner JD, Schauwecker D, Davidson D, et al. Inefficacy of F-18 fluorodeoxy-D-glucose-positron emission tomography scans for initial evaluation in early-stage cutaneous melanoma. Cancer. 2005;104:570-579.
75 Friedman KP, Wahl RL. Clinical use of positron emission tomography in the management of cutaneous melanoma. Semin Nucl Med. 2004;34:242-253.
76 Bastiaannet E, Oyen WJ, Meijer S, et al. Impact of [18F]fluorodeoxyglucose positron emission tomography on surgical management of melanoma patients. Br J Surg. 2006;93:243-249.
77 Quon A, Gambhir SS. FDG-PET and beyond: molecular breast cancer imaging. J Clin Oncol. 2005;23:1664-1673.
78 Fehr MK, Hornung R, Varga Z, et al. Axillary staging using positron emission tomography in breast cancer patients qualifying for sentinel lymph node biopsy. Breast J. 2004;10:89-93.
79 Rieber A, Schirrmeister H, Gabelmann A, et al. Pre-operative staging of invasive breast cancer with MR mammography and/or PET: boon or bunk? Br J Radiol. 2002;75:789-798.
80 Buscombe JR, Holloway B, Roche N, et al. Position of nuclear medicine modalities in the diagnostic work-up of breast cancer. Q J Nucl Med Mol Imaging. 2004;48:109-118.
81 Byrne AM, Hill AD, Skehan SJ, et al. Positron emission tomography in the staging and management of breast cancer. Br J Surg. 2004;91:1398-1409.
82 Zangheri B, Messa C, Picchio M, et al. PET/CT and breast cancer. Eur J Nucl Med Mol Imaging. 2004;31(Suppl 1):S135-S142.
83 Esserman L. Integration of imaging in the management of breast cancer. J Clin Oncol. 2005;23:1601-1602.
84 Isasi CR, Moadel RM, Blaufox MD. A meta-analysis of FDG-PET for the evaluation of breast cancer recurrence and metastases. Breast Cancer Res Treat. 2005;90:105-112.
85 Jacobs MA, Barker PB, Bottomley PA. Proton magnetic resonance spectroscopic imaging of human breast cancer: a preliminary study. J Mag Reson Imag. 2004;19:68-75.
86 Bartella L, Huang W. Proton 1H MR spectroscopy of the breast. Radiographics. 2007;27:S241-S252.
87 Levine EA, Farmer MR, Clark P, et al. Predictive value of 18-fluoro-deoxy-glucose-positron emission tomography (18F-FDG-PET) in the identification of responders to chemoradiation therapy for the treatment of locally advanced esophageal cancer. Ann Surg. 2006;243:472-478.
88 Rasanen JV, Sihvo EI, Knuuti MJ, et al. Prospective analysis of accuracy of positron emission tomography, computed tomography, and endoscopic ultrasonography in staging of adenocarcinoma of the esophagus and the esophagogastric junction. Ann Surg Oncol. 2003;10:954-960.
89 Wallace MB, Nietert PJ, Earle C, et al. An analysis of multiple staging management strategies for carcinoma of the esophagus: computed tomography, endoscopic ultrasound, positron emission tomography, and thoracoscopy/laparoscopy. Ann Thorac Surg. 2002;74:1026-1032.
90 Friedland S, Soetikno R, Carlisle M, et al. 18-Fluorodeoxyglucose positron emission tomography has limited sensitivity for colonic adenoma and early stage colon cancer. Gastrointest Endosc. 2005;61:395-400.
91 Jeong HS, Baek CH, Son YI, et al. Use of integrated 18F-FDG PET/CT to improve the accuracy of initial cervical nodal evaluation in patients with head and neck squamous cell carcinoma. Head Neck. 2007;29:203-210.
92 Joensuu H, Ahonen A. Imaging of metastases of thyroid carcinoma with fluorine-18 fluorodeoxyglucose. J Nucl Med. 1987;28:910-914.
93 Dietlein M, Scheidhauer K, Voth E, et al. Fluorine-18 fluorodeoxyglucose positron emission tomography and iodine-131 whole-body scintigraphy in the follow-up of differentiated thyroid cancer. Eur J Nucl Med. 1997;24:1342-1348.
94 Jadvar H, McDougall IR, Segall GM. Evaluation of suspected recurrent papillary thyroid carcinoma with [18F]fluorodeoxyglucose positron emission tomography. Nucl Med Commun. 1998;19:547-554.
95 Conti PS, Durski JM, Bacqai F, et al. Imaging of locally recurrent and metastatic thyroid cancer with positron emission tomography. Thyroid. 1999;9:797-804.
96 Grunwald F, Kalicke T, Feine U, et al. Fluorine-18 fluorodeoxyglucose positron emission tomography in thyroid cancer: results of a multicentre study. Eur J Nucl Med. 1999;26:1547-1552.
97 Wang W, Macapinlac H, Larson SM, et al. [18F]-2-fluoro-2-deoxy-D-glucose positron emission tomography localizes residual thyroid cancer in patients with negative diagnostic (131)I whole body scans and elevated serum thyroglobulin levels. J Clin Endocrinol Metab. 1999;84:2291-2302.
98 Alnafisi NS, Driedger AA, Coates G, et al. FDG PET of recurrent or metastatic 131I-negative papillary thyroid carcinoma. J Nucl Med. 2000;41:1010-1015.
99 McDougall IR, Davidson J, Segall GM. Positron emission tomography of the thyroid, with an emphasis on thyroid cancer. Nucl Med Commun. 2001;22:485-492.
100 Schluter B, Bohuslavizki KH, Beyer W, et al. Impact of FDG PET on patients with differentiated thyroid cancer who present with elevated thyroglobulin and negative 131I scan. J Nucl Med. 2001;42:71-76.
101 Iagaru A, Masamed R, Singer PA, et al. 2-Deoxy-2-[18F]fluoro-D-glucose-positron emission tomography and positron emission tomography/computed tomography diagnosis of patients with recurrent papillary thyroid cancer. Mol Imaging Biol. 2006;8:309-314.
102 Stokkel MP, Duchateau CS, Dragoiescu C. The value of FDG-PET in the follow-up of differentiated thyroid cancer: a review of the literature. Q J Nucl Med Mol Imaging. 2006;50:78-87.
103 Tatsumi M, Cohade C, Nakamoto Y, et al. Direct comparison of FDG PET and CT findings in patients with lymphoma: initial experience. Radiology. 2005;237:1038-1045.
104 La Fougere C, Hundt W, Brockel N, et al. Value of PET/CT versus PET and CT performed as separate investigations in patients with Hodgkin’s disease and non-Hodgkin’s lymphoma. Eur J Nucl Med Mol Imaging. 2006;33:1417-1425.
105 Kazama T, Faria SC, Varavithya V, et al. FDG PET in the evaluation of treatment for lymphoma: clinical usefulness and pitfalls. Radiographics. 2005;25:191-207.
106 Taylor JS, Langston JW, Reddick WE, et al. Clinical value of proton magnetic resonance spectroscopy for differentiating recurrent or residual brain tumor from delayed cerebral necrosis. Int J Radiat Oncol Biol Phys. 1996;36:1251-1261.
107 Kamada K, Houkin K, Abe H, et al. Differentiation of cerebral radiation necrosis from tumor recurrence by proton magnetic resonance spectroscopy. Neurol Med Chir. 1997;37:250-256.
108 Alger JR, Frank JA, Bizzi A, et al. Metabolism of human gliomas: assessment with H-1 MR spectroscopy and F-18 fluorodeoxyglucose PET. Radiology. 1990;177:633-641.
109 Pirzkall A, Nelson SJ, Mcknight T, et al. Metabolic imaging of low-grade gliomas with three-dimensional magnetic resonance spectroscopy. Int J Radiat Oncol Biol Phys. 2002;53:1254-1264.
110 Möller-Hartmann W, Herminghaus S, Krings T, et al. Clinical application of proton magnetic resonance spectroscopy in the diagnosis of intracranial mass lesions. Neuroradiology. 2002;44:371-381.
111 Murphy M, Loosemore A, Clifton AG, et al. The contribution of 1H MRS to clinical brain tumour diagnosis. Br J Neurosurg. 2002;16:329-334.
112 Scheidler J, Hricak H, Vigneron DB, et al. Prostate cancer: localization with three-dimensional proton MR spectroscopic imaging-clinicopathologic study. Radiology. 1999;213:473-480.
113 Wefer AE, Hricak H, Vigneron DB, et al. Sextant localization of prostate cancer: comparison of sextant biopsy, magnetic resonance imaging and magnetic resonance spectroscopic imaging with step section histology. J Urol. 2000;164:400-404.
114 Bartolozzi C, Menchi I, Lencioni R, et al. Local staging of prostate carcinoma with endorectal coil MRI: correlation with whole-mount radical prostatectomy specimens. Euro Radiol. 1996;6:339-345.
115 Caldwell CB, Mah K, Ung YC, et al. Observer variation in contouring gross tumor volume in patients with poorly defined non-small-cell lung tumors on CT: The impact of 18FDG-hybrid PET fusion. Int J Radiat Oncol Biol Phys. 2001;51:923-931.
116 Fox JL, Rengan R, O’Meara W, et al. Does registration of PET and planning CT images decrease interobserver and intraobserver variation in delineating tumor volumes for non-small-cell lung cancer? Int J Radiat Oncol Biol Phys. 2005;62:70-75.
117 Patel DA, Chang ST, Goodman KA, et al. Impact of integrated PET/CT on variability of target volume delineation in rectal cancer. Technol Cancer Res Treat. 2007;6:31-36.
118 Berson AM, Stein NF, Riegel AC, et al. Variability of gross tumor volume delineation in head-and-neck cancer using PET/CT fusion, Part II: the impact of a contouring protocol. Med Dosim. 2009;34:30-35.
119 Mac Manus M, Wong K, Hicks R, et al. Early mortality after radical radiotherapy for non-small cell lung cancer: comparison of PET-staged and conventionally staged cohorts treated at a large tertiary referral center. Int J Radiat Oncol Biol Phys. 2002;52:351-361.
120 Mac Manus M, Hicks RJ. The use of positron emission tomography (PET) in the staging/evaluation, treatment, and follow-up of patients with lung cancer: a critical review. Int J Radiat Oncol Biol Phys. 2008;72:1298-1306.
121 De Ruysscher D, Wanders S, van Haren E, et al. Selective mediastinal node irradiation based on FDG-PET scan data in patients with non-small-cell lung cancer: a prospective clinical study. Int J Radiat Oncol Biol Phys. 2005;62:988-994.
122 Klopp AH, Chang JY, Tucker SL, et al. Intrathoracic patterns of failure for non-small-cell lung cancer with positron-emission tomography/computed tomography-defined target delineation. Int J Radiat Oncol Biol Phys. 2007;69:1409-1416.
123 Sura S, Greco C, Gelblum D, et al. (18)F-fluorodeoxyglucose positron emission tomography-based assessment of local failure patterns in non-small-cell lung cancer treated with definitive radiotherapy. Int J Radiat Oncol Biol Phys. 2008;70:1397-1402.
124 Soto DE, Kessler ML, Piert M, et al. Correlation between pretreatment FDG-PET biological target volume and anatomical location of failure after radiation therapy for head and neck cancers. Radiother Oncol. 2008;89:13-18.
125 Graves EE, Pirzkall A, Nelson SJ, et al. Registration of magnetic resonance spectroscopic imaging to computed tomography for radiotherapy treatment planning. Med Phys. 2001;28:2489-2496.
126 Graves EE, Nelson SJ, Vigneron DB, et al. A preliminary study of the prognostic value of proton magnetic resonance spectroscopic imaging in gamma knife radiosurgery of recurrent malignant gliomas. Neurosurgery. 2000;46:319-328.
127 Pirzkall A, McKnight TR, Graves EE, et al. MR-spectroscopy guided target delineation for high-grade gliomas. Int J Radiat Oncol Biol Phys. 2001;50:915-928.
128 Park I, Tamai G, Lee MC, et al. Patterns of recurrence analysis in newly diagnosed glioblastoma multiforme after three-dimensional conformal radiation therapy with respect to pre-radiation therapy magnetic resonance spectroscopic findings. Int J Radiat Oncol Biol Phys. 2007;69:381-389.
129 Nelson SJ, Graves E, Pirzkall A, et al. In vivo molecular imaging for planning radiation therapy of gliomas: an application of 1H MRSI. J Mag Reson Imag. 2002;16:464-476.
130 Zaider M, Zelefsky MJ, Lee EK, et al. Treatment planning for prostate implants using magnetic-resonance spectroscopy imaging. Int J Radiat Oncol Biol Phys. 2000;47:1085-1096.
131 Pouliot J, Kim Y, Lessard E, et al. Inverse planning for HDR prostate brachytherapy used to boost dominant intraprostatic lesions defined by magnetic resonance spectroscopy imaging. Int J Radiat Oncol Biol Phys. 2004;59:1196-1207.
132 McKenna DA, Coakley FV, Westphalen AC, et al. Prostate cancer: role of pretreatment MR in predicting outcome after external-beam radiation therapy—initial experience. Radiology. 2008;247:141-146.
133 Pickett B, Vigneault E, Kurhanewicz J, et al. Static field intensity modulation to treat a dominant intra-prostatic lesion to 90 Gy compared to a seven field 3-dimensional radiotherapy. Int J Radiat Oncol Biol Phys. 1999;44:921-929.
134 Xia P, Pickett B, Vigneault E, et al. Forward or inversely planned segmental multileaf collimator IMRT and sequential tomotherapy to treat multiple dominant intraprostatic lesions of prostate cancer to 90 Gy. Int J Radiat Oncol Biol Phys. 2001;51:244-254.
135 Van Lin EN, Futterer JJ, Heijmink SW, et al. IMRT boost dose planning on dominant intraprostatic lesions: gold marker-based three dimensional fusion of CT with dynamic contrast-enhanced and 1H-spectroscopic MRI. Int J Radiat Oncol Biol Phys. 2006;65:291-303.
136 Eschmann SM, Friedel G, Paulsen F, et al. 18F-FDG PET for assessment of therapy response and preoperative re-evaluation after neoadjuvant radio-chemotherapy in stage III non-small cell lung cancer. Eur J Nucl Med Mol Imaging. 2007;34:463-471.
137 Chang CN, Olson M, Weerasuriya DK, et al: Mid-radiation FDG-PET is a prognostic factor for disease progression in patients with NSCLC. In RSNA 94th Annual Meeting, Chicago, IL, 2008.
138 Iagaru A, Quon A, Johnson D, et al. 2-Deoxy-2-[F-18]fluoro-D-glucose positron emission tomography/computed tomography in the management of melanoma. Mol Imaging Biol. 2007;9:50-57.
139 Hathaway PB, Mankoff DA, Maravilla KR, et al. Value of combined FDG PET and MR imaging in the evaluation of suspected recurrent local-regional breast cancer: preliminary experience. Radiology. 1999;210:807-814.
140 Offodile RS, Daniel BL, Jeffrey SS, et al. Magnetic resonance imaging of suspicious breast masses seen on one mammographic view. Breast J. 2004;10:416-422.
141 Wiener JI, Schilling KJ, Adami C, et al. Assessment of suspected breast cancer by MRI: a prospective clinical trial using a combined kinetic and morphologic analysis. AJR Am J Roentgenol. 2005;184:878-886.
142 Yeh E, Slanetz P, Kopans DB, et al. Prospective comparison of mammography, sonography, and MRI in patients undergoing neoadjuvant chemotherapy for palpable breast cancer. AJR Am J Roentgenol. 2005;184:868-877.
143 Goerres GW, Michel SC, Fehr MK, et al. Follow-up of women with breast cancer: comparison between MRI and FDG PET. Eur Radiol. 2003;13:1635-1644.
144 Walter C, Scheidhauer K, Scharl A, et al. Clinical and diagnostic value of preoperative MR mammography and FDG-PET in suspicious breast lesions. Eur Radiol. 2003;13:1651-1656.
145 Kumar R, Loving VA, Chauhan A, et al. Potential of dual-time-point imaging to improve breast cancer diagnosis with (18)F-FDG PET. J Nucl Med. 2005;46:1819-1824.
146 Brucher BL, Weber W, Bauer M, et al. Neoadjuvant therapy of esophageal squamous cell carcinoma: response evaluation by positron emission tomography. Ann Surg. 2001;233:300-309.
147 Kim JH, Czernin J, Allen-Auerbach MS, et al. Comparison between 18F-FDG PET, in-line PET/CT, and software fusion for restaging of recurrent colorectal cancer. J Nucl Med. 2005;46:587-595.
148 Votrubova J, Belohlavek O, Jaruskova M, et al. The role of FDG-PET/CT in the detection of recurrent colorectal cancer. Eur J Nucl Med Mol Imaging. 2006;33:779-784.
149 Selzner M, Hany TF, Wildbrett P, et al. Does the novel PET/CT imaging modality impact on the treatment of patients with metastatic colorectal cancer of the liver? Ann Surg. 2004;240:1027-1034.
150 Choi MY, Lee KM, Chung JK, et al. Correlation between serum CEA level and metabolic volume as determined by FDG PET in postoperative patients with recurrent colorectal cancer. Ann Nucl Med. 2005;19:123-129.
151 Capirci C, Rubello D, Chierichetti F, et al. Long-term prognostic value of 18F-FDG PET in patients with locally advanced rectal cancer previously treated with neoadjuvant radiochemotherapy. AJR Am J Roentgenol. 2006;187:W202-208.
152 Veit P, Antoch G, Stergar H, et al. Detection of residual tumor after radiofrequency ablation of liver metastasis with dual-modality PET/CT: initial results. Eur Radiol. 2006;16:80-87.
153 Ware RE, Matthews JP, Hicks RJ, et al. Usefulness of fluorine-18 fluorodeoxyglucose positron emission tomography in patients with a residual structural abnormality after definitive treatment for squamous cell carcinoma of the head and neck. Head Neck. 2004;26:1008-1017.
154 Wald L, Nelson SJ, Day MR, et al. Serial proton magnetic resonance spectroscopy imaging of glioblastoma multiforme after brachytherapy. J Neurosurg. 1997;87:525-534.
155 Graves EE, Nelson SJ, Vigneron DB, et al. Serial proton magnetic resonance spectroscopic imaging of recurrent malignant gliomas after Gamma knife radiosurgery. Am J Neuroradiol. 2001;22:613-624.
156 Alexander A, Murtha A, Abdulkarim B, et al. Prognostic significance of serial magnetic resonance spectroscopies over the course of radiation therapy for patients with malignant glioma. Clin Invest Med. 2006;29:301-311.
157 Lee MC, Pirzkall A, McKnight TR, et al. 1H-MRSI of radiation effects in normal-appearing white matter: dose-dependence and impact on automated spectral classification. J Mag Reson Imag. 2004;19:379-388.
158 Pickett B, Kurhanewicz J, Coakley F, et al. Use of MRI and spectroscopy in evaluation of external beam radiotherapy for prostate cancer. Int J Radiat Oncol Biol Phys. 2004;60:1047-1055.
159 Pickett B, Ten Haken RK, Kurhanewicz J, et al. Time to metabolic atrophy after permanent prostate seed implantation based on magnetic resonance spectroscopic imaging. Int J Radiat Oncol Biol Phys. 2004;60:1047-1055.
160 Ling C, Humm J, Larson S, et al. Towards multidimensional radiotherapy (MD-CRT): biological imaging and biological conformality. Int J Radiat Oncol Biol Phys. 2000;47:551-560.
161 McQuade P, Rowland DJ, Lewis JS, et al. Positron-emitting isotopes produced on biomedical cyclotrons. Curr Med Chem. 2005;12:807-818.
[/level-membership-for-hematology-oncology-and-palliative-medicine-category][not-level-membership-for-hematology-oncology-and-palliative-medicine-category]
9 Molecular Imaging and PET/CT
Molecular Imaging in Radiation Oncology
Noninvasive biologic imaging has been developed and enhanced for more than a half century since the first medical ultrasonic measurement in 1954,1 the invention of a clinical x-ray computed tomography (CT) scanner in 1972,2 and the acquisition of the first magnetic resonance image (MRI) in 1973.3 These methods have evolved to offer high imaging performance in terms of scanning time, spatial resolution, and image quality, and now are commonplace in medical settings. In general, the source of contrast in these imaging modalities is gross tissue anatomy or structure. For example, x-ray CT differentiates tissues on the basis of their density and x-ray absorption, which vary greatly between bone, air, and water but minimally between different soft tissue types. MRI detects differences in proton density and magnetic relaxation, which can vary substantially between soft tissues. Many of these properties have only tangential relationships to the physiologic or functional aspects of the tissue being imaged, however. A tumor may be difficult to localize on CT because its absorption properties are not significantly different than the tissue from which it arose. This shortcoming of conventional anatomic imaging prompted the development of molecular imaging, loosely defined as the noninvasive detection, localization, and quantitation of specific molecular entities or physiologic processes in a living organism.
Positron Emission Tomography
Basic Physics
PET is an imaging modality derived from the unique physics of radioactive decay of positron-emitting radionuclides. Such non-natural isotopes, including 11C, 13N, 18F, 64Cu, and 124I (Table 9-1), are unstable and decay through the conversion of a proton within the nucleus into a neutron, a neutrino, and a positron that is subsequently emitted from the atom. This decay process reduces the atomic number of the atom by 1 and ejects the positron from the nucleus. The emitted positron has a mean travel distance, dependent on the medium and its energy, in the range of 1 to 10 mm. After traveling some distance, the positron annihilates with its opposite particle the electron, and their energy is converted into two “annihilation” photons of 511 keV emitted in opposite directions.
To detect and localize such events, PET devices were developed as arrays of detectors that can convert the high-energy photons into optical photons through scintillation crystals, such as bismuth germanate and lutetium oxyorthosilicate, and subsequently into electrical pulses using photomultiplier tubes. Unlike similar devices for single-photon emission computed tomography that must rely on physical collimators to restrict the field of view of each detector to a defined spatial volume, PET scanners operate on the principle of coincidence detection. Because each positron emission event results in two photons traveling at 180 degrees to each other, PET detector arrays are designed to identify pairs of detectors that report events within a short (typically 6-20 nanoseconds) window of each other. These pairs of events are termed coincidence events. A typical PET acquisition involves the measurement of millions of coincidence events from a subject containing a distribution of a positron-emitting compound. This detection strategy is demonstrated in Figure 9-1. The concept of PET scanning was conceived in the late 1950s and early 1960s,4 resulting in the advent of a clinically useful scanning device in the early 1970s.5,6 Modern clinical PET scanners achieve spatial resolutions of 4 to 6 mm, with sensitivities in units of counts per second for a 1 µCi point source at the center of the scanner of 200 to 2000.7
The performance of modern PET scanners is dictated by a number of factors. To conserve momentum in the positron-electron annihilation, the directions of travel of the annihilation photons are not perfectly collinear, with the divergence from collinearity approximately 1 degree or less. This slight noncollinearity between the emitted photons limits the resolution of PET, becoming more severe with increasing detector bore sizes. In addition, thick scintillator crystals are typically used in detectors to increase their photon-stopping ability. However, the thickness of the crystal can cause uncertainties in localizing events, particularly for detector pairs whose joining lines are at oblique angles to the detector face (such as detector pairs on the same side of the circular array). This causes a loss in spatial resolution for regions of the image away from the center of the scanner. Emerging “depth of interaction” detector technology has been developed to estimate where within a crystal an event occurred to mitigate this effect.8,9 Scattered photons detected by the PET scanner as well as random coincidences occurring when photons from two separate positron events are recorded as a coincidence affect both the quantitative ability of PET as well as the spatial characteristics of resulting images. Strategies for random coincidence corrections and scatter rejection have been developed to combat these phenomena, and are discussed in the Image Reconstruction and Analysis section.
A recent achievement in PET scanner design has been the realization of time-of-flight (TOF) PET systems. From the inception of PET, engineers have striven to construct detectors with temporal responses fast enough to not only identify coincidence photons measured on separate detectors, but also to quantify the time lag between the arrival of each of the coincidence photons. This time can then be used to calculate where along the line connecting the two detectors the positron event occurred, increasing the quality of reconstructed PET images. One vendor now has a TOF PET-CT system available, the performance of which has been favorably compared with conventional PET scanners.10 In addition, combination of PET imaging technology with respiratory monitoring devices has resulted in the acquisition of motion-resolved, four-dimensional (4-D) PET data sets using methods analogous to 4-D CT.11,12
Integration With Computed Tomography
The principal advantage of PET/CT is the ability to interpret the PET images in the context of the anatomic reference provided by a high-spatial-resolution CT data set. This has been shown clinically to enhance the diagnostic interpretation of these data beyond that possible through consideration of the PET or CT in isolation.13 However, the integration of PET and CT has yielded other benefits as well. A key technical improvement afforded by PET/CT is the ability to correct the PET data for photon absorption within the subject, using the CT image to estimate the anticipated photon attenuation along the line joining each detector pair. Whereas attenuation correction was previously performed in standalone PET scanners using transmission images acquired with the PET detectors using a rotating rod source, the high signal-to-noise ratio and spatial resolution of CT images has significantly enhanced the performance of this correction. Furthermore, the development of hybrid PET/CT scanners has accelerated the inclusion of PET data in radiation treatment planning because it is possible using these devices to acquire coregistered PET data at the time of CT simulation.
Image Reconstruction and Analysis
The traditional method of reconstruction for PET data has been the filtered backprojection technique, analogous to that used in x-ray CT. This method involves filtering the projection data using a ramp filter in the frequency domain, and uniformly distributing each filtered projection along the projection direction. This “backprojection,” when applied to a complete tomographic data set, then gives a reconstructed image. The sensitivity of this algorithm to high-frequency noise necessitates further filtering at the cost of spatial resolution. More computationally expensive iterative reconstruction techniques have evolved to address the shortcomings of analytic backprojection methods. In general, these methods operate through successive adjustments of the reconstructed parameter distribution, which is then subjected to a forward projection operator producing the corresponding expected measured data set that can be compared directly with the experimentally measured data. This strategy allows modeling of the acquisition process and can account for attenuation, scatter, noise, and other experimental factors. Examples of reconstruction methods of this type now in commercial use include maximum-likelihood expectation maximization,14 ordered-subset expectation maximization,15 and row-action maximization-likelihood16 algorithms. Following reconstruction of the data into spatial images, a system calibration factor determined from quality assurance procedures is then applied to convert the images from units of counts per second into units of activity per unit volume (µCi/mL).
Positron Emission Tomography Radiotracers
The prevalent radiotracer in use in PET imaging is 2-deoxy-2-18F-FDG. FDG is an analog of glucose in which the hydroxy group typically found in the second position of the six-member ring has been replaced with 18F.17 Originally developed as an anticancer agent, 2-deoxyglucose (2DG) was designed to be cytotoxic to tumor cells that depend on glycolysis for energy production.18 This compound is taken up into cells by glucose transporters, and undergoes phosphorylation by hexokinase in the first step of glycolysis. However, because of the absence of the 2-hydroxyl group, the molecule cannot be further metabolized, and because at this stage the molecule has been phosphorylated and acquired a charge, it cannot easily cross the cell membrane and be cleared. This “trapping” of FDG within glycolytically active cells therefore generates a PET signal that can be imaged. Although 2DG as a cancer therapeutic has suffered largely because of the large doses required to out-compete endogenous glucose and the normal tissue toxicities thereby incurred, FDG has proven successful as a PET radiotracer because the trace doses administered avoid toxicity and because the uptake of this compound by tumors can be as much as 20 times that of surrounding normal tissue. A typical clinical dose for human imaging is up to 15 mCi of FDG at a specific activity of greater than 200 mCi/µmol, corresponding to a maximum mass dose of FDG of 75 nmol.
Although FDG PET now has proven clinical applications in a variety of oncologic sites, it has several shortcomings. Observation of elevated FDG uptake on a PET scan of a cancer patient could be associated with (1) increased tumor mass or cellularity, (2) upregulation of glucose transporters, (3) upregulation of hexokinase, (4) inflammatory responses, or (5) muscle activity. Therefore, although FDG PET can provide valuable clinical information, there have been subsequent efforts to develop more specific PET radiotracers that can report on specific aspects of an individual patient’s cancer and more fully characterize it so as to select and monitor the most effective course of treatment. 18F-fluorothymidine (FLT) is a thymidine analog that is taken up into cells and phosphorylated by thymidine kinases, resulting in a trapping similar to that of FDG.19 Although FLT is not incorporated into deoxyribonucleic acid, the association of thymidine kinase activity with S-phase cells suggests that FLT uptake gives a measure of cellular proliferation. FLT PET images acquired from human lung tumors have been correlated with proliferation measured using Ki-67 immunohistochemistry.20
An area of PET tracer development with great relevance to radiation oncology is that of agents targeting hypoxic cells. A number of compounds employing the “cellular trapping” localization scheme have been synthesized and evaluated for their ability to accumulate in cells lacking oxygen. A number of these are based on 2-nitroimidazole–containing groups, which are reduced by cellular reductase enzymes to reactive species that bind covalently to intracellular macromolecules and are thus trapped. These reduction reactions can be reversed by molecular oxygen, resulting in radiotracer trapping occurring primarily in hypoxic cells.21 Radiotracers of this type that have been evaluated in the clinic include 18F-fluoromisonidazole,22 18F-fluoroazomycin arabinoside,23,24 and 2-(2-nitro-1H-imidazol-1-yl)-N-(2,2,3,3,3-pentafluoropropyl)-actamide (18F-EF5).25,26 64Cu-Diacetyl-bis (N4-methylthiosemicarbazone) (64Cu-ATSM) is another hypoxia-selective PET radiotracer, employing a longer-lived 64Cu radionuclide label, which employs bioreductive pathways causing the molecule to become charged to induce intracellular trapping.27,28
In addition to radiotracers that become trapped within cells, a second class of PET agents are those that bind to specific proteins expressed on the surface of cells. Radiotracers of this type are common in neurologic studies of neuronal receptors; however, this localization method has frequently been applied to oncologic imaging as well. An emerging radiotracer of this type is arginine-glycine-aspartic acid peptides labeled with 18F or 64Cu. These compounds have been shown to bind to αςβ3 integrins expressed on endothelial cells of angiogenic vessels, allowing imaging of the molecular aspects of angiogenesis using PET.29,30 In addition to small molecule probes, labeled antibodies against a variety of targets have been developed as PET radiotracers,31 providing a mechanism for translating antibodies developed for molecular biology applications into imaging agents. A key design constraint for receptor-binding PET radiotracers is that they must have high specific activity so as to avoid competition for binding sites between labeled (detectable) and unlabeled (undetectable) probe molecules within the radiotracer formulation.
A final class of PET radiotracers deserving mention are those that are used to measure vascular perfusion, such as 13N-NH3 and 15O-H2O. The short half-lives of these compounds as well as their biodistributions limit their use in PET experiments to short time frames after injection. Commonly, dynamic images are acquired rapidly after injection and fit to compartmental models to extract estimates of vascular volume or perfusion from the measured time-activity data.32–34
Magnetic Resonance Spectroscopy
Basic Physics
Magnetic resonance pulse sequences used for the acquisition of spectroscopic data began with the simplest “pulse and measure” technique in which a 90-degree excitation pulse is applied to a sample under a strong static magnetic field, and the resulting free induction decay signal is recorded using an inductive coil. More sophisticated spin echo sequences employing a subsequent 180-degree refocusing pulse35 were developed to avoid signal losses caused by field inhomogeneities and other static disturbances characterized by the relaxation rate T2*. To apply MRS to living subjects, a number of further technical issues must be resolved. Although it is feasible to obtain a homogeneous sample of a chemical for NMR analysis, for in vivo subjects, a mechanism of restricting the imaging volume is required. In the most straightforward sense, this can be achieved by using acquisition hardware with a limited sensitive volume. Surface coils have been applied in this regard as their transmission and reception sensitivity is very high near the coil aperture but falls off quickly.36 More flexible methods have been developed to select volumes for spectroscopic measurement through software rather than hardware. This can be done in a manner identical to that done for slice selection in MRI, through the marriage of excitation pulses with a well-defined bandwidth and linear magnetic field gradients applied along a specific spatial dimension. Biologic spectroscopy acquisitions can apply three sequential selective excitations to excite orthogonal planes of spins, resulting in the final selection of a rectangular volume of interest. This technique can be implemented using either three 90-degree pulses, termed stimulated echo acquisition mode (STEAM),37 or by one 90-degree and two refocusing 180-degree pulses, termed point resolved spectroscopy (PRESS).38 PRESS is unable to achieve the short echo times (TEs) of STEAM because it uses multiple refocusing pulses, but it has the advantage of being a true spin echo technique and therefore insensitive to T2* signal losses.
In addition to the problem of suppressing signals from spins outside the volume of interest, in vivo MRS also faces the difficulty of removing signals from spins present in compounds other than those of biochemical interest. The largest of these is water, which is present in biologic tissues in molar concentrations and is several orders of magnitude more abundant than the metabolites of interest. Such an overwhelming signal can dominate the dynamic range of an MR system and prevent accurate quantitation of other less intense spin resonances. Strategies for suppressing the water signal from spectroscopic acquisitions focus on either destroying the coherent magnetization produced by water protons or on excluding the resonance frequency of water protons from the bandwidth of the excitation pulse. The former technique has been achieved through use of chemical shift selective saturation (CHESS) pulses, which consist of a 90-degree excitation pulse, specific to the resonance frequency of water protons, followed by a strong dephasing gradient pulse.39 CHESS methods can be expanded to other potentially unwanted resonances such as lipid by modification of the pulse bandwidth or inclusion of additional CHESS pulses prior to measurement. The alternate approach, that of excluding the unwanted resonances from the bandwidth of the excitation pulses, can be achieved using frequency-selective techniques analogous to those described for STEAM and PRESS. However, the difficulty of simultaneously selecting both a restricted spatial volume (in conjunction with magnetic field gradients) and a restricted spectral range using a single pulse is apparent. This problem has been solved through the development of spectral-spatial selective pulses that incorporate complex varying gradient and pulse waveforms.40
Although single-voxel spectroscopic acquisitions remain useful for a variety of diagnostic purposes, application of MRS in radiation oncology has been contingent on the development of methods for imaging spectroscopic signals. This goal is complicated by the dependence of spin resonance frequency and hence chemical shift information on the applied magnetic field, which prevents the use of frequency-encoding readout gradients like those used in MRI. The simplest solution to this problem is to apply a series of phase-encoding gradients along the spatial axes prior to the acquisition of an echo, and to step the intensities of these gradients so as to map out frequency space, or “k space,” to the desired extent and resolution. This procedure, termed chemical shift imaging (CSI) or magnetic resonance spectroscopic imaging (MRSI), has been applied to acquire MR spectra from two- and three-dimensional (3-D) grids of voxels. The time required for such acquisitions is given by the number of acquired voxels multiplied by the repetition time of the sequence. Faster spectroscopic imaging solutions have been pursued by applying time-varying gradients during readout and deconvolving the contribution of these gradients from the measured spectroscopic information during reconstruction,41 in an approach similar to that of echo-planar MRI. This technique, termed fast or spiral CSI, can reduce the acquisition time required for spectroscopic imaging at the expense of more pronounced susceptibility and aliasing artifacts also encountered with echo-planar MRI.
Image Reconstruction and Analysis
The raw data obtained from a spectroscopic acquisition must first be processed, corrected, and reconstructed. Spectroscopic imaging data must first be Fourier transformed along each phase encoding direction to separate the data into spatial voxels. Because of the nature of the frequency domain acquisition of MRSI data, the relatively coarse voxels can be retrospectively positioned and reconstructed within the excitation volume by multiplying the acquired data array by a complex exponential. This data is then Fourier transformed to generate a frequency spectrum, which is then subjected to a variety of corrections for spectral frequency and baseline and peak phase.42 When this reconstruction and correction procedure has been completed, the peaks of interest within the acquired spectra may then be identified and peak parameters (height, area, width) calculated.
A general difficulty in interpreting MRS relative to other molecular imaging modalities is that the measured data includes both spatial dimensions as well as a spectral, frequency dimension. A variety of classification techniques have been reported for discriminating normal from neoplastic tissues on the basis of spectroscopic information.43–49 Of these, the work of McKnight and colleagues is particularly relevant to radiation oncology because it condenses the data contained in a spectrum into a single metric, or alternately translates a 4-D MRSI data set into a 3-D volume image more immediately familiar to modern radiologists and clinicians. This is accomplished for brain MRSI data by performing a regression analysis using the choline and N-acetyl aspartate (NAA) levels calculated for all voxels in an MRSI data set, and classifying each spectrum based on the distance its choline and NAA levels lie from the regression line calculated for an automatically selected population of “normal” spectra. This distance is called the z score or abnormality index, and serves as a measure of the deviation between a voxel’s spectrum and that of normal tissue.
Site Restrictions
Several phenomena limit the application of MRSI methods to several well-suited anatomic sites. First, the tissue of interest must contain a metabolic or molecular signature that makes it worthwhile to investigate with spectroscopy. To be detected by in vivo MRS, a metabolite must be present in appreciable concentrations to produce a detectable signal. In general, this requirement necessitates millimolar concentrations for the spin groups of interest.50,51 Furthermore, the transverse relaxation time (T2) of the spin population must be sufficiently long relative to the TE used in the acquisition sequence to avoid complete relaxation of the magnetization before signal measurement. This precludes detection of macromolecules or compounds that are tethered to large complexes, such as membrane-associated molecules. Finally, the peaks of interest must be adequately removed from other peaks present in the spectrum so that they can be independently resolved and quantified. In addition, the macroscopic structure of the tissue must be amenable to the acquisition of high-quality spectroscopic data. This mandates that it be of relatively homogeneous magnetic susceptibility. In addition, because of the relatively long duration of MRS acquisitions, the tissue should not be subject to excessive motion.
The brain is particularly suited for interrogation with 1H MRS techniques. It is a relatively static organ and is largely free of air–tissue interfaces that can introduce difficulties in producing a constant magnetic field across it. A long TE spin echo acquisition sequence can detect five basic types of metabolites in the brain: choline-containing compounds, creatine, NAA, lactate, and mobile lipids, as shown in Figure 9-2. Choline levels in glioma are generally increased relative to normal cerebrum52–59 reflecting altered membrane phospholipid metabolism54,59,60 or increased cellularity in neoplastic tissue.54,59–61 High-grade (World Health Organization grade 4) gliomas do not show the same magnitude of choline elevation as lower grade gliomas; this is thought to be related to the micronecrotic nature of these lesions.54 The appearance of the MRS creatine peak in brain neoplasms appears to be inversely correlated to tumor grade, with grade 4 lesions demonstrating the most reduced creatine levels relative to normal tissue.60 NAA has been shown to be localized in neuronal cells,62–64 allowing its use as an MRS marker of viable neurons. Dramatic reductions in the MRS NAA signal are observed in studies of gliomas, which are indicative of the death of neurons as they are encroached upon by the invading neoplasm, or the displacement of neuronal tissue by tumor-related mass effects.52–59 The ability to simultaneously observe both a tumor-associated resonance (choline) as well as a marker associated with normal tissue (NAA) enhances the diagnostic ability of MRS. Lactate and lipid protons both resonate in the 1.0 to 1.5 ppm range. Lactate, the end product of anaerobic glycolysis, has a controversial status in clinical brain MRS; some have associated its presence with poor clinical outcome indicative of tumor hypoxia,60 whereas others have noted that lactate accumulation is nonspecific and can be either an intrinsic property of the tumor or an effect of treatment-induced ischemia.54 Lipid signals in brain MRS can either come from spectral contamination from subcutaneous fatty tissues included in the MRS volume, or from micronecrosis and cellular breakdown present in high-grade or post-treatment lesions.56,65 Lipid resonances may be an indicator of membrane breakdown and necrosis, potentially reflective of the necrotic nature of glioblastoma multiforme. Increasing magnetic field strength and decreasing echo times and spatial resolutions have facilitated the detection of an increased number of metabolites from brain tissue, including glutamine, glutamate, taurine, inositol, and aspartate.66
The use of transmission and reception coils inserted into the rectum has allowed the acquisition of high signal-to-noise ratio MRI and MRS data from the prostate. Long-echo MRS studies of the prostate allow quantitation of choline, creatine, and citrate as demonstrated in Figure 9-3. As in brain MRS, choline is a marker of altered neoplastic membrane metabolism, and the MRS peak it generates can similarly be used as a biomarker of cancer.67 A peak containing contributions from polyamine compounds including spermine and spermidine is found at 3.1 ppm, but its detection can be complicated by broad line widths and by its proximity to the choline and creatine peaks, especially at 1.5 T. Decreased polyamine levels have been associated with malignant prostate cancer.68 However, the principal marker of normal prostate metabolism in spectroscopic measurements is citrate, present in the MR spectrum as a quartet centered at 2.6 ppm. Citrate is produced, accumulated, and secreted by normal epithelial cells within the gland. During the process of malignant transformation, prostatic cells become dedifferentiated and correspondingly lose their capacity for citrate production and secretion. This results in levels of MRS-visible citrate being reduced in neoplastic tissue relative to normal tissue.
Several groups have attempted to study breast cancer using spectroscopic methods. The problems of water and lipid suppression are exacerbated when measuring within the breast; however, improved techniques have proven adequate for the robust detection of relative choline levels across the breast.69 However, in breast spectroscopy there is no easily detectable normal marker to play the role that NAA does in brain MRS and citrate does in prostate MRS.
