[level-membership-for-hematology-oncology-and-palliative-medicine-category]
Chapter 8 Molecular and cytogenetic analysis
Introduction to the analysis of DNA
The ability to manipulate DNA as recombinant molecules followed from the discovery of bacterial DNA-modifying enzymes that allowed genes to be isolated as cloned recombinant DNA molecules and their DNA to be sequenced. The sequence of the human genome is now complete (see: www.ornl.gov/sci/techresources/Human_Genome/project/timeline.shtml).1,2 It has become extensively annotated and is accessible through a number of genome browsers. The ability to amplify specific DNA fragments from small amounts of starting material using the polymerase chain reaction (PCR)3 is now the cornerstone of most routine DNA analysis. Because this technique is relatively simple, rapid, inexpensive and requires only some basic pieces of laboratory equipment, it has made molecular genetic analysis readily accessible in many laboratories.
Guidelines from the American Association for Molecular Pathology address the choice and development of appropriate diagnostic assays, quality control and validation and implementation of molecular diagnostic tests.4 In the UK, a national external quality assessment scheme has been approved for the molecular genetics of thrombophilia and pilot studies are currently in progress for the molecular diagnosis of haematological malignancies and for haemophilia A. It is true, however, that the development and implementation of quality control methods and assurance standards still lag behind the rapid rate of expansion of molecular techniques.5,6 To overcome this, both at national and international level, several groups are attempting to reach a standardization of molecular methodologies applied to fusion gene quantification (BCR–ABL1, PML–RARA, etc.) in myeloid malignancies as well as the molecular monitoring of residual disease using antigen receptor targets in acute and chronic lymphoid malignancies.
Polymerase chain reaction
Development of the PCR3 has had a dramatic impact on the study and analysis of nucleic acids. Through the use of a thermostable DNA polymerase, Taq polymerase (available from various suppliers, including Applied Biosystems, Warrington and Thermo-Fisher, Runcorn) extracted from the bacterium Thermus aquaticus, the PCR results in the amplification of a specific DNA fragment such that it can be visualized using intercalating SYBR Safe (Invitrogen, Paisley) added to agarose gels. Ethidium bromide, a carcinogenic product, is no longer in use for safety reasons. The procedure takes only a few hours and requires only a very small amount of starting material.
Principle
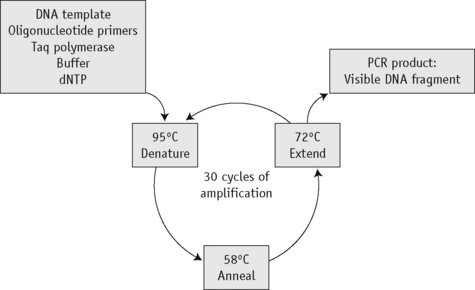
The first step of the reaction is to denature the DNA, generating single-stranded templates, by heating the reaction mixture to 95°C. The reaction is then cooled to a temperature, usually between 50°C and 68°C, that permits the annealing of the primers to the DNA template but only at their specific complementary sequences. The temperature is then raised to 72°C, at which temperature the Taq polymerase efficiently synthesizes DNA, extending from the primers in a 5′ to 3′ direction. Cyclical repetition of the denaturing, annealing and extension steps, by simply changing the temperature of the reaction in an automated heating block, results in exponential amplification of the DNA that lies between the two primers (Fig. 8.1).
Reagents
Method
Optimal conditions for the reaction have to be derived empirically, with the magnesium concentration and annealing temperature being the most important parameters.7 The choice of buffer depends on the enzyme being used and the company will usually supply the most appropriate one. For genes with a high GC content, buffer II in combination with 10% DMSO may give better amplification. In most cases, a 25 μl reaction volume suffices. A blank control should always be included (i.e. a reaction without any template) to control for contamination. If the blank control yields a product, the analysis is invalid. A DNA sample that is known to amplify can also be included and this sample may then be used as a normal or positive control.
| Stock solution | Volume (μl) | Final concentration |
|---|---|---|
| ×10 PCR buffer III | 50 | ×1 |
| 25 mmol/l MgCl2 | 40 | 2.0 mmol/l |
| 10 mmol/l dNTP | 10 | 0.02 mmol/l |
| 10 μmol/l Primer (1) | 20 | 0.04 μmol/l |
| 10 μmol/l Primer (2) | 20 | 0.04 μmol/l |
| 5 u/μl Taq polymerase | 2 | 0.02 μ/ml |
| Water | 358 | |
| Final volume | 500 |
Add the Taq polymerase last, mix well and pulse-spin in a microcentrifuge to bring down the contents of the tube.
Modifications and Developments
Analysis of polymerase chain reaction products
Presence or Absence of a Polymerase Chain Reaction Product
Amplification Refractory Mutation System
Principle
Point mutations and small insertions or deletions can be identified directly by the presence or absence of a PCR product using allele-specific primers.8,9 Two different oligos are used that differ only at the site of the mutation (the amplification refractory mutation system or ARMS, primers) with the mismatch distinguishing the normal and mutant base located at the 3′ end of the oligo. In a PCR, an oligo with a mismatch at its 3′ end will fail to prime the extension step of the reaction. Each test sample is amplified in two separate reactions containing either a mutant ARMS primer or a normal ARMS primer. The mutant primer will prime amplification together with one common primer from DNA with this mutation but not from a normal DNA. A normal primer will do the opposite. To increase the instability of the 3′ end mismatch and so ensure the failure of the amplification, it is sometimes necessary to introduce a second nucleotide mismatch three or four bases from the 3′ end of both oligos. A second pair of unrelated primers at a distance from the ARMS primers is included in each reaction as an internal control to demonstrate that efficient amplification has occurred. This is essential because a failure of the ARMS primer to amplify is interpreted as a significant result and must not be the result of suboptimal reaction conditions.
Gap-PCR
Large deletions can be detected by Gap-PCR. Primers located 5′ and 3′ to the breakpoints of a deletion will anneal too far apart on the normal chromosome to generate a fragment in a standard PCR. When the deletion is present, the sites at which these primers anneal will be brought together, enabling them to give rise to a product. An example of this is given for the detection of deletions in α° thalassaemia in Figure 8.4 on p. 149.
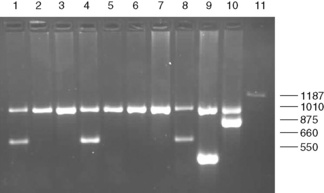
Figure 8.4 Detection of α° thalassaemia by multiplex Gap-PCR. The sequences of the primers used are shown in Table 8.1. A normal fragment of 1010 bp is generated by the primers α/SEA(F) and α/(R) in all lanes (although this is very faint in lane 11). In addition, a fragment of 660 bp is generated by the primer pair α/SEA(F) and SEA(R) in lanes 1, 4 and 8 in individuals who are heterozygous for the − −SEA deletion; a fragment of 550 bp is generated by the primer pair FIL(F) and FIL(R) in lane 9 in an individual who is heterozygous for the − −FIL deletion; a fragment of 875 bp is generated by the primer pair MED(F) and MED(R) in lane 10 in an individual who is heterozygous for the − −MED deletion; and a fragment of 1187 bp is generated by the primer pair 20.5(F) and 20.5(R) in lane 10 in an individual who is heterozygous for the −α20.5 deletion.
By the same principle, the sites at which primers anneal can be brought together by chromosomal translocation, giving rise to a diagnostic product. Breakpoints may be clustered over too large a region for genomic DNA to be used in these instances. However, leukaemic translocations can also give rise to transcribed fusion genes. Primer annealing sites in different genes are then juxtaposed in a hybrid messenger RNA (mRNA) molecule and can give rise to a reverse transcription-PCR (RT-PCR) product. Examples of this are given for the analysis of minimal residual disease in chronic myelogenous leukaemia (CML) in Figure 8.8 on p. 155.
Restriction Enzyme Digestion
Principle
Restriction enzymes (RE) cleave DNA at short specific sequences. Because many RE are available, it is not uncommon for a single point mutation to coincidentally create or destroy an RE recognition sequence. If this is the case, digestion of the appropriate PCR product prior to agarose gel electrophoresis enables the mutation to be identified. A difference in the size of the restriction fragments seen in normal and mutant samples can be predicted from a restriction map of the amplified fragment and the site of the mutation that changes a restriction site. The observed fragments should be consistent with either the mutant or the normal pattern. An example is shown in Figure 8.2 on p. 147 in the diagnosis of the sickle cell mutation.

Reagents
Method
Allele-Specific Oligonucleotide Hybridization
Principle
Under appropriate conditions, short oligonucleotide probes will hybridize to their exact complementary sequence but not to a sequence in which there is even a single base mismatch.10 A pair of oligos is therefore used to test for the presence of a point mutation: a mutant oligo complementary to the mutant sequence and a normal oligo complementary to the normal sequence, with the sequence difference placed near the centre of each oligo.
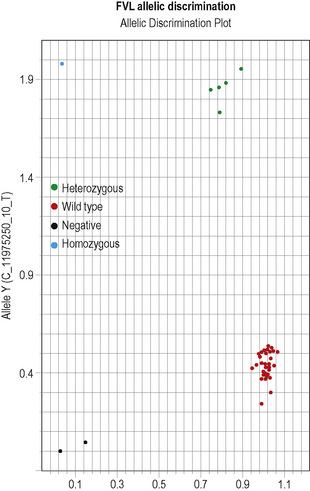
This methodology has been widely applied for the detection of point mutations using fluorescently labelled TaqMan probes that distinguish the two alleles. Two short allele-specific probes are used, one of which will hybridize only to the wild-type allele and one of which will hybridize only to the mutant allele. Each probe is labelled with a different fluorescent colour, which is quenched while the probe remains intact, but is released if and when the probe hybridizes to its perfectly complementary sequence during the PCR reaction, as it will then be broken up by the exonuclease activity of the Taq polymerase. An example of this analysis is the detection of the factor V Leiden mutation in Figure 8.5 on p. 150.
Interpretation
Other non-radioactive probes, with detection systems involving horseradish peroxidase, have also been quite widely used in this procedure.11 The technique has also been modified such that the allele-specific oligonucleotides are immobilized onto nylon membranes and the patient-specific PCR product is used as the probe–the reverse dot blot procedure.12 This allows for several different mutations to be analysed simultaneously and has proved particularly useful in the diagnosis of β thalassaemia mutations.13
DNA Sequencing
Reagents
Method
Interpretation
Reading the DNA sequence from a good trace – known as an electrophoretogram – is completely straightforward: As are called as green peaks; Ts as red; Cs as blue; and Gs as black. Free software packages, such as Chromas (at: http://chromas-lite-version.fyxm.net/), are available for viewing these traces and will call the DNA sequence in the file. Simple alignment of this sequence to the GenBank reference sequence can be performed at the National Center for Bioinformatics (NCBI) using the Blast program (at: http://blast.ncbi.nlm.nih.gov/Blast.cgi?CMD=Web&PAGE_TYPE=BlastHome) and will identify any sequence changes. Heterozygous point mutations will be seen as double peaks, with two colours overlaid. Small heterozygous insertions or deletions (indels) are harder to decipher, as the sequence 3′ of the mutation will be a double sequence, with the normal and indel allele superimposed on one another: the extent of the indel can be defined by subtracting from the expected normal sequence.
Investigation of haemoglobinopathies
Sickle Cell Disease
The presence of a sickle cell gene can be determined by haemoglobin cellulose acetate electrophoresis or a sickling test. However, there are occasions when it is beneficial to make this diagnosis by DNA analysis (e.g. in prenatal diagnosis, which can be performed at 10 weeks of pregnancy, in distinguishing HbS/S from HbS/β° thalassaemia or in confirming the diagnosis of sickle cell anaemia in a neonate). For the type of specimens collected for prenatal diagnosis, refer to p. 330.
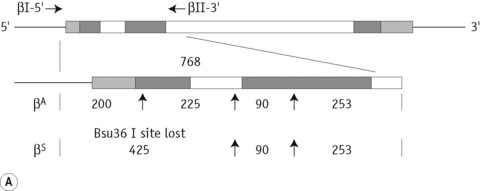
The sickle cell mutation in codon 6 of the β globin gene (GAG → GTG) results in the loss of a Bsu36 I (or Mst II, Sau I, OxaN I or Dde I) restriction enzyme site that is present in the normal gene. It is therefore possible to detect the mutation directly by restriction enzyme analysis of a DNA fragment generated by the PCR. A pair of primers are used to amplify exons 1 and 2 of the β globin gene and the products of the PCR are digested with Bsu36 I. The loss of a Bsu36 I site in the sickle cell gene gives rise to an abnormally large restriction fragment that is not seen in normal individuals (Fig. 8.2).
β Thalassaemia
The ethnic groups with the highest incidence of β thalassaemia are the Mediterranean populations, Asian Indians, Chinese and Africans. Although more than 100 β thalassaemia mutations are known, each of these groups has its own subset of mutations, so that as few as five different mutations may account for more than 90% of the affected individuals in a population. This makes the direct detection of β thalassaemia mutations a reasonable possibility and it has become the method of choice where it is most important: in prenatal diagnosis.13,14
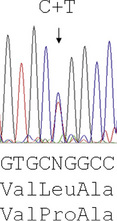
The majority of mutations causing β thalassaemia are point mutations affecting the coding sequence, splice sites or promoter of the β globin gene. Methods for their detection include either ARMS or reverse dot blot analysis, although more commonly now, they are detected by direct DNA sequence analysis. Unstable and other unusual haemoglobins may also cause disease and can also be identified by direct DNA sequence analysis. An example of such a case is shown in Figure 8.3, where a picture of moderate anaemia is seen in the heterozygote due to the highly unstable and electrophoretically silent variant, haemoglobin, Durham, NC.
α Thalassaemia
In contrast to the β thalassaemias, the most common α thalassaemia mutations are deletions. Two categories exist: those that remove only one of the two alpha globin genes on any one chromosome (α+ thalassaemia) and those that remove both of the alpha genes from one chromosome (α° thalassaemia). Although PCR amplification around the alpha globin locus has proved to be rather difficult, the common deletions can now be identified by a reasonably robust Gap-PCR.15 In these reactions dimethylsulphoxide (DMSO) and betaine are added. Two different multiplex PCR reactions are set up, one for the common α+ thalassaemias (−α3.7 and −α4.2) and one for the common α° thalassaemias (− −SEA, − −MED, − −FIL and −α20.5). The fragment generated by these primers across the deletion breakpoint is different in size to a control fragment that is generated from the normal chromosome as a part of the multiplex reaction. The primers that flank the deletion breakpoint are too far apart to generate a fragment from the normal chromosome in the PCR. Only when these are brought closer together as a result of the deletion can a fragment be produced. Primer sequences used in this analysis are given in Table 8.1 and an example of their application in the detection of α thalassaemias is shown in Figure 8.4. More than 30 non-deletional forms of α thalassaemia have been described. Of these, Hb Constant Spring and the αHphIα mutation are relatively common in South-east Asian and Mediterranean populations, respectively. These can be detected by ASOH, ARMS, restriction enzyme digestion or direct sequencing of the appropriate PCR product. Unlike the β thalassaemias, α thalassaemias are not easily diagnosed using routine haematological techniques. The diagnosis of α thalassaemias is often made following exclusion of β thalassaemia and iron deficiency. Because the vast majority of cases of α thalassaemia are of the clinically benign type (i.e. α+ thalassaemia), it is debatable whether molecular analysis is justified to reach a diagnosis in these individuals. However, it is important that individuals with α° thalassaemia are identified and the only definitive diagnostic test is DNA analysis. The α° thalassaemias are almost entirely restricted to at-risk ethnic groups, particularly those of South-east Asian or Mediterranean origin and so it is most efficient to target these groups specifically. The diagnosis of α° thalassaemia is particularly relevant if prenatal diagnosis is to be offered to a couple who are at risk of having a fetus with hydrops, where there is an increased risk of maternal death at delivery. Guidelines derived from the UK experience as to how and when DNA analysis should be implemented have recently been updated.16
Table 8.1 Primers used in Gap-PCR analysis of α-thalassaemia
| Primer name | Sequence, 5′→3′ | Concentration (μmol/l) |
|---|---|---|
| α° | Multiplex PCR | Clark and Thein (2004)14 |
| 20.5(F) | GGGCAAGCTGGTGGTGTTACACAGCAACTC | 0.1 |
| 20.5(R) | CCACGCCCATGCCTGGCACGTTTGCTGAGG | 0.1 |
| α/SEA(F) | CTCTGTGTTCTCAGTATTGGAGGGAAGGAG | 0.3 |
| α(R) | TGAAGAGCCTGCAGGACCAGGTCAGTGACCG | 0.15 |
| MED(F) | CGATGAGAACATAGTGAGCAGAATTGCAGG | 0.15 |
| MED(R) | ACGCCGACGTTGCTGCCCAGCTTCTTCCAC | 0.15 |
| SEA(R) | ATATATGGGTCTGGAAGTGTATCCCTCCCA | 0.15 |
| FIL(F) | AAGAGAATAAACCACCCAATTTTTAAATGGGCA | 1.6 |
| FIL(R) | GAGATAATAACCTTTATCTGCCACATGTAGCAA | 1.6 |
| α+ | Multiplex PCR | From JM Old (pers. comm.) |
| 3.7F | CCCCTCGCCAAGTCCACCC | 0.4 |
| 3.7/20.5R | AAAGCACTCTAGGGTCCAGCG | 0.4 |
| 4.2F | GGTTTACCCATGTGGTGCCTC | 0.6 |
| 4.2R | CCCGTTGGATCTTCTCATTTCCC | 0.8 |
| α2R | AGACCAGGAAGGGCCGGTG | 0.1 |
PCR, polymerase chain reaction.
Disorders of coagulation
Thrombophilia
Considerable advances have been made in our understanding of the genetic risk factors found in patients with venous thromboembolism (VTE).17 Among these are the diverse mutations causing protein C, protein S and antithrombin deficiency. An increased factor VIII level is also a risk factor for VTE, but the genetic determinants of this are unclear. Homozygosity for the common C677T mutation of the methylenetetrahydrofolate reductase gene, which gives rise to a thermolabile variant of this protein, has been reported to be a risk factor for VTE, although other studies have not supported this claim. A point mutation in the 3′ UTR of the prothrombin gene associated with elevated protein levels has been identified as a genetic risk factor for VTE.18 The most common of the known genetic risk factors for VTE is a resistance to the anticoagulant effect of activated protein C caused by the Arg506Gln substitution in factor V (factor V Leiden, FVL);19 around 20% of subjects of north European origin presenting for the first time with thromboembolism are heterozygous for this mutation. Because of their prevalence and because the tests have become relatively simple, there is a tendency toward indiscriminate testing for these genetic risk factors in thrombophilia, but without careful and informed counselling this may often be inappropriate (see also Chapter 19).20
Interpretation
The results can be evaluated using the allelic discrimination plots for the individual genotyping assays. Each data point represents one sample and they can be seen to fall into four clusters according to the genotype of the sample or the absence of the signal in the non-template control (NTC): see Figure 8.5. If the assay has worked, these clusters should be clearly distinct. An automatic genotype annotation is then based on this clustering. Some points will not be automatically called by the software: these data points can be annotated manually by assigning them to the appropriate cluster.
Haemostatic Disorders
Diverse mutations underlie haemophilia A and haemophilia B and these are usually identified in specialized laboratories by screening exons for mutation by single-stranded conformational polymorphism analysis (SSCP), denaturing high-performance liquid chromatography or direct DNA sequence analysis.21 It may still be relevant to determine carrier status and offer prenatal diagnosis through genetic linkage analysis. Problems with this include the number of sporadic cases, lack of informative markers, unavailable family members and the possibility of recombination.
Of particular diagnostic significance is the fact that from between one-third and one-half of all patients with severe haemophilia A have a large genomic inversion mutation involving recombination between a region in intron 22 of the factor VIII gene and telomeric homologous sequences.22 These inversions are readily detected by Southern blot analysis using the p482.6 probe23 to Bcl I digests of genomic DNA. A method has also recently been described using long-distance PCR, enabling identification of these inversion mutations in a single tube reaction (see Chapter 18 for more information on bleeding disorders).24
Leukaemia and lymphoma
Cytogenetic Principles and Terminology
Classical cytogenetic analysis is carried out on cells that have entered mitosis and have been arrested in metaphase so that individual chromosomes can be recognized by their size and their banding pattern following staining (e.g. Giemsa staining [G-banding] or staining with a fluorescent dye). Alternating dark and light bands are numbered from the centromere toward the telomere to facilitate description of any abnormalities detected. An example showing the balanced translocation t(9;22)(q34;q11) in chronic myelogenous leukaemia (CML) is shown in Figure 8.6. The standard terminology applied to chromosomes is shown in Table 8.2.
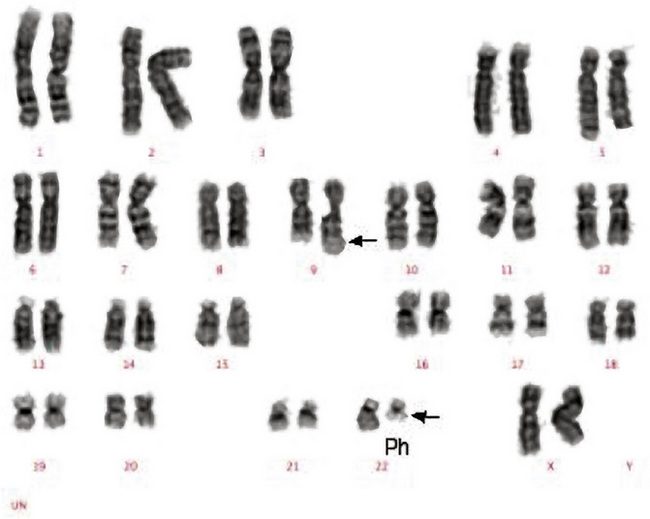
Table 8.2 Terminology and abbreviations used in classical cytogenetic analysis
| Term | Abbreviation | Explanation |
|---|---|---|
| Centromere | cen | The junction of the short and long arms of a chromosome |
| Telomere | ter | The termination of the short or long arm of a chromosome, pter or qter |
| Long arm | q | The longer of the two arms of the chromosome that are joined at the centromere |
| Short arm | p | The shorter of the two arms of the chromosome that are joined at the centromere |
| Diploid | Having the full complement of 46 chromosomes, 44 paired autosomes and two sex chromosomes in a cell or clone | |
| Haploid | Having 23 chromosomes, a single copy of each autosome and either an X or a Y chromosome in a cell or clone | |
| Tetraploid | Having a total of 92 chromosomes, four of each autosome and four sex chromosomes in a cell or clone | |
| Aneuploid | Having a chromosome number that is neither diploid nor a fraction or a multiple of the diploid number, in a cell or clone | |
| Pseudodiploid | Having 46 chromosomes in a cell or clone but with either structural abnormalities or with loss and gain of different chromosomes so that not all chromosomes are paired | |
| Hyperdiploid | The presence of more than 46 chromosomes in a cell or clone | |
| Hypodiploid | The presence of fewer than 46 chromosomes in a cell or clone | |
| Monosomy | − (a minus sign before the chromosome number, e.g. −7) | Loss of one of a pair of chromosomes |
| Trisomy | + (a plus sign before the chromosome number, e.g. +13) | Gain of a chromosome so that there are three rather than two copies |
| Deletion | del or a minus sign after the number and the designation of the arm of a chromosome, e.g. del(20q) or 20q− | Loss of part of the long or the short arm of a chromosome |
| Translocation | t | Movement of a chromosomal segment or segments between two or more chromosomes; a translocation can be reciprocal or non-reciprocal |
| Reciprocal translocation | Exchange of segments between two or more chromosomes | |
| Non-reciprocal translocation | Movement of a segment of a chromosome from one chromosome to another but without reciprocity | |
| Balanced translocation | A translocation that occurs without loss of chromosomal material or at least without loss of sufficient chromosomal material to be detectable by microscopic examination of chromosomes | |
| Unbalanced translocation | A translocation that is associated with gain or loss of part of a chromosome | |
| Inversion | inv | The inversion of a part of a chromosome, either pericentric or paracentric |
| Pericentric inversion | An inversion that follows breaking of both the long and short arms so that the part of the chromosome that is inverted includes the centromere | |
| Paracentric inversion | An inversion that follows the occurrence of two breaks in either the long or the short arm of a chromosome so that the part of the chromosome that is inverted does not include the centromere | |
| Insertion | ins | The insertion of a segment of one chromosome into another chromosome or into a different position on the same chromosomes. Can be direct or inverted |
| Isochromosome | i | A chromosome with two long arms or two short arms joined at the centromere, e.g. i(17q) |
| Derivative | der | A chromosome that is derived from another; a derivative chromosome derived from two or more chromosomes carries the number of the chromosome that contributed the centromere |
| Duplication | dup | The duplication of part of a chromosome |
| Clone | A population of cells derived from a single cell; in cytogenetic analysis a clone is considered to be present if two cells share the same structural abnormality or extra chromosome or if three cells have lost the same chromosome | |
| Marker | mar | An abnormal chromosome of uncertain origin that ‘marks’ a clone |
| Constitutional | c | A chromosomal abnormality that is part of the constitution of an individual rather than being acquired, e.g. +21c in Down syndrome |
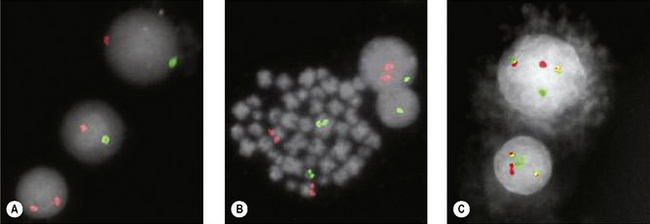
Fluorescence in situ Hybridization
Translocations, Molecular Analysis and Minimal Residual Disease
The Philadelphia (Ph) chromosome (22q−) present in 95% of cases of CML may be identified by routine cytogenetic studies; its presence can be confirmed by demonstrating the presence of the BCR–ABL1 fusion gene by RT-PCR. The Ph chromosome may also be found in 25% and 5% of adult and childhood ALL, respectively,25 where it is associated with relatively poorer prognosis and indicates the need for specific therapy including a tyrosine kinase inhibitor. Patients suspected of having CML should be tested for BCR–ABL1 for definitive diagnosis. Patients with apparent essential thrombocythaemia who do not have a JAK2 mutation should also be tested for BCR–ABL1. To optimize clinical management, patients with ALL should likewise be tested for BCR–ABL1; in adult patients this should be regarded as an essential investigation.
Small cleaved lymphoid cells are observed in a number of conditions with different treatments and prognoses. In such cases, detection of t(11;14) involving CCND1 indicates mantle cell lymphoma, whereas identification of t(14;18) involving BCL2 implies a follicular lymphoma.26 The former is much more aggressive with poor prognosis, thus requiring a more intensive treatment. Translocations associated with lymphomas often lead to the dysregulation of a normal gene: for example t(14;18) places the BCL2 gene adjacent to the IGH locus, leading to dysregulation of BCL2. In contrast, the acute leukaemia-associated translocations often give rise to a chimeric gene that is transcribed: for example t(15;17), which yields a novel PML–RARA fusion gene.27
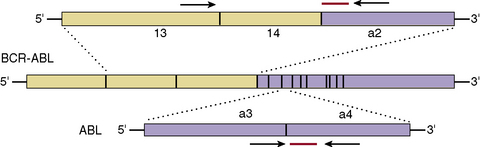
Frequently, the breakpoints within the translocation are too far apart to allow direct amplification of DNA by PCR. In such cases, the mRNA from the fusion gene can be reverse transcribed using RT to yield cDNA, which can then be amplified by PCR. In addition, RT-PCR is an exquisitely sensitive tool that has been exploited in the detection of residual disease.28 We will illustrate this in the analysis of the BCR–ABL1 fusion gene and describe the analysis of other translocations on p. 168.
BCR–ABL1 Reverse Transcriptase-Polymerase Chain Reaction
Principle and Interpretation
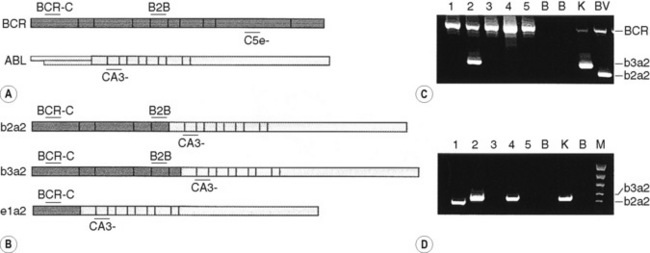
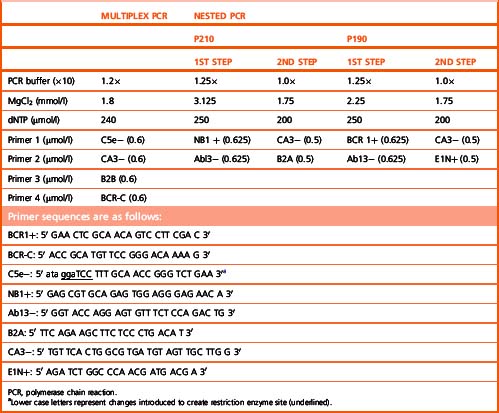
The BCR–ABL1 analysis is performed by two-stage RT-PCR. The RNA extracted from nucleated cells is reverse transcribed by RT to generate coding or cDNA using random primers 6 bp long (hexamers). Following the RT step, the samples are subjected to multiplex PCR, to test for the presence or absence of BCR–ABL1.29 Multiplex PCR is similar to conventional PCR but includes more than one pair of primers in a single PCR test. This strategy enables the detection of the vast majority of the BCR–ABL1 transcripts. The most commonly observed transcripts are b3a2 (e14a2), b2a2 (e13a2) and e1a2, giving rise to 385, 310 and 481 bp amplicons, respectively (Fig. 8.8). However, the identification of fragments of different sizes may be indicative of the presence of a ‘variant fusion gene’ such as e6a2 (1125 bp), e6a3 (951 bp), e8a2 (1319 bp), e8a3 (1145 bp) or e19a2 (908 bp).
If BCR–ABL1 is undetectable by multiplex PCR in follow-up samples from patients undergoing therapy, the cDNA is tested at higher level of sensitivity by nested PCR.30 Nested PCR enables the detection of one leukaemic cell in a background of 105 to 106 normal cells. The choice of primers for nested PCR is dependent on the type of transcript detected by multiplex PCR at presentation. The primers for e14a2 and e13a2 are the same; however, for e1a2 transcript a different set of primers is used. The nested PCR yields fragments of 385 bp (e14a2), 310 bp (e13a2) or 481 bp (e1a2) in length. Nested PCR is not indicated for testing cDNA from a patient suspected of having CML. Diagnosis is made by expression of BCR–ABL1 by multiplex PCR. Furthermore, in post-therapy samples this will indicate molecular relapse.
Reagents
Solutions for the Complementary DNA Mix
The compositions for the multiplex and nested PCR mixes are given in Table 8.3, including the optimum MgCl2 concentration for each mix as well as the primers used in the different PCR reactions.
Methods
Nuclear lysate preparation
RNA extraction
There are several protocols, including commercially available kits, yielding RNA of varying qualities. Qiagen extraction columns are used in our laboratory. The protocol described in the following, originally described by Chomczynski and Sacchi,31 can easily be applied in a clinical laboratory.
cDNA synthesis
Multiplex PCR
Add 2 μl of cDNA to 20 μl of multiplex PCR mix (Table 8.3); add 0.5 u of Taq polymerase. Overlay with 1 drop of mineral oil and amplify using conditions as described in Appendix A. Carry out electrophoresis on the PCR products through 2.0% agarose gel containing SYBR Safe dye.
Nested PCR
Transfer 1 μl of the PCR products from the first-step to 19 μl of the second-step PCR mix (Table 8.3). Overlay with 1 drop of mineral oil and amplify using an annealing temperature of 64°C for 50 s. Then electrophorese the PCR products through 2.0% agarose gel containing SYBR Safe dye. The procedure for nested PCR is the same for both p210 (b3a2 and b2a2) and p190 (e1a2).
Monitoring Minimal Residual Disease
Because the amount of total RNA added to each reverse transcription reaction and its quality (i.e. the degree of degradation) are variable, the transcripts of a housekeeping gene are quantified as an endogenous control. Furthermore, amplification of an endogenous control gene also allows for the inter-sample PCR dynamics variation. There are a number of control genes that can be used as endogenous control genes (e.g. GAPDH, B2M (β2-microglobulin) and ABL1). An endogenous control gene should not be too highly expressed and should show no inter-sample variation in levels of expression; also, there should be no related pseudogenes or alternative splicing.32 The introduction of real-time quantitative reverse transcriptase PCR (qRT-PCR) at the end of the last millennium made quantification of MRD more widely accessible.
Principle
qRT-PCR permits quantification of number of transcripts of gene of interest at high levels of sensitivity. This is achieved by developing a technology that permits the detection of PCR products as they accumulate. Furthermore, the rate of accumulation is proportional to the number of mRNA molecules of the target gene in the starting material during the exponential phase of the PCR. The accumulation of amplicons is detected by including a sequence-specific probe labelled with fluorochromes in addition to the primers as in a conventional PCR (Fig. 8.9). Since the advent of qRT-PCR several types of probes have been developed, although all are dependent on the fluorescence resonance energy transfer (FRET) principle. The two commonly used systems involve hybridization or hydrolysis of the probe. A widely used methodology is TaqMan, which involves hydrolysis of the probe.33 This technology is based on the 5′ exonuclease assay, which exploits the inherent 5′ to 3′ exonuclease activity of the Taq DNA polymerase.34 The Taq DNA polymerase cleaves a dual-labelled probe annealed to the target sequence during PCR amplification (Fig. 8.10A). Briefly, the cDNA synthesized from total RNA is added to the PCR reaction containing standard PCR components plus a probe that anneals to the template between the two primers as per conventional PCR. The probe has a fluorescent reporter dye, FAM, at the 5′-end (6′carboxyfluorescein; emission λmax = 518 nm) and quencher dye, TAMRA, at the 3′-end (6-carboxy-tetramethyl-rhodamine; emission λmax = 582 nm). While the probe is intact, the proximity of the quencher greatly reduces the fluorescence emitted by the reporter dye by Förster resonance energy transfer (FRET).35 Adequate quenching is observed for probes with the reporter dye at the 5′ end and the quencher at the 3′ end.
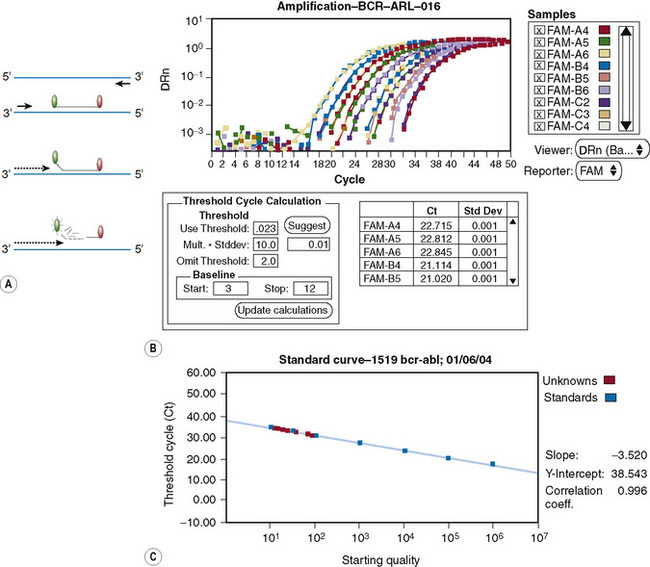
Thus, while TAMRA and FAM are closely attached to the probe, fluorescence from the reporter dye is quenched by TAMRA. During PCR, as the Taq DNA polymerase replicates the DNA strand to which the TaqMan probe is annealed, the probe is degraded by the intrinsic 5′–3′ exonuclease activity of the polymerase. The effect is to dissociate FAM from TAMRA; therefore FRET is no longer applicable and fluorescence from FAM can be detected by a laser integrated in the sequence detector (TaqMan ABI 7500 Real-Time PCR system, Applied Biosystems, Warrington). Fluorescence increases in each cycle, proportional to the rate of probe degradation. The number of cycles taken for the fluorescence to cross a threshold value of 10× the standard deviation of baseline emission is used for quantitative measurement. The threshold is set significantly above the baseline and can be adjusted manually. The upper baseline limit can be altered by the operator. The fluorescence is plotted as ΔRN against number of cycles (Fig. 8.10B), where ΔRN = (Rn+)–(Rn−). The Passive reference, ROX (6-carboxy-X-rhodamine), is included in the qRT-PCR Universal master mix. The formulae used to calculate the Rn+ and Rn− follow:
and from PCR without template or early cycles of PCR:
Interpretation
Patients who achieve complete cytogenetic remission may still harbour up to 1 × 10¹⁰ leukaemic cells. The kinetics of the leukaemic load in these patients and their response to therapeutic agents can only be monitored by measuring MRD.36 However, it should be noted that patients in whom qRT-PCR fails to detect BCR–ABL1 may still harbour up to 1 × 10⁶ leukaemic cells. Of those who are in complete cytogenetic remission (BCR–ABL1/ABL1) × 100 is invariably <2.0%. Investigators previously reported that patients who achieve (BCR–ABL1/ABL1) × 100 <0.045% while receiving α-interferon therapy have a considerably reduced risk of cytogenetic relapse.37 More recently, qRT-PCR has been used to monitor patients being treated with imatinib. An international multicentre study showed that a 3 log reduction in BCR–ABL1 copies was consistent with a good prognosis.38 Quantification of BCR–ABL1 also helps to identify patients at risk of relapse and therefore provides a window for early clinical intervention with the aim of reversing disease progression. For patients who have undergone stem cell transplantation (SCT) this generally means infusion of lymphocytes isolated from the original donor (i.e. adoptive immunotherapy). Although there is some debate as to the precise criteria for molecular relapse, there is little doubt that a confirmed 1 log increase in BCR–ABL1 transcripts is clinically significant (i.e. from 0.002% to 0.02%). Patients who achieve a 0.02% BCR–ABL1/ABL1 ratio on three consecutive occasions are said to be in molecular relapse.
Advantages of qRT-PCR
The major advantage of qRT-PCR is the ability to detect accumulation of amplicons during the exponential phase of PCR. This permits quantification of the DNA of interest in the starting material. This is not possible with conventional PCR because samples are analysed at the end of the PCR run and therefore any differences in the copy number between samples in the starting material are generally not discernible. This is illustrated by the amplification plot shown in Figure 8.10B, where all the samples at the end of 50 cycles have the same level of fluorescence, despite having varying target copy numbers in the starting material as seen in the exponential phase of the PCR. Post-PCR handling is eliminated. On completion of an assay, the sealed microtitre plate is discarded, thereby minimizing risk of contamination. This also eliminates the need to handle stained gels on completion of the qRT-PCR assay. The qRT-PCR offers a higher level of specificity because, in addition to primers annealing to DNA sequence of interest, a third oligonucleotide (the probe) anneals to the region between the primers at a higher temperature. To achieve a level of sensitivity that is similar to qRT-PCR, nested conventional PCR is required, but this is associated with a greater risk of contamination. Conventional PCR is also less amenable to automation. More importantly, because qRT-PCR can be automated, inter-laboratory standardization becomes feasible when measuring patients’ responses to therapy. This permits rapid evaluation of new therapeutic modalities because methodology and protocols can be standardized, permitting international inter-laboratory studies.
With the aim of administrating an optimum dose it is critical to ensure negligible inter-laboratory variation as patients move from one place to another. This would also assist in simplifying multicentre therapeutic agent clinical trials as best illustrated by International Normalized Ratio (INR) for prothrombin time, used to monitor patients whose coagulation status is controlled with the anticoagulant warfarin. There have been efforts to establish a single internationally recognized scale for monitoring CML patients and this may be soon achieved by the establishment of a calibrated and accredited primary reference reagent for BCR–ABL1 q-PCR assays.39
Method
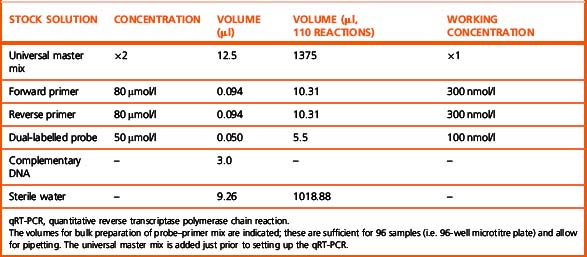
The qRT-PCR assay is normally performed in 96-well microtitre plates in a 25 μl final reaction volume containing universal master mix. The composition of a 25 μl qRT-PCR reaction is shown in Table 8.4.
Notes
To minimize sampling error, the target gene and the standards are assayed in triplicate. It is essential to include positive controls with a known number of transcripts. To minimize risk of contamination the patients’ samples and standards should be handled in geographically separate locations. Because qRT-PCR assays are BCR–ABL1 transcript-type specific it is essential to perform a multiplex PCR on a presentation sample to assign the transcript type expressed by the patient. This ensures that correct qRT-PCR assay is used. A qRT-PCR assay designed for b2a2 or b3a2, now referred to as e13a2 and e14a2, respectively, would give rise to false-negative data in patients expressing e13a3 and/or e14a3. A single qRT-PCR for e13a2 and e14a2 is recommended rather than two separate assays for e13a2 and e14a2. This is achieved by designing the assay such that the probe and reverse primer map to the second exon (i.e. a2) of the ABL1 gene and the forward primer maps to the e13 exon (i.e. b2) of the BCR gene (Fig. 8.9). Apart from being cost-effective and efficient, it increases the accuracy of the assay because a significant minority of patients with a single nucleotide polymorphism in exon 13 of the BCR gene have the potential to express both e13a2 and e14a2.
The Lymphoproliferative Disorders
The majority of lymphoproliferative disorders can be readily diagnosed using cytological, histological and immunological techniques. However, in MRD and in certain cases in which the diagnosis is ambiguous, genetic techniques may be useful.28,40 Examples include cases of controversial lineage, lymphomas in which the histology is ambiguous and occult lymphomas. DNA analysis may also help in determining whether a lymphocytosis is monoclonal, oligoclonal or polyclonal. Translocations do occur in these disorders and may be used in monitoring disease, as described for CML earlier. However, the most commonly used markers, because they are more universally applicable, are the rearranged immunoglobulin (IG) and T-cell receptor (TCR) genes.
Principle
For many years, Southern blot analysis was the gold standard for the detection of rearranged IGH@ and TCR genes. For details on how these were performed and interpreted, we refer the reader to previous editions of this book. More recently, because of its simplicity, the small amount of DNA required and potential sensitivity, PCR has been used to detect rearrangement of the IGH@ and TCR genes. Because of the N region diversity, a polyclonal population of cells will give rise to a ladder of various fragment sizes. However, if one clone becomes abnormally large, a discrete fragment size will begin to dominate the products of the PCR – the basis of the so-called ‘fingerprinting’ method for the diagnosis of lymphoproliferative disorders.41 This analysis can be refined using heteroduplex analysis or SSCP gels in which the sequence as well as the size of the amplified product determines its mobility. To gain further sensitivity in following disease, the product of a ‘clonal’ amplification can be sequenced to derive a clone-specific sequence at the site of rearrangement. This sequence can then be used for the design of clone-specific oligonucleotide probes or primers that can be used in ASOH, ARMS or qRT-PCR. This methodology has been used to monitor MRD in lymphoproliferative disorders.42,43
A comprehensive report has been published on the design and standardization of PCR primers and protocols for the detection of IGH@ and TCR gene rearrangements.40 The detection rate of clonal rearrangements is very high, but the comprehensive nature of the test requires 107 primer pairs in 18 multiplex PCR tubes, which are now commercially available. The methods described here are more restricted but more widely applicable.
Method: Immunoglobulin Heavy Chain Gene Rearrangement
To study immunoglobulin gene rearrangement, the locus of choice is the heavy chain gene. A single primer can be used, which will anneal to a consensus sequence shared by all joining (JH) segments. The choice of variable (VH) segment primers is more difficult and for the more comprehensive analysis, primers from all three framework regions for each of the six or seven VH families are used.39 A reasonable starting point, however, is to use the JH primer in conjunction with a different primer derived from a consensus sequence of the framework 1 region for each VH family. These primers are as follows:
Immunoglobulin Heavy Chain and TCR Gene Rearrangements as Targets for Minimal Residual Disease Analysis
The value of detecting residual disease with greater sensitivity than light microscopy, using molecular or immunological techniques, has been extensively evaluated in childhood and adult ALL. Minimal residual disease is defined as the ‘lowest level of disease detectable in patients in CR (i.e. complete remission) by the methods available’ and the newly developed real-time quantitative PCR techniques have revolutionized MRD investigation and patient management. The methodology makes use of the information derived from the cloning and sequencing of the rearranged clonal leukemic clone and the generation of an allele-specific primer able to identify the unique rearrangement belonging to the leukaemic cell with a sensitivity of 1 in 100 000 normal cells. Guidelines for the interpretation of real-time quantitative PCR data in the analysis of minimal residual disease by IGH@/TCR gene rearrangement have been generated by a European study group. These are currently being followed and applied in a large study at international level and we refer the reader to such extensive publications43 for further information.
In brief, these studies in children have concluded that conversion to MRD negativity shortly after induction therapy and maintenance of MRD negativity are prerequisites for long-term disease-free survival and that MRD positivity often precedes clinical relapse.44 In adults also, MRD analysis carried out during induction therapy provides a strong predictor of outcome and should also be applied to harvested BM to exclude patients with detectable leukaemia burden of more than 1:103 normal cells. Finally, predictions of outcome based on MRD analysis in children and adults are more accurate than predictions based on other prognostic indicators, such as age, gender, immunophenotype, presenting white cell count, karyotype and time taken to achieve first CR.45–47
The Myeloproliferative Neoplasms
JAK2 Mutation Analysis
In 2005 several groups independently identified a unique mutation in the JAK homology 2 (JH2) pseudokinase domain of the Janus kinase 2 (JAK2) gene in patients with a variety of myeloproliferative neoplasms (MPNs), including polycythemia vera (PV), essential thrombocythemia (ET) and primary myelofibrosis (PMF).48,49 The mutation was reported in up to 90%, 40% and 25% of patients in the three diseases, respectively, but not in chronic myelogenous leukaemia or in 700 normal controls. It consisted of a G to T substitution at nucleotide 1849 of exon 14, leading to a valine to phenylalanine substitution at codon 617 (V617F). This mutation caused loss of JAK2 auto-inhibition and constitutive activation of the cytoplasmic JAK2 kinase and has become recognized for definitive molecular diagnosis of PV. Until this mutation was identified the distinction between primary and secondary polycythemia was sometimes difficult to establish.
Principle: JAK2 Exon 14 Mutation Analysis
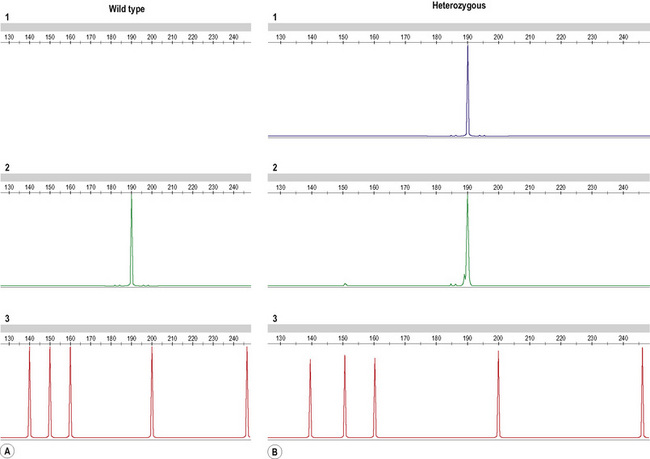
A more successful approach in our hands is the use of primers designed to include a fluorescent label that differs between the wild-type and the mutant primer. The PCR product can then be run on a fragment analyser (the ABI 3130 for instance, Applied Biosystems, Warrington) with the wild-type and mutant allele appearing as two distinct fragments of the expected size in separate channels (Fig. 8.11).
Method A: Using a DNA fragment analyser
Method B: Using pyrosequencing
Interpretation
All tests are carried out including a positive control (DNA from HEL cell line, grown in vitro or any other DNA from cell lines or patients carrying a homozygous mutant allele), a negative control (normal individual DNA) and a non-template control, containing all reagents and water in place of DNA. Samples are tested in duplicate for the pyrosequencing and evaluated for the presence of a peak in the amplification well containing primers for the mutant allele. The amplitude of the luminescence signal provides quantification of wild-type and mutant allele amplicons as percentages of total. If using agarose gels, the presence of a band in the wild-type combination but not in the mutant will identify a wild-type patient; the presence of a band only in the mutant reaction will identify a homozygous patient, while the heterozygous cases will show amplification in both wild-type and mutant wells. The same principle applies when using a fragment analyser (Fig. 8.11). Fragment analysis can be semi-quantitative if the PCR cycle number is kept low, with the peak height reflecting the amount of target sequence present in the starting material. Several quantitative PCR tests have recently being developed and we refer to the wider literature for information on such tests.50
Acute Myeloid Leukaemia
Method and Interpretation
The above three translocations are determined and monitored by amplification of the mRNA, resulting from the fusion gene, as this is leukaemia-specific in the same way as the BCR–ABL1 testing for the t(9;22) (see p. 155 for the preparation of cDNA and conditions of PCR amplification). However, for primers specific for amplification at diagnosis and for qRT-PCR for follow-up samples we follow the protocols and guidelines for interpretation of results provided by the Europe Against Cancer Consortium.51,52
It is worth noting that due to the multiplicity of the MLL–MLLT2 fusion products and the limitations of hydrolysis probe amplicon size, a genomic DNA-based assay may be employed for following affected patients as previously described.53 This involves the characterization of the individual breakpoint by direct sequencing and designing an ASO in a manner similar to that for Ig/TCR-based MRD.54 As controls for amplification we use the Ipsogen plasmids (www.ipsogen.com ). For interpretation of data, we refer to the Europe Against Cancer guidelines.50,51
FLT3 PCR-based Mutation Analysis
In the past 10 years, genetic changes identified in the leukaemic cells at the time of diagnosis have greatly influenced treatment and management of AML. In addition to chromosomal abnormalities, mutations in specific genes have also emerged as important prognostic indicators. Among the most common are mutations in tyrosine kinase genes such as FLT3 and NPM1.55–57
Interpretation
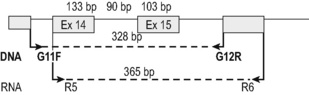
A 328 bp amplicon using cDNA (R5F–R6R primers; Fig. 8.12) and a 365 bp amplicon when using DNA (and G11F and G12R primers; Fig. 8.12) are detected in the presence of a wild-type allele. The mutant allele gives rise to a larger amplicon of variable size depending on the size of the internal tandem repeat, different in each individual patient. Because the wild-type and mutant amplicons are very similar in size the PCR product is better visualized using a fragment analyser. This offers a more accurate separation of similar-size products but requires one of the primers used in the reaction to be fluorescently labelled. The samples can be reported as ‘wild-type’ or ‘mutated’ depending on the results obtained and the size of the mutant allele should be noted in the report (in bp).
Reagents and Methods
Primer sequences for the test and PCR amplification strategy on cDNA are as follows:
Host–donor chimerism studies
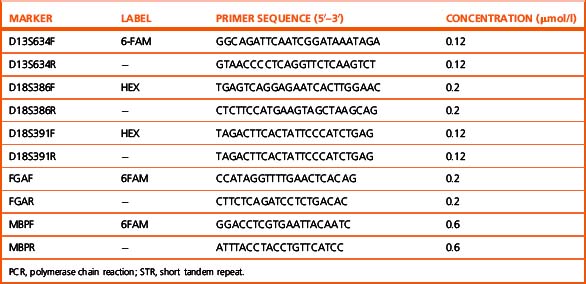
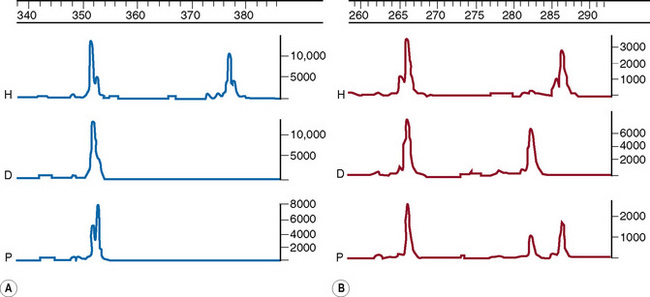
Following allogeneic stem cell transplantation it is important to monitor the engraftment of donor cells in the host. This can be achieved in a number of ways, one of which is the use of DNA markers. The method of choice is the PCR amplification of short tandem repeat (STR) loci, which, because of their highly polymorphic nature, are likely to give informative differences between any host–donor pair.58
Method
This method has been modified from Mann et al.59 by Griffiths and Mason (pers. comm.). Five primer pairs are used, as listed in Table 8.5. PCR reactions are carried out using buffer III with 1.5 mM MgCl2. Amplification conditions are 94°C for 5 min, then 25 cycles of 94°C for 30 s, 57°C for 1 min and 72°C for 2 min followed by an extension at 72°C for 5 min. Products are then analysed by genotyping as follows. One μl of the PCR product, which may need to be diluted from 1:4 to 1:10 in water, is added to 10 μl of formamide containing the size marker Rox 500 (Applied Biosystems, Warrington) diluted 7.5 μl per 500 μl of formamide, aliquoted into an optical 96-well reaction plate and run on the ABI 3700 DNA analyser (or equivalent). Peaks representing the DNA fragments are visualized with the Genotyper software (Applied Biosystems, Warrington).
Interpretation
Comparing the host (pre-transplant) and donor DNA samples, an informative difference is sought at one or more of the STR loci such that host- and/or donor-specific alleles are identified. Correction factors are established by comparing the relative peak heights of the two host or donor alleles at these STRs. Post-transplant, the area under each informative peak is recorded and used to assess the relative proportion of host and donor DNA. Examples of full-engraftment and mixed chimerism are given in Figure 8.13.
1 International Human Genome Sequencing Consortium. Initial sequencing and analysis of the human genome. Nature. 2001;409:860-921.
2 Venter J.C., Adams M.D., Myers E.W., et al. The sequence of the human genome. Science. 2001;291:1304-1351.
3 Saiki R.K., Gelfand D.H., Stoffel S., et al. Primer-directed enzymatic amplification of DNA with a thermostable DNA polymerase. Science. 1988;239:487-491.
4 Association for Molecular Pathology. Recommendations for in-house development and operation of molecular diagnostic tests. Am J Clin Pathol. 1999;111:449-463.
5 Schwartz M.K. Genetic testing and the clinical laboratory improvement amendments of 1988: present and future. Clin Chem. 1999;45:739-745.
6 Williams L.O., Cole E.C., Lubin I.M., et al. Quality assurance in human molecular genetics testing: status and recommendations. Arch Pathol Lab Med. 2003;127:1353-1358.
7 Harris S., Jones D.B. Optimization of the polymerase chain reaction. Br J Biomed Sci. 1997;54:166-173.
8 Newton C.R., Graham A., Heptinstall L.E., et al. Analysis of any point mutation in DNA. The amplification refractory mutation system (ARMS). Nucleic Acids Res. 1989;17:2503-2516.
9 Old J.M., Varawalla N.Y., Weatherall D.J. Rapid detection and prenatal diagnosis of β-thalassaemia: studies in Indian and Cypriot populations in the UK. Lancet. 1990;336:834-837.
10 Wallace R.B., Shaffer J., Murphy R.F., et al. Hybridization of synthetic oligodeoxyribonucleotides to PhiX174 DNA: the effect of single base pair mismatch. Nucleic Acids Res. 1979;6:3543-3547.
11 Saiki R.K., Chang C.A., Levenson C.H., et al. Diagnosis of sickle cell anemia and beta-thalassemia with enzymatically amplified DNA and non-radioactive allele specific oligonucleotide probes. N Engl J Med. 1988;319:537-541.
12 Kawasaki E., Saiki R., Erlich H. Genetic analysis using polymerase chain reaction-amplified DNA and immobilized oligonucleotide probes: reverse dot-blot typing. Methods Enzymol. 1993;218:369-381.
13 Old J. Haemoglobinopathies. Prenat Diagn. 1996;16:1181-1186.
14 Clark B.E., Thein S.L. Molecular diagnosis of haemoglobin disorders. Clin Lab Haematol. 2004;26:159-176.
15 Liu Y.T., Old J.M., Miles K., et al. Rapid detection of alpha-thalassaemia deletions and alpha-globin triplication by multiplex polymerase chain reactions. Br J Haematol. 2000;108:295-299.
16 Ryan K., Bain B.J., Worthington D., et al. On behalf of the British Committee for Standards in Haematology. Significant haemoglobinopathies: guidelines for screening and diagnosis. Br J Haematol. 2010;149:35-49.
17 Cumming A.M., Shiach C.R. The investigation and management of inherited thrombophilia. Clin Lab Haematol. 1999;21:77-92.
18 Poort S.R., Rosendaal F.R., Reitsma P.H., et al. A common genetic variation in the 3′-untranslated region of the prothrombin gene is associated with elevated plasma prothrombin levels and an increase in venous thrombosis. Blood. 1996;88:3698-3703.
19 Bertina R.M., Koeleman B.P., Koster T., et al. Mutation in blood coagulation factor V associated with resistance to activated protein C. Nature. 1994;369:64-67.
20 Baglin T., Gray E., Greaves M., et al. British Committee for Standards in Haematology. Clinical guidelines for testing for heritable thrombophilia. Br J Haematol. 2010;149:209-220.
21 Vidal F., Farssac E., Altisent C., et al. Rapid hemophilia A molecular diagnosis by a simple DNA sequencing procedure: identification of 14 novel mutations. Thromb Haemost. 2001;85:580-583.
22 Lakich D., Kazazian H.H.Jr, Antonarakis S.E., et al. Inversions disrupting the factor VIII gene are a common cause of severe haemophilia A. Nat Genet. 1993;5:236-241.
23 Wion K.L., Tuddenham E.G.D., Lawn R. A new polymorphism in the factor VIII gene for prenatal diagnosis of haemophilia A. Nucleic Acids Res. 1986;14:4535-4542.
24 Liu Q., Nozari G., Sommer S.S. Single-tube polymerase chain reaction for rapid diagnosis of the inversion hotspot of mutation in hemophilia A. Blood. 1998;92:1458-1459.
25 Secker-Walker L.M., Craig J.M., Hawkins J.M., et al. Philadelphia-positive acute lymphoblastic leukaemia in adults: age distribution. BCR-breakpoint and prognostic significance. Leukaemia. 1991;5:196-199.
26 Macintyre E.A., Delabesse E. Molecular approaches to the diagnosis and evaluation of lymphoid malignancies. Semin Hematol. 1999;36:373-389.
27 Biondi A., Rambaldi A., Pandolfi P.P., et al. Molecular monitoring of the myl/retinoic acid receptor-α fusion gene in acute promyelocytic leukaemia by polymerase chain reaction. Blood. 1992;80:492-497.
28 Delabesse E., Asnafi V., Macintyre E. Application of molecular biology techniques to malignant haematology. Transfus Clin Biol. 2003;10:335-352.
29 Cross N.C.P., Melo J.V., Lin F., et al. An optimised multiplex polymerase chain reaction for detection of BCR-ABL fusion mRNAs in haematological disorders. Leukaemia. 1994;8:186-189.
30 Lin F., Goldman J.M., Cross N.C.P. A comparison of the sensitivity of blood and bone marrow for the detection of minimal residual disease in chronic myeloid leukaemia. Br J Haematol. 1994;86:683-685.
31 Chomczynski P., Sacchi N. Single step method of RNA isolation by acid guanidinium thiocyanate-phenol-chloroform extraction. Annals of Biochemistry. 1987;162:156-159.
32 Gabert J., Beillard E., van der Velden, et al. Standardization and quality control studies of ‘real-time’ quantitative reverse transcriptase polymerase chain reaction of fusion gene transcripts for residual disease detection in leukemia – a Europe Against Cancer program. Leukaemia. 2003;17:2318-2357.
33 Menisk E., van de Locht A., Schattenberg A. Quantification of minimal residual disease in Philadelphia chromosome positive chronic myeloid leukaemia patients using real-time quantitative RT-PCR. Br J Haematol. 1998;102:768-774.
34 Holland P.M., Abramson R.D., Watson R., et al. Detection of specific polymerase chain reaction product by utilizing the 5′–3′ exonuclease activity of Thermus aquaticus DNA polymerase. Proc Natl Acad Sci U S A. 1991;88:7276-7280.
35 Livak K.J., Flood S.J., Marmaro J., et al. Oligonucleotides with fluorescent dyes at opposite ends provide a quenched probe system useful for detecting PCR product and nucleic acid hybridization. PCR Methods Appl. 1995;4:357-362.
36 Kaeda J., Chase A., Goldman J.M. Cytogenetic and molecular monitoring of residual disease in chronic myeloid leukaemia. Acta Haematol. 2002;107:64-75.
37 Hochhaus A., Lin F., Reiter A., et al. Quantification of residual disease in chronic myeloid leukaemia on interferon-alpha therapy by competitive polymerase chain reaction. Blood. 1996;87:1549-1555.
38 Hughes T., Kaeda J., Branford S., et al. For the International Randomized Study of Interferon Versus STI571 (IRIS) Study Group. Frequency of major molecular responses to imatinib or interferon alfa plus cytarabine in newly diagnosed chronic myeloid leukemia. N Engl J Med. 2003;349:1397-1431.
39 White H.E., Matejtschuk P., Rigsby P., et al. Establishment of the 1st World Health Organization International Genetic Reference Panel for quantitation of BCR-ABL mRNA. Blood. 2010. 10.1182/blood-2010-1182/b06-1182/blood-2010-11291641 [Epub ahead of print]
40 van Dongen J.J., Langerak A.W., Bruggemann M., et al. Design and standardization of PCR primers and protocols for detection of clonal immunoglobulin and T-cell receptor gene recombinations in suspect lymphoproliferations: report of the BIOMED-2 Concerted Action BMH4-CT98–BMH4-3936. Leukemia. 2003;17:2257-2317.
41 Deane M., Norton J.D. Detection of immunoglobulin gene rearrangement in B lymphoid malignancies by polymerase chain reaction gene amplification. Br J Haematol. 1990;74:251-256.
42 Cave H., van der Werff ten Bosch J., Suciu S., et al. Clinical significance of minimal residual disease in childhood acute lymphoblastic leukemia. N Engl J Med. 1998;339:591-598.
43 van der Velden V.H., Hochhaus A., Cazzaniga G., et al. Detection of minimal residual disease in hematologic malignancies by real-time quantitative PCR: principles, approaches and laboratory aspects. Leukemia. 2003;17:1013-1034.
44 Goulden N., Bader P., van der Velden V., et al. Minimal residual disease prior to stem cell transplant for childhood acute lymphoblastic leukaemia. Br J Haematol. 2003;122:24-29.
45 Patel B., Rai L., Buck G., et al. Minimal residual disease is a significant predictor of treatment failure in non T-lineage adult acute lymphoblastic leukaemia: final results of the international trial UKALL XII/ECOG2993. Br J Haematol. 2010;148:80-89.
46 Giebel S., Stella-Holowiecka B., Krawczyk-Kulis M., et al. Status of minimal residual disease determines outcome of autologous hematopoietic SCT in adult ALL. Bone Marrow Transplant. 2009;45:1095-1101.
47 Gökbuget N., Raff R., Brügge-Mann M., et al. Risk/MRD adapted GMALL trials in adult ALL. Ann Hematol. 2004;83(suppl 1):S129-S131.
48 Baxter E.J., Scott L.M., Campbell P.J., et al. Cancer Genome Project. Acquired mutation of the tyrosine kinase JAK2 in human myeloproliferative disorders. Lancet. 2005;365:1054-1061.
49 Steensma D.P., Dewald G.W., Lasho T.L., et al. The JAK2 V617F activating tyrosine kinase mutation is an infrequent event in both ‘atypical’ myeloproliferative disorders and myelodysplastic syndromes. Blood. 2005;106:1207-1209.
50 Denys B., El Housni H., Nollet F., et al. A real-time polymerase chain reaction assay for rapid, sensitive and specific quantification of the JAK2V617F mutation using a locked nucleic acid-modified oligonucleotide. J Mol Diagn. 2010;12:512-519.
51 Gabert J., Beillard E., van der Velden V.H., et al. Standardization and quality control studies of ‘real-time’ quantitative reverse transcriptase polymerase chain reaction of fusion gene transcripts for residual disease detection in leukemia – a Europe Against Cancer program. Leukemia. 2003;17:2318-2357.
52 Beillard E., Pallisgaard N., van der Velden V.H., et al. Evaluation of candidate control genes for diagnosis and residual disease detection in leukemic patients using ‘real-time’ quantitative reverse-transcriptase polymerase chain reaction (RQ-PCR) – a Europe against cancer program. Leukemia. 2003;17:2474-2486.
53 Reichel M., Gillert E., Breitenlohner I., et al. Rapid isolation of chromosomal breakpoints from patients with t(4;11). Acute lymphoblastic leukemia. Cancer Res. 1999;59:3357-3362.
54 Szczepański T., Willemse M.J., Brinkhof B., et al. Comparative analysis of Ig and TCR gene rearrangements at diagnosis and at relapse of childhood precursor-B-ALL provides improved strategies for selection of stable PCR targets for monitoring of minimal residual disease. Blood. 2002;99:2315-2323.
55 Horiike S., Yokota S., Nakao M., et al. Tandem duplications of the FLT3 receptor gene are associated with leukemic transformation of myelodysplasia. Leukemia. 1997;11:1442-1446.
56 Cazzaniga G., Dell’Oro M.G., Mecucci C., et al. Nucleophosmin mutations in childhood acute myelogenous leukemia with normal karyotype. Blood. 2005;106:1419-1422.
57 Bacher U., Schnittger S., Haferlach T. Molecular genetics in acute myeloid leukemia. Curr Opin Oncol. 2010;22(6):646-655.
58 Van Deerlin V.M., Leonard D.G. Bone marrow engraftment analysis after allogeneic bone marrow transplantation. Clinical and Laboratory Medicine. 2000;20:197-225.
59 Mann K., Fox S.P., Abbs S.J., et al. Development and implementation of a new rapid aneuploidy diagnostic service within the UK National Health Service and implications for the future of prenatal diagnosis. Lancet. 2001;358:1057-1061.
[/level-membership-for-hematology-oncology-and-palliative-medicine-category][not-level-membership-for-hematology-oncology-and-palliative-medicine-category]
Chapter 8 Molecular and cytogenetic analysis
Introduction to the analysis of DNA
The ability to manipulate DNA as recombinant molecules followed from the discovery of bacterial DNA-modifying enzymes that allowed genes to be isolated as cloned recombinant DNA molecules and their DNA to be sequenced. The sequence of the human genome is now complete (see: www.ornl.gov/sci/techresources/Human_Genome/project/timeline.shtml).1,2 It has become extensively annotated and is accessible through a number of genome browsers. The ability to amplify specific DNA fragments from small amounts of starting material using the polymerase chain reaction (PCR)3 is now the cornerstone of most routine DNA analysis. Because this technique is relatively simple, rapid, inexpensive and requires only some basic pieces of laboratory equipment, it has made molecular genetic analysis readily accessible in many laboratories.
Guidelines from the American Association for Molecular Pathology address the choice and development of appropriate diagnostic assays, quality control and validation and implementation of molecular diagnostic tests.4 In the UK, a national external quality assessment scheme has been approved for the molecular genetics of thrombophilia and pilot studies are currently in progress for the molecular diagnosis of haematological malignancies and for haemophilia A. It is true, however, that the development and implementation of quality control methods and assurance standards still lag behind the rapid rate of expansion of molecular techniques.5,6 To overcome this, both at national and international level, several groups are attempting to reach a standardization of molecular methodologies applied to fusion gene quantification (BCR–ABL1, PML–RARA, etc.) in myeloid malignancies as well as the molecular monitoring of residual disease using antigen receptor targets in acute and chronic lymphoid malignancies.
Polymerase chain reaction
Development of the PCR3 has had a dramatic impact on the study and analysis of nucleic acids. Through the use of a thermostable DNA polymerase, Taq polymerase (available from various suppliers, including Applied Biosystems, Warrington and Thermo-Fisher, Runcorn) extracted from the bacterium Thermus aquaticus, the PCR results in the amplification of a specific DNA fragment such that it can be visualized using intercalating SYBR Safe (Invitrogen, Paisley) added to agarose gels. Ethidium bromide, a carcinogenic product, is no longer in use for safety reasons. The procedure takes only a few hours and requires only a very small amount of starting material.
Principle
The first step of the reaction is to denature the DNA, generating single-stranded templates, by heating the reaction mixture to 95°C. The reaction is then cooled to a temperature, usually between 50°C and 68°C, that permits the annealing of the primers to the DNA template but only at their specific complementary sequences. The temperature is then raised to 72°C, at which temperature the Taq polymerase efficiently synthesizes DNA, extending from the primers in a 5′ to 3′ direction. Cyclical repetition of the denaturing, annealing and extension steps, by simply changing the temperature of the reaction in an automated heating block, results in exponential amplification of the DNA that lies between the two primers (Fig. 8.1).
Reagents
Method
Optimal conditions for the reaction have to be derived empirically, with the magnesium concentration and annealing temperature being the most important parameters.7 The choice of buffer depends on the enzyme being used and the company will usually supply the most appropriate one. For genes with a high GC content, buffer II in combination with 10% DMSO may give better amplification. In most cases, a 25 μl reaction volume suffices. A blank control should always be included (i.e. a reaction without any template) to control for contamination. If the blank control yields a product, the analysis is invalid. A DNA sample that is known to amplify can also be included and this sample may then be used as a normal or positive control.
| Stock solution | Volume (μl) | Final concentration |
|---|---|---|
| ×10 PCR buffer III | 50 | ×1 |
| 25 mmol/l MgCl2 | 40 | 2.0 mmol/l |
| 10 mmol/l dNTP | 10 | 0.02 mmol/l |
| 10 μmol/l Primer (1) | 20 | 0.04 μmol/l |
| 10 μmol/l Primer (2) | 20 | 0.04 μmol/l |
| 5 u/μl Taq polymerase | 2 | 0.02 μ/ml |
| Water | 358 | |
| Final volume | 500 |
Add the Taq polymerase last, mix well and pulse-spin in a microcentrifuge to bring down the contents of the tube.
Modifications and Developments
Analysis of polymerase chain reaction products
Presence or Absence of a Polymerase Chain Reaction Product
Amplification Refractory Mutation System
Principle
Point mutations and small insertions or deletions can be identified directly by the presence or absence of a PCR product using allele-specific primers.8,9 Two different oligos are used that differ only at the site of the mutation (the amplification refractory mutation system or ARMS, primers) with the mismatch distinguishing the normal and mutant base located at the 3′ end of the oligo. In a PCR, an oligo with a mismatch at its 3′ end will fail to prime the extension step of the reaction. Each test sample is amplified in two separate reactions containing either a mutant ARMS primer or a normal ARMS primer. The mutant primer will prime amplification together with one common primer from DNA with this mutation but not from a normal DNA. A normal primer will do the opposite. To increase the instability of the 3′ end mismatch and so ensure the failure of the amplification, it is sometimes necessary to introduce a second nucleotide mismatch three or four bases from the 3′ end of both oligos. A second pair of unrelated primers at a distance from the ARMS primers is included in each reaction as an internal control to demonstrate that efficient amplification has occurred. This is essential because a failure of the ARMS primer to amplify is interpreted as a significant result and must not be the result of suboptimal reaction conditions.
Gap-PCR
Large deletions can be detected by Gap-PCR. Primers located 5′ and 3′ to the breakpoints of a deletion will anneal too far apart on the normal chromosome to generate a fragment in a standard PCR. When the deletion is present, the sites at which these primers anneal will be brought together, enabling them to give rise to a product. An example of this is given for the detection of deletions in α° thalassaemia in Figure 8.4 on p. 149.
Figure 8.4 Detection of α° thalassaemia by multiplex Gap-PCR. The sequences of the primers used are shown in Table 8.1. A normal fragment of 1010 bp is generated by the primers α/SEA(F) and α/(R) in all lanes (although this is very faint in lane 11). In addition, a fragment of 660 bp is generated by the primer pair α/SEA(F) and SEA(R) in lanes 1, 4 and 8 in individuals who are heterozygous for the − −SEA deletion; a fragment of 550 bp is generated by the primer pair FIL(F) and FIL(R) in lane 9 in an individual who is heterozygous for the − −FIL deletion; a fragment of 875 bp is generated by the primer pair MED(F) and MED(R) in lane 10 in an individual who is heterozygous for the − −MED deletion; and a fragment of 1187 bp is generated by the primer pair 20.5(F) and 20.5(R) in lane 10 in an individual who is heterozygous for the −α20.5 deletion.
By the same principle, the sites at which primers anneal can be brought together by chromosomal translocation, giving rise to a diagnostic product. Breakpoints may be clustered over too large a region for genomic DNA to be used in these instances. However, leukaemic translocations can also give rise to transcribed fusion genes. Primer annealing sites in different genes are then juxtaposed in a hybrid messenger RNA (mRNA) molecule and can give rise to a reverse transcription-PCR (RT-PCR) product. Examples of this are given for the analysis of minimal residual disease in chronic myelogenous leukaemia (CML) in Figure 8.8 on p. 155.
Restriction Enzyme Digestion
Principle
Restriction enzymes (RE) cleave DNA at short specific sequences. Because many RE are available, it is not uncommon for a single point mutation to coincidentally create or destroy an RE recognition sequence. If this is the case, digestion of the appropriate PCR product prior to agarose gel electrophoresis enables the mutation to be identified. A difference in the size of the restriction fragments seen in normal and mutant samples can be predicted from a restriction map of the amplified fragment and the site of the mutation that changes a restriction site. The observed fragments should be consistent with either the mutant or the normal pattern. An example is shown in Figure 8.2 on p. 147 in the diagnosis of the sickle cell mutation.
Reagents
Method
Allele-Specific Oligonucleotide Hybridization
Principle
Under appropriate conditions, short oligonucleotide probes will hybridize to their exact complementary sequence but not to a sequence in which there is even a single base mismatch.10 A pair of oligos is therefore used to test for the presence of a point mutation: a mutant oligo complementary to the mutant sequence and a normal oligo complementary to the normal sequence, with the sequence difference placed near the centre of each oligo.
This methodology has been widely applied for the detection of point mutations using fluorescently labelled TaqMan probes that distinguish the two alleles. Two short allele-specific probes are used, one of which will hybridize only to the wild-type allele and one of which will hybridize only to the mutant allele. Each probe is labelled with a different fluorescent colour, which is quenched while the probe remains intact, but is released if and when the probe hybridizes to its perfectly complementary sequence during the PCR reaction, as it will then be broken up by the exonuclease activity of the Taq polymerase. An example of this analysis is the detection of the factor V Leiden mutation in Figure 8.5 on p. 150.
Interpretation
Other non-radioactive probes, with detection systems involving horseradish peroxidase, have also been quite widely used in this procedure.11 The technique has also been modified such that the allele-specific oligonucleotides are immobilized onto nylon membranes and the patient-specific PCR product is used as the probe–the reverse dot blot procedure.12 This allows for several different mutations to be analysed simultaneously and has proved particularly useful in the diagnosis of β thalassaemia mutations.13
DNA Sequencing
Reagents
Method
Interpretation
Reading the DNA sequence from a good trace – known as an electrophoretogram – is completely straightforward: As are called as green peaks; Ts as red; Cs as blue; and Gs as black. Free software packages, such as Chromas (at: http://chromas-lite-version.fyxm.net/), are available for viewing these traces and will call the DNA sequence in the file. Simple alignment of this sequence to the GenBank reference sequence can be performed at the National Center for Bioinformatics (NCBI) using the Blast program (at: http://blast.ncbi.nlm.nih.gov/Blast.cgi?CMD=Web&PAGE_TYPE=BlastHome) and will identify any sequence changes. Heterozygous point mutations will be seen as double peaks, with two colours overlaid. Small heterozygous insertions or deletions (indels) are harder to decipher, as the sequence 3′ of the mutation will be a double sequence, with the normal and indel allele superimposed on one another: the extent of the indel can be defined by subtracting from the expected normal sequence.
Investigation of haemoglobinopathies
Sickle Cell Disease
The presence of a sickle cell gene can be determined by haemoglobin cellulose acetate electrophoresis or a sickling test. However, there are occasions when it is beneficial to make this diagnosis by DNA analysis (e.g. in prenatal diagnosis, which can be performed at 10 weeks of pregnancy, in distinguishing HbS/S from HbS/β° thalassaemia or in confirming the diagnosis of sickle cell anaemia in a neonate). For the type of specimens collected for prenatal diagnosis, refer to p. 330.
The sickle cell mutation in codon 6 of the β globin gene (GAG → GTG) results in the loss of a Bsu36 I (or Mst II, Sau I, OxaN I or Dde I) restriction enzyme site that is present in the normal gene. It is therefore possible to detect the mutation directly by restriction enzyme analysis of a DNA fragment generated by the PCR. A pair of primers are used to amplify exons 1 and 2 of the β globin gene and the products of the PCR are digested with Bsu36 I. The loss of a Bsu36 I site in the sickle cell gene gives rise to an abnormally large restriction fragment that is not seen in normal individuals (Fig. 8.2).
β Thalassaemia
The ethnic groups with the highest incidence of β thalassaemia are the Mediterranean populations, Asian Indians, Chinese and Africans. Although more than 100 β thalassaemia mutations are known, each of these groups has its own subset of mutations, so that as few as five different mutations may account for more than 90% of the affected individuals in a population. This makes the direct detection of β thalassaemia mutations a reasonable possibility and it has become the method of choice where it is most important: in prenatal diagnosis.13,14
The majority of mutations causing β thalassaemia are point mutations affecting the coding sequence, splice sites or promoter of the β globin gene. Methods for their detection include either ARMS or reverse dot blot analysis, although more commonly now, they are detected by direct DNA sequence analysis. Unstable and other unusual haemoglobins may also cause disease and can also be identified by direct DNA sequence analysis. An example of such a case is shown in Figure 8.3, where a picture of moderate anaemia is seen in the heterozygote due to the highly unstable and electrophoretically silent variant, haemoglobin, Durham, NC.
α Thalassaemia
In contrast to the β thalassaemias, the most common α thalassaemia mutations are deletions. Two categories exist: those that remove only one of the two alpha globin genes on any one chromosome (α+ thalassaemia) and those that remove both of the alpha genes from one chromosome (α° thalassaemia). Although PCR amplification around the alpha globin locus has proved to be rather difficult, the common deletions can now be identified by a reasonably robust Gap-PCR.15 In these reactions dimethylsulphoxide (DMSO) and betaine are added. Two different multiplex PCR reactions are set up, one for the common α+ thalassaemias (−α3.7 and −α4.2) and one for the common α° thalassaemias (− −SEA, − −MED, − −FIL and −α20.5). The fragment generated by these primers across the deletion breakpoint is different in size to a control fragment that is generated from the normal chromosome as a part of the multiplex reaction. The primers that flank the deletion breakpoint are too far apart to generate a fragment from the normal chromosome in the PCR. Only when these are brought closer together as a result of the deletion can a fragment be produced. Primer sequences used in this analysis are given in Table 8.1 and an example of their application in the detection of α thalassaemias is shown in Figure 8.4. More than 30 non-deletional forms of α thalassaemia have been described. Of these, Hb Constant Spring and the αHphIα mutation are relatively common in South-east Asian and Mediterranean populations, respectively. These can be detected by ASOH, ARMS, restriction enzyme digestion or direct sequencing of the appropriate PCR product. Unlike the β thalassaemias, α thalassaemias are not easily diagnosed using routine haematological techniques. The diagnosis of α thalassaemias is often made following exclusion of β thalassaemia and iron deficiency. Because the vast majority of cases of α thalassaemia are of the clinically benign type (i.e. α+ thalassaemia), it is debatable whether molecular analysis is justified to reach a diagnosis in these individuals. However, it is important that individuals with α° thalassaemia are identified and the only definitive diagnostic test is DNA analysis. The α° thalassaemias are almost entirely restricted to at-risk ethnic groups, particularly those of South-east Asian or Mediterranean origin and so it is most efficient to target these groups specifically. The diagnosis of α° thalassaemia is particularly relevant if prenatal diagnosis is to be offered to a couple who are at risk of having a fetus with hydrops, where there is an increased risk of maternal death at delivery. Guidelines derived from the UK experience as to how and when DNA analysis should be implemented have recently been updated.16
Table 8.1 Primers used in Gap-PCR analysis of α-thalassaemia
| Primer name | Sequence, 5′→3′ | Concentration (μmol/l) |
|---|---|---|
| α° | Multiplex PCR | Clark and Thein (2004)14 |
| 20.5(F) | GGGCAAGCTGGTGGTGTTACACAGCAACTC | 0.1 |
| 20.5(R) | CCACGCCCATGCCTGGCACGTTTGCTGAGG | 0.1 |
| α/SEA(F) | CTCTGTGTTCTCAGTATTGGAGGGAAGGAG | 0.3 |
| α(R) | TGAAGAGCCTGCAGGACCAGGTCAGTGACCG | 0.15 |
| MED(F) | CGATGAGAACATAGTGAGCAGAATTGCAGG | 0.15 |
| MED(R) | ACGCCGACGTTGCTGCCCAGCTTCTTCCAC | 0.15 |
| SEA(R) | ATATATGGGTCTGGAAGTGTATCCCTCCCA | 0.15 |
| FIL(F) | AAGAGAATAAACCACCCAATTTTTAAATGGGCA | 1.6 |
| FIL(R) | GAGATAATAACCTTTATCTGCCACATGTAGCAA | 1.6 |
| α+ | Multiplex PCR | From JM Old (pers. comm.) |
| 3.7F | CCCCTCGCCAAGTCCACCC | 0.4 |
| 3.7/20.5R | AAAGCACTCTAGGGTCCAGCG | 0.4 |
| 4.2F | GGTTTACCCATGTGGTGCCTC | 0.6 |
| 4.2R | CCCGTTGGATCTTCTCATTTCCC | 0.8 |
| α2R | AGACCAGGAAGGGCCGGTG | 0.1 |
PCR, polymerase chain reaction.
Disorders of coagulation
Thrombophilia
Considerable advances have been made in our understanding of the genetic risk factors found in patients with venous thromboembolism (VTE).17 Among these are the diverse mutations causing protein C, protein S and antithrombin deficiency. An increased factor VIII level is also a risk factor for VTE, but the genetic determinants of this are unclear. Homozygosity for the common C677T mutation of the methylenetetrahydrofolate reductase gene, which gives rise to a thermolabile variant of this protein, has been reported to be a risk factor for VTE, although other studies have not supported this claim. A point mutation in the 3′ UTR of the prothrombin gene associated with elevated protein levels has been identified as a genetic risk factor for VTE.18 The most common of the known genetic risk factors for VTE is a resistance to the anticoagulant effect of activated protein C caused by the Arg506Gln substitution in factor V (factor V Leiden, FVL);19 around 20% of subjects of north European origin presenting for the first time with thromboembolism are heterozygous for this mutation. Because of their prevalence and because the tests have become relatively simple, there is a tendency toward indiscriminate testing for these genetic risk factors in thrombophilia, but without careful and informed counselling this may often be inappropriate (see also Chapter 19).20
