Mixing
Andrew M. Twitchell
Chapter contents
Definition and objectives of mixing
Mathematical treatment of the mixing process
Mechanisms of mixing and demixing
Mixing of miscible liquids and suspensions
Key points
Mixing principles
Importance of mixing
There are very few pharmaceutical products that contain only one component. In the vast majority of cases, several ingredients are needed to ensure that the dosage form functions as required. If, for example, a pharmaceutical company wishes to produce a tablet dosage form containing a drug which is active at a dose of 1 mg, other components (e.g. a diluent, binder, disintegrant and lubricant) will be needed both to enable the product to be manufactured and for it to be handled by the patient.
Whenever a product contains more than one component, a mixing or blending stage will be required in the manufacturing process. This may be to ensure an even distribution of the active component(s), an even appearance or that the dosage form releases the drug at the correct site and at the desired rate. The unit operation of mixing is therefore involved at some stage in the production of practically every pharmaceutical preparation and control of mixing processes is of critical importance in assuring the quality of pharmaceutical products. The importance of mixing is illustrated below by the list of products which invariably utilize mixing processes of some kind:
• tablets, capsules, sachets and dry powder inhalers – mixtures of solid particles
• linctuses – mixtures of miscible liquids
Mixing and its control are also important in unit operations such as granulation, drying and coating.
This chapter considers the objectives of the mixing operation, how mixing occurs, and the ways in which a satisfactory mix can be produced and maintained.
Definition and objectives of mixing
Mixing may be defined as a unit operation that aims to treat two or more components, initially in an unmixed or partially mixed state, so that each unit (particle, molecule, etc.) of the components lies as nearly as possible in contact with a unit of each of the other components.
If this is achieved, it produces a theoretical ‘ideal’ situation, i.e. a perfect mix. As will be shown, however, this situation is not normally practicable, is actually unnecessary and, indeed, is sometimes undesirable.
How closely it is attempted to approach the ‘ideal’ situation depends on the product being manufactured and the objective of the mixing operation. For example, when mixing a small amount of a potent drug in a powder mix, the degree of mixing must be of a high order to ensure a consistent dose. Similarly, when dispersing two immiscible liquids or dispersing a solid in a liquid, a well-mixed product is required to ensure product quality/stability. In the case of mixing lubricants with granules during tablet production, however, there is a danger of ‘overmixing’ and the subsequent production of a weak tablet with an increased disintegration time (discussed in Chapter 30).
Types of mixtures
Mixtures may be categorized into three types that differ fundamentally in their behaviour.
Positive mixtures
Positive mixtures are formed from materials such as gases or miscible liquids which mix spontaneously and irreversibly by diffusion and tend to approach a perfect mix. There is no input of energy required with positive mixtures if the time available for mixing is unlimited, although input of energy will shorten the time required to obtain the desired degree of mixing. In general, materials which mix by positive mixing do not present any problems during product manufacture.
Negative mixtures
With negative mixtures, the components will tend to separate out. If this occurs quickly, then energy must be continuously input to keep the components adequately dispersed, e.g. with a suspension formulation where there is a dispersion of solids in a liquid of low viscosity. With other negative mixtures, the components tend to separate very slowly, e.g. emulsions, creams and viscous suspensions. Negative mixtures are generally more difficult to form and to maintain and require a higher degree of mixing efficiency than do positive mixtures.
Neutral mixtures
Neutral mixtures are said to be static in behaviour, i.e. the components have no tendency to mix spontaneously or segregate spontaneously once work has been input to mix them. Examples of this type of mixture include mixed powders, pastes and ointments. Neutral mixes are capable of demixing, but this requires energy input (as discussed in relation to powder segregation later in this chapter).
It should be noted that the type of mixture can change during processing. For example, if the viscosity increases sufficiently, a mixture may change from a negative to a neutral mixture. Similarly, if the particle size, degree of wetting or liquid surface tension changes, the mixture type may also change.
The mixing process
To discuss the principles of the mixing process, a situation will be considered where there are equal quantities of two powdered components of the same size, shape and density that are required to be mixed, the only difference between them being their colour. This situation will not, of course, occur practically but it will serve to simplify the discussion of the mixing process and allow some important considerations to be illustrated with the help of statistical analysis.
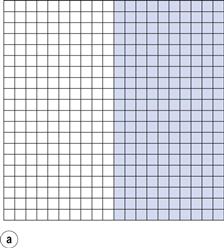
If the components are represented by coloured cubes, then a two-dimensional representation of the initial unmixed or completely segregated state can be shown as in Figure 11.1a.
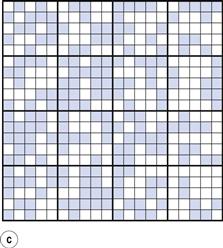
From the definition of mixing, the ideal situation or perfect mix in this case would be produced when each particle lies adjacent to a particle of the other component (i.e. each particle lies as closely as possible in contact with a particle of the other component). This is shown in Figure 11.1b where it can be seen that the components are as evenly distributed as possible. If this mix was viewed in three dimensions then behind and in front of each coloured particle would be a white particle and vice versa. Powder mixing, however, is a ‘chance’ process and while the situation shown in Figure 11.1b could arise, the odds against it are so great that for practical purposes it can be considered impossible. For example, if there are only 200 particles present, the chance of a perfect mix occurring is approximately 1 in 1060 and is similar to the chance of the situation in Figure 11.1a occurring after prolonged mixing. In practice, the best type of mix likely to be obtained will have the components under consideration distributed as indicated in Figure 11.1c. This is referred to as a random mix which can be defined as a mix where the probability of selecting a particular type of particle is the same at all positions in the mix and is equal to the proportion of such particles in the total mix.
If any two adjacent particles are selected from the random mix shown:
• the chance of picking two coloured particles = 1 in 4 (25%)
If any two adjacent particles are selected from the perfect mix shown in Figure 11.1b, there will always be one coloured and one white particle.
Thus if the samples taken from a random mix contain only two particles, then in 25% of cases the sample will contain no white particles and in 25% it will contain no coloured particles. It may help in this and subsequent discussions to imagine the coloured particles as being the active drug and the white particles the inert excipient.
It can be seen that, in practice, the components will not be perfectly evenly distributed, i.e. there will not be full mixing. But if an overall view is taken, the components can be described as being mixed since in the total sample (Fig. 11.1c) the amount of each component is approximately similar (48.8% coloured and 51.2% white). If, however, Figure 11.1c is considered as 16 different blocks of 25 particles, then it can be seen that the number of coloured particles in the blocks varies from six to 19 (24% to 76% of the total number of particles in each block). Careful examination of Figure 11.1c shows that as the number of particles in the sample increases, then the closer will be the proportion of each component to that which would occur with a perfect mix. This is a very important consideration in powder mixing and is discussed in more detail in the following sections.
Scale of scrutiny
Often a mixing process produces a large ‘bulk’ of mixture that is subsequently subdivided into individual dose units (e.g. a tablet, capsule or 5 mL spoonful) and it is important that each dosage unit contains the correct amount/concentration of active component(s). It is the weight/volume of the dosage unit which dictates how closely the mix must be examined/analysed to ensure it contains the correct dose/concentration. This weight/volume is known as the scale of scrutiny and is the amount of material within which the quality of mixing is important. For example, if the unit weight of a tablet is 200 mg then a 200 mg sample from the mix should be analysed to see if mixing is adequate; the scale of scrutiny therefore = 200 mg. If a larger sample size than the scale of scrutiny is analysed this may mask important micro-nonuniformities such as those caused by agglomerates and may lead to the acceptance of an inadequate mix. Conversely, analysing too small a sample size may lead to the rejection of an acceptable mix.
The number of particles contained in the scale of scrutiny will depend on the sample weight, particle size and particle density, and will increase as the sample weight increases and the particle size and density decrease. This number should be sufficient to ensure an acceptably small deviation from the required dose in the dosage forms.
Another important factor to consider when carrying out a mixing process is the proportion of the active component in the dosage form/scale of scrutiny. This is illustrated in Figure 11.2 and in Table 11.1, the latter also demonstrating the importance of the number of particles in the scale of scrutiny.
Table 11.1
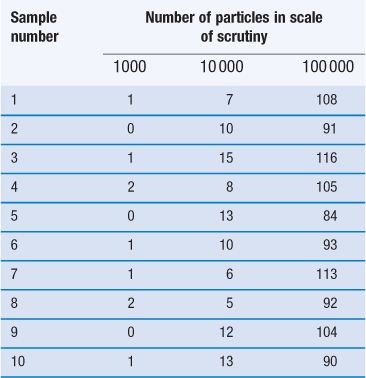
The figures in the table are the numbers of particles of the minor constituent in the samples.
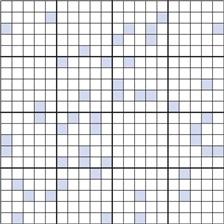
Figure 11.2 shows a random mix containing only 10% coloured particles (active ingredient). If the blocks of 25 particles are examined, it can be seen that the number of coloured particles varies from 0 to 8 or 0% to 32%. Thus, the number of coloured particles as a percentage of the theoretical content varies from 0% to 320%. This is considerably greater than the range of 48 to 152% when the proportion of coloured particles was 0.5 or 50% (Fig. 11.1c).
Table 11.1 shows how the content of a minor (potent) active constituent (present in a proportion of one part in a thousand, i.e. 0.1%) typically varies with the number of particles in the scale of scrutiny, when sampling a random mix. In the example shown, when there are 1000 particles in the scale of scrutiny, three samples contain no active constituent and two have twice the amount that should be present. With 10 000 particles in the scale of scrutiny, the deviation is reduced but samples may still deviate from the theoretical content of 10 particles by ± 50%. Even with 100 000 particles, deviation from theoretical content may be > ± 15% which is generally unacceptable for a pharmaceutical mixture. The difficulty in mixing potent substances can be appreciated if it is realized that there may only be approximately 75 000 particles of diameter 150 µm in a tablet weighing 200 mg.
The information in Figure 11.1, Figure 11.2 and Table 11.1 leads to two important conclusions:
One way of reducing the deviation, therefore, would be to increase the number of particles in the unit dose by decreasing the particle size. This may, however, lead to particle agglomeration due to the increased cohesion and adhesion that occurs with smaller particles, which in turn may reduce the ease of mixing.
It should be noted that with liquid solutions, even very small samples are likely to contain many million ‘particles’. Deviation in content is therefore likely to be very small with miscible liquids even if they are randomly mixed. Diffusion effects in miscible liquids arising from the existence of concentration gradients in an unmixed system mean that they tend to approach a perfect mix.
Mathematical treatment of the mixing process
It should be appreciated that there will always be some variation in the composition of samples taken from a pharmaceutical mix or a random mix. The aim during formulation and processing is to minimize this variation to acceptable levels by selecting an appropriate scale of scrutiny, particle size and mixing procedure (the latter involving the correct choice of mixer, rotation speed, etc.). The following section uses a simplified statistical approach to illustrate some of the factors that influence dose variation within a batch of a dosage form and demonstrates the difficulties encountered with drugs that are active in low doses (potent drugs).
Consider the situation where samples are taken from a random mix in which the particles are all of the same size, shape and density. The variation in the proportion of a component in samples taken from the random mix can be calculated from Equation 11.1:
 (11.1)
where SD is the standard deviation in the proportion of the component in the samples (content standard deviation), p is the proportion of the component in the total mix and n is the total number of particles in the sample.
Equation 11.1 shows that as the number of particles present in the sample increases, the content standard deviation decreases (i.e. there is less variation in sample content), as illustrated previously by the data in Figure 11.2 and Table 11.1. The situation with respect to the effect of the proportion of the active component in the sample is not as clear from Equation 11.1. As p is decreased, the value of content standard deviation decreases, and this may lead to the incorrect conclusion that it is beneficial to have a low proportion of the active component. A more useful parameter to determine is the percentage coefficient of variation (% CV), which indicates the average deviation as a percentage of the mean amount of active component in the samples. Thus, % CV = (content standard deviation/mean content) × 100. The value of % CV will increase as p decreases, as illustrated in Box 11.1.
It might be considered that the variation in content could be reduced by increasing the unit dose size (increasing the scale of scrutiny), as this would increase the number of particles in each unit dose. The dose of a drug will, however, be fixed and any increase in the unit dose size will cause a reduction in the proportion of the active component in the unit dose. The consequence of increasing the unit dose size depends on the initial proportion of the active component. If p is relatively high initially, increasing the unit dose size causes the %CV in content to increase. If p is small, increasing the unit dose size has little effect. Inserting appropriate values into Equation 11.1 can substantiate this.
In a true random mix the content of samples taken from the mix will follow a normal distribution. With a normal distribution, 68.3% of samples will be within ± 1 SD of the overall proportion of the component (p), 95.5% will be within ± 2 SD of p and 99.7% of samples will be within ± 3 SD of p. For example, if p = 0.5 and the standard deviation in content = 0.02, then for 99.7% of samples the proportion of the component will be between 0.44 and 0.56. In other words, if 1000 samples were analysed, 997 samples would contain between 44% and 56% of drug (mean = 50%).
Ideally for a pharmaceutical product the active component should not deviate by more than ± 5% of the mean or specified content, i.e. the acceptable deviation = p × (5/100) or p × 0.05. Note: this is not the same as a standard deviation of 5%.
Estimation of the particle size required when formulating a dosage form
Using the preceding information, it is possible to estimate the particle size required so that a formulation may meet a desired specification.The worked example in Box 11.3 indicates that in order to meet the product specification, the particle size of the components needs to be of the order of 26 µm. There would therefore be practical difficulties in making this product, as particles of this size tend to become very cohesive, flow poorly (see Chapter 12) and are difficult to mix.
In order to appreciate the effect of changing the scale of scrutiny, it is suggested that the reader calculates in a similar manner what particle size would be required if the tablet weight was increased to 250 mg. It should be remembered that the tablet weight or scale of scrutiny will affect both the number of particles present and the proportion of active component.
In summary, the above calculations illustrate the difficulty in mixing potent (low-dose) substances and the importance of both the number of particles in the scale of scrutiny and proportion of the active component.
Evaluation of the degree of mixing
Manufacturers require some means of monitoring a mixing process for a variety of reasons. These could be to:
• indicate the degree/extent of mixing
• indicate when sufficient mixing has occurred
• assess the efficiency of a mixer
• determine the mixing time required for a particular process.
One evaluation method involves the generation of a mixing index that compares the content standard deviation of samples taken from a mix under investigation (SACT) with the content standard deviation of samples from a fully random mix (SR). Comparison with a random mix is made since this is theoretically likely to be the best mix that is practically achievable. The simplest form of a mixing index (M) can be calculated as:
 (11.3)
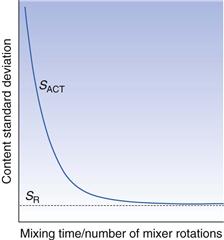
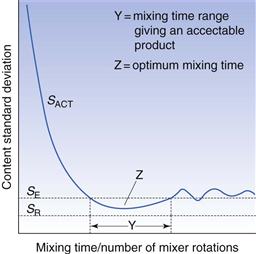
At the start of the mixing process the value of SACT will be high so that M will be low. As mixing proceeds, SACT will tend to decrease as the mix approaches a random mix (see Fig. 11.3). If the mix becomes random, SACT = SR and M = 1. There is typically an exponential decrease in SACT as the mixing time or number of mixer rotations increases, although the shape of the curve will depend on the powder properties and mixer design and utilization. Other more complicated equations for calculating the mixing index have been used but they all tend to rely on similar principles to those described.
In order to evaluate a mixing process in this way, there are two basic requirements. First, a sufficient number of samples which are representative of the mix as a whole must be analysed. A minimum of 10 samples is usually analysed, these being removed from different depths into the mixer and from the middle and sides. Areas where blending may potentially be poor should also be included in the sampling. Samples are often taken with a ‘sampling thief’ which is a device that can be inserted into the mix and samples withdrawn with minimum disruption to the powder bed. Venables & Wells (2001) have discussed some of the problems associated with removing representative samples and analysing powder blends. Second, a suitable analytical technique must be available so that the value of SACT is a true reflection of the variation in content in the samples and not due to variation arising from the method of analysis.
When mixing formulations where the proportion of active component is high, it is possible to achieve an acceptably low variation in content without obtaining a random mix. Thus it may be possible to stop the mixing process before a random mix is achieved and therefore reduce manufacturing costs.
The quality of a mixture may be assessed by its ability to meet predefined specification limits. These could include assay limits for individual samples taken from the mix (e.g. 90 – 110% of the target content) and for the variation in content of these samples (e.g. % CV ≤ 3%).
An alternative method for monitoring and controlling powder blending is to ultilize near-infrared (NIR) analysis. As most pharmaceutical active ingredients and excipients absorb NIR radiation, this technique has the potential advantage of providing homogeneity information on all of the mixture components. NIR spectroscopic methods may also be used non-invasively which can eliminate the problems associated with the use of a sampling thief. Other potential advantages include the speed and non-destructive nature of the analysis. The reader is referred to texts by Ciurczak and Drennen (2002) and Bakeev (2010) for further information.
Mechanisms of mixing and demixing
Powders
In order that powders may be mixed, the powder particles need to move relative to each other. There are three main mechanisms by which powder mixing occurs, namely convection, shear and diffusion.
Convective mixing arises when there is the transfer of relatively large groups of particles from one part of the powder bed to another, e.g. as might occur when a mixer blade or paddle moves through the mix. This type of mixing contributes mainly to the macroscopic mixing of powder mixtures and tends to produce a large degree of mixing fairly quickly (as evidenced by a rapid drop in SACT). Mixing does not, however, occur within the group of particles moving together as a unit and thus in order to achieve a random mix, an extended mixing time is required.
Shear mixing occurs when a ‘layer’ of material flows over another ‘layer’ resulting in the layers moving at different speeds and therefore mixing at the layer interface. This might occur when the removal of a mass by convective mixing creates an unstable shear/slip plane which causes the powder bed to collapse or in high-shear or tumbling mixers where the action of the mixer induces velocity gradients within the powder bed and hence ‘shearing’ of one layer over another.
In order to achieve a true random mix, movement of individual particles is required. This occurs with diffusive mixing. When a powder bed is forced to move or flow, it will ‘dilate’, i.e. the volume occupied by the bed will increase. This arises because the powder particles become less tightly packed and there is an increase in the air spaces or voids between them. Under these circumstances there is the potential for the powder particles to pass through the void spaces created either under gravitational forces (e.g in a tumbling mixer) or by forced movement (e.g in a fluidized bed). Mixing of individual particles in this way is referred to as diffusive mixing.
All three mixing mechanisms are likely to occur in a mixing operation. Which mechanism predominates and the extent to which each occurs will depend on the mixer type, mixing process conditions (mixer load, speed, etc.), particle characteristics and flowability of the components of the powder.
Liquids
The three main mechanisms by which liquids are mixed are bulk transport, turbulent mixing and molecular diffusion.
Bulk transport is analogous to the convective mixing of powders and involves the movement of a relatively large amount of material from one position in the mix to another, e.g. due to a mixer paddle. It too tends to produce a large degree of mixing fairly quickly, but leaves the liquid within the moving material unmixed.
Turbulent mixing arises from the haphazard movement of molecules when forced to move in a turbulent manner. The constant changes in speed and direction of movement mean that induced turbulence is a highly effective mechanism for mixing. Within a turbulent fluid there are, however, small groups of molecules moving together as a unit, referred to as eddies. These eddies tend to reduce in size and eventually break up, being replaced by new eddies. Turbulent mixing alone may therefore leave small unmixed areas within the eddies and in areas near the container surface which will exhibit streamlined flow (see Chapter 6). Mixing of individual molecules in these regions will occur by the third mechanism, which is molecular diffusion (analogous to diffusive mixing in powders). This will occur with miscible fluids wherever a concentration gradient exists and will eventually produce a well-mixed product, although considerable time may be required if this is the only mixing mechanism. In most mixers all three mechanisms will occur, bulk transport and turbulence arising from the movement of a stirrer or mixer paddle set at a suitable speed.
Powder segregation (demixing)
Segregation is the opposite effect to mixing, i.e. components tend to separate out. This is very important in the preparation of pharmaceutical products because if it occurs, an already formed random mix may change to a non-random mix, or a random mix may never be achieved. Care must be taken to avoid segregation occurring during handling after powders have been satisfactorily mixed, e.g. during transfer to filling machines or in the hopper of a tablet/capsule/sachet filling machine. Segregation will cause an increase in content variation in samples taken from the mix, i.e. it will result in a reduction in the quality of the mix and may cause a batch to fail a uniformity of content or uniformity of dosage units test. If segregation of granules occurs in the hopper of a filling machine, an unacceptable variation in weight may result.
Segregation arises because powder mixes encountered in practice are not composed of monosized spherical particles but contain particles that differ in size, shape, density and surface properties. These variations in particle properties mean that they will tend to behave differently when forced to move and hence tend to separate. Particles exhibiting similar properties tend to congregate together, giving regions in the powder bed which have a higher concentration of a particular component. Segregation is more likely to occur, or may occur to a greater extent, if the powder bed is subjected to vibration and when the particles have greater flowability.
Particle size effects
Differences in the particle sizes of components of a formulation are the main cause of segregation in powder mixes in practice. Smaller particles tend to fall through the voids between larger particles and thus move to the bottom of the mass. This is known as percolation segregation. It may occur in static powder beds if the percolating particles are small enough to fall into the void spaces between larger particles, but occurs to a greater extent as the bed ‘dilates’ on being disturbed. Domestically, percolation segregation is often observed in cereal packets or jars of coffee where the smaller ‘particles’ congregate towards the bottom of the container.
Percolation can occur whenever a powder bed containing particles of different size is disturbed in such a way that particle rearrangement occurs, e.g. during vibration, stirring or pouring.
During mixing, larger particles will tend to have greater kinetic energy imparted to them (owing to their larger mass) and therefore move greater distances than smaller particles before they come to rest. This may result in separation of particles of different size; an effect referred to as trajectory segregation. This effect, along with percolation segregation, accounts for the occurrence of the larger particles at the edge of a powder heap when it is poured from a container.
During mixing, or when a material is discharged from a container, very small particles (‘dust’) in a mix may tend to be ‘blown’ upwards by turbulent air currents as the mass tumbles, and remain suspended in the air. When the mixer is stopped or material discharge is complete, these particles will sediment and subsequently form a layer on top of the coarser particles. This is called eluthation segregation and is also referred to as dusting out or fluidization segregation.
Particle density effects
If components are of different density, the more dense particles will have a tendency to move downwards, even if their particle sizes are similar. Trajectory segregation may also occur with particles of the same size but different densities due to their difference in mass. The effect of density on percolation segregation may be potentiated if the denser particles are also smaller. Often materials used in pharmaceutical formulations have similar densities and density effects are not generally too important. An exception to this is in fluidized beds, where density differences often have a greater adverse effect on the quality of the mix than particle size differences.
Particle shape effects
Spherical particles exhibit the greatest flowability and therefore are more easily mixed, but they also segregate more easily than non-spherical particles. Irregular or needle-shaped particles may become interlocked, decreasing the tendency to segregate once mixing has occurred. Non-spherical particles will also have a greater surface area to weight ratio (specific surface area), which will tend to decrease segregation by increasing any cohesive effects (greater contact surface area) but will increase the likelihood of ‘dusting out’.
It should be remembered that the particle size distribution and particle shape may change during processing (due to attrition, aggregation, etc.) and therefore the tendency to segregate may also change.
Non-segregating mixes will improve with continued increases in mixing time, as shown in Figure 11.3. This may not, however, occur for segregating mixes, where there is often an optimum mixing time. This arises since the factors causing segregation generally require a longer time to take effect than the time needed to produce a reasonable degree of mixing. During the initial stages of the process, the rate of mixing is greater than the rate of demixing. After a period of time, however, the rate of demixing may predominate until eventually an equilibrium situation will be reached where the two effects are balanced. This is illustrated in Figure 11.4 which demonstrates that, if factors exist which may cause segregation, then a random mix will not be achieved and there may be both an optimum mixing time and a time range over which an acceptable mix can be produced.
Approaches to minimize segregation
If segregation is a problem with a formulation there are a number of approaches that may be attempted to rectify the situation. These include the following:
Ordered mixing
It would be expected that a mix composed of very small and much larger particles would segregate because of the size differences. Sometimes, however, if one powder is sufficiently small (micronized) it may become adsorbed onto ‘active sites’ on the surface of a larger ‘carrier’ particle and exhibit a great resistance to being dislodged. This has the effect of minimizing segregation while maintaining good flow properties. It was first noticed by Travers & White (1971) during the mixing of micronized sodium bicarbonate with sucrose crystals when the mixture was found to exhibit minimal segregation. The phenomenon is referred to as ordered mixing, as the particles are not independent of each other and there is a degree of order to the mix. If a carrier particle is removed then some of the adsorbed smaller particles will automatically be removed with it. Ordered mixing has also been used in the production of dry antibiotic formulations to which water is added before use to form a liquid or syrup product. In these cases the antibiotic in fine powder form is blended with, and adsorbed onto the surface of, larger sucrose or sorbitol particles (Nikolakakis & Newton 1989).
Ordered mixing probably occurs to a certain extent in every pharmaceutical powder mix due to interactions and cohesive/adhesive forces between constituents. It is most likely to occur when smaller particles exist, as these have a high specific surface area and thus the attractive forces holding the particles to the adsorption site are more likely to be greater than the gravitational forces trying to separate the components.
Pharmaceutical powder mixes are therefore likely to be partly ordered and partly random, the extent of each depending on the component properties. With an ordered mix, it may be possible to achieve a degree of mixing which is superior to that of a random mix which may be beneficial for potent drugs.
Ordered mixing has been shown to be important in direct-compression tablet formulations (Chapter 30) in preventing segregation of drug from direct compression bases.
Dry powder inhaler formulations also utilize ordered mixing to deliver drugs to the lungs (Chapter 37). In this case, the drug needs to be in a micronized form in order to reach its site of action. By adsorbing the drug onto larger carrier particles (usually lactose), it is possible to manufacture a product which will provide an even dosage on each inhalation.
Segregation in ordered mixes
Although ordered mixes can reduce or prevent segregation, it may still occur if:
With an ordered mix, particles may be dislodged if the mix is subjected to excessive vibration. The extent to which this occurs depends on the forces of attraction between the components and therefore on how tightly the adsorbed particles are attached to the surface. The orientation of the particles is also important, particles protruding out from the surface being more likely to be dislodged than those lying parallel to the surface.
Mixing of powders
Practical considerations
When mixing formulations in which there is a relatively low proportion of active ingredient(s), a more even distribution may be obtained by sequentially building up the amount of material in the mixer. This may be achieved by initially mixing the active component(s) with an approximately equal volume of diluent(s). Further amounts of diluents, equal to the amount of material in the mixer, can then be added and mixed, the process being continued until all material has been added. It may be more appropriate to preblend the active component with a diluent in a smaller mixer prior to transferring it to the main mixer in cases where the amount of active ingredient is very low.
Care must be taken to ensure that the volume of powder in the mixer is appropriate, as both over- and underfilling may significantly reduce mixing efficiency. In the case of overfilling, for example, sufficient bed dilation may not take place for diffusive mixing to occur to the required extent or the material may not be able to flow in a way that enables shear mixing to occur satisfactorily. Underfilling may mean the powder bed does not move in the required manner in the mixer or that an increased number of mixing operations may be needed for a batch of material.
The mixer used should produce the mixing mechanisms appropriate for the formulation. For example, diffusive mixing is generally preferable if potent drugs are to be mixed, and high shear is needed to break up aggregates of cohered material and ensure mixing at a particulate level. The impact or attrition forces generated if too-high shear forces are used may, however, damage fragile material and thus produce fines. The mixer design should be such that it is dust tight, can be easily cleaned and the product can be fully discharged. These features reduce the risk of cross-contamination between batches and protect the operator from the product.
In order to determine the appropriate mixing time, the process should be checked by removing and analysing representative samples after different mixing intervals. This may also indicate if segregation is occurring within the mixer and whether problems could occur if the mixing time is extended.
When particles rub past each other as they move within the mixer, static charges will be produced. These tend to result in ‘clumping’ and a reduction in diffusive mixing and cause material to adhere to machine or container surfaces. To avoid this, mixers should be suitably earthed to dissipate the static charge and the process should be carried out at a relative humidity greater (although not excessively) than approximately 40%.
Powder-mixing equipment
Tumbling mixers/blenders
Tumbling mixers are commonly used for mixing/blending granules or free-flowing powders. There are many different designs of tumbling mixer, e.g. double-cone, twin-shell, cube, Y-cone and drum mixers, some of which are shown diagrammatically in Figure 11.5. It is now common to use intermediate bulk containers (IBCs) as both the mixer bowl and to either feed the hopper of a tablet or a capsule machine, or act as the hopper itself. The shape of an IBC used for this purpose is illustrated in Figure 11.6.
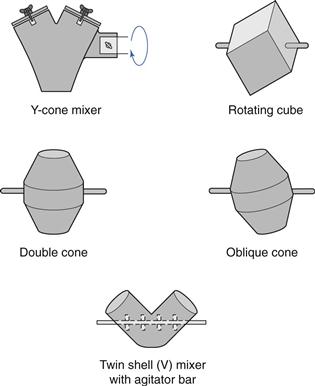
Fig. 11.5 Different designs of tumbling mixers.
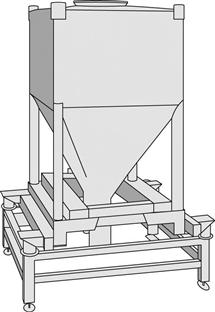
Fig. 11.6 Typical intermediate bulk container.
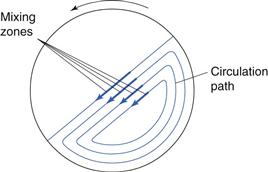
Mixing containers are generally mounted so that they can be rotated about an axis. When operated at the correct speed, the tumbling action indicated in Figure 11.7 is achieved. Shear mixing will occur as a velocity gradient is produced, the top layer moving with the greatest velocity and the velocity decreasing as the distance from the surface increases. When the bed tumbles it dilates, allowing particles to move downwards under gravitational force, and so diffusive mixing occurs. Most mixing will occur towards the surface of the bed where the velocity gradients are highest and the bed is most dilated. Too high a rotation speed will cause the material to be held on the mixer walls by centrifugal force and too low a speed will generate insufficient bed expansion and little shear mixing. Addition of ‘prongs’, baffles or rotating bars will also cause convective mixing (e.g. the V-mixer with agitator bar in Fig. 11.5).
Tumbling mixers are available to mix from approximately 50 g, e.g. for laboratory-scale development work, to over 100 kg at a production scale. The material typically occupies about a half to two-thirds of the mixer volume. The rate at which the product is mixed will depend on the mixer geometry and rotation speed since they influence the movement of the material in the mixer.
Tumbling mixers are good for free-flowing powders/granules but are less effective for cohesive/poorly flowing powders because the shear forces generated are usually insufficient to break up any aggregates. Care also needs to be taken if there are significant differences in particle size present since segregation is likely to occur. A common use of tumbling mixers is in the blending of lubricants, glidants or external disintegrants with granules prior to tableting.
Tumbling mixers can also be used to produce ordered mixes, although the process is often slow because of the cohesiveness of the adsorbing particles.
The Turbula shaker-mixer (WAB, Switzerland) is a more sophisticated form of tumbling mixer which utilizes inversional motion in addition to the rotational and translational motion of traditional tumbling mixers. This leads to more efficient mixing and makes it less likely that material of different size and density will segregate.
High-speed mixer-granulators
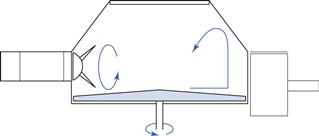
In pharmaceutical product manufacture it is often preferable to use one piece of equipment to carry out more than one function. An example of this is the use of a mixer-granulator (one design of which is shown diagrammatically in Fig. 11.8). As the name suggests, it can both mix and granulate a product, thus removing the need to transfer the product between pieces of equipment and thereby reducing the opportunity for segregation to occur. The centrally mounted impeller blade at the bottom of mixer rotates at high speed, throwing the material towards the mixer bowl wall by centrifugal force. The material is then forced upwards before dropping back down towards the centre of the mixer. The participate movement within the bowl tends to mix the components quickly owing to high shear forces (arising from the high velocity) and the expansion in bed volume which allows diffusive mixing. Once mixed, granulating agent can be added and granules formed in situ using a slower impeller speed and the action of the side-mounted chopper blade. Further details of granule production using this method can be found in Chapter 28.
Because of the high-speed movement within a mixer-granulator, care needs to be taken if the material being mixed fractures easily. This, and the problems associated with overmixing of lubricants, means that this type of mixer is not normally used for blending lubricants.
Fluidized-bed mixers
The main use of fluidized-bed equipment is in the drying of granules (Chapter 29) or the coating of multiparticulates (Chapter 32). Fluidized-bed equipment can, however, be used to mix powders prior to granulation in the same bowl. This is discussed in Chapter 28.
Agitator mixers
This type of mixer depends on the motion of a blade or paddle through the product, and hence the main mixing mechanism is convection. Examples include the ribbon mixer and the planetary mixer.
In the ribbon mixer (Fig. 11.9), mixing is achieved by the rotation of helical blades in a hemispherical trough. ‘Dead spots’ are difficult to eliminate in this type of mixer and the shearing action caused by the movement of the blades may be insufficient to break up drug aggregates. The mixer does, however, mix poorly flowing material and is less likely to cause segregation than a tumbling mixer.

Fig. 11.9 Ribbon agitator powder mixer.
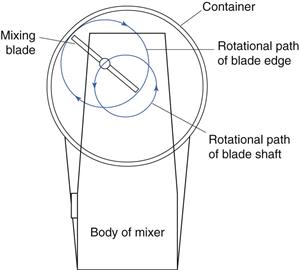
A drawing of an industrial planetary mixer is shown in Figure 11.10. Similar designs are used for both powder and semi-solid mixing. The mixing bowl is shown in the lowered position for filling and emptying. The bowl is raised up to the mixing blade for the mixing process. The mixing blade is set off centre and is carried on a rotating arm. It therefore travels round the circumference of the mixing bowl while simultaneously rotating around its own axis (Fig. 11.11). This is therefore a double rotation similar to that of a spinning planet around the sun – hence the name – and is designed so that the blade covers all the volume of the mixer.
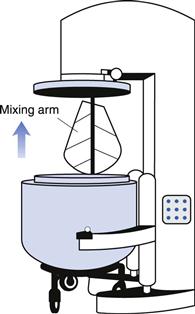
Fig. 11.10 Planetary mixer for powders and semi-solids.
Scale-up of powder mixing
The extent of mixing achieved at a small laboratory scale during development work may not necessarily be mirrored when the same formulation is mixed at a full production scale, even if the same mixer design is used for both. Often, mixing efficiency and the extent of mixing are improved on scale-up owing to increased shear forces. This is likely to be beneficial in most cases, although when blending lubricants care is needed to avoid overlubrication which may, for example, lead to soft tablets and delayed disintegration and dissolution.
Problems associated with a deficiency of some of the components of a formulation, which have been encountered at a production scale but not in development work, have been traced to adsorption of a minor constituent (e.g. a drug or colourant) onto the mixer wall or mixing blade.
Drug particle characteristics may also change when the drug is manufactured on a large scale. This in turn may affect the movement of the particles in the mixer and the interaction with other components and hence the tendency to mix and segregate.
The optimum mixing time and conditions should therefore be established and validated at a production scale so that the appropriate degree of mixing is obtained without segregation, overlubrication or damage to component particles. Minimum and maximum mixing times which give a satisfactory product should be determined, if appropriate, so that the ‘robustness’ of the mixing process is established.
Mixing of miscible liquids and suspensions
Mobile liquids with a low viscosity are easily mixed with each other. Similarly, solid particles are readily suspended in mobile liquids though the particles are likely to settle rapidly when mixing is discontinued. Viscous liquids are more difficult to stir and mix but they reduce the sedimentation rate of suspended particles (discussed further in Chapter 26).
Mixers for miscible liquids and suspensions
Propeller mixers
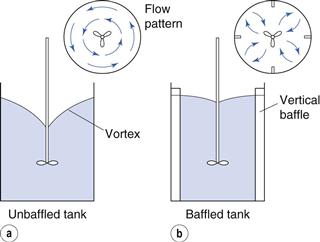
A common arrangement for medium-scale fluid mixing is a propeller-type stirrer which is often used clamped to the edge of a vessel. A propeller has angled blades, which cause the circulation of the fluid in both an axial and radial direction. An off-centre mounting discourages the formation of a vortex, which may form when the stirrer is mounted centrally. A vortex forms when the centrifugal force imparted to the liquid by the propeller blades causes it to back up round the sides of the vessel and form a depression around the shaft. As the speed of rotation is increased, air may be sucked into the fluid due to the formation of a vortex; this can cause frothing and possible oxidation (Fig. 11.12a). Another method of suppressing a vortex is to fit vertical baffles into the vessel. These divert the rotating fluid from its circular path into the centre of the vessel where the vortex would otherwise form (Fig. 11.12b).
The ratio of the diameter of a propeller stirrer to the diameter of the vessel is commonly 1 : 10 to 1 : 20 and it typically operates at speeds of 1–20 revolutions/second. The propeller stirrer depends for its action on a satisfactory axial and radial flow pattern which will not occur if the fluid is too viscous. There must be a fast flow of fluid towards the propeller which can only occur if the fluid is mobile.
Turbine mixers
A turbine mixer may be used for more viscous fluids and a typical construction is shown in Figure 11.13. The impeller has four flat blades surrounded by perforated inner and outer diffuser rings. The rotating impeller draws the liquid into the mixer ‘head’ and forces the liquid through the perforations with considerable radial velocity, sufficient to overcome the viscous drag of the bulk of the fluid. One drawback is the absence of an axial component, but a different head with the perforations pointing upwards can be fitted if this is desired. As the liquid is forced through the small orifices of the diffuser rings at high velocity, large shear forces are produced. When mixing immiscible liquids, if the orifices are sufficiently small and velocity sufficiently high, the shear forces produced enable the generation of droplets of the dispersed phase which are small enough to produce stable dispersions (water-in-oil or oil-in-water). Turbine mixers of this type (homogenizers) are therefore often fitted to vessels used for the large-scale production of emulsions and creams.
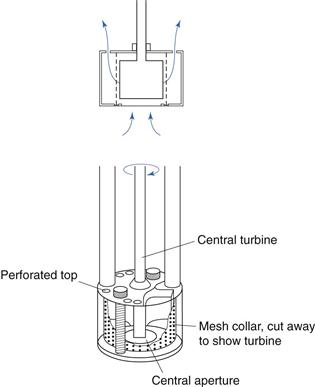
Fig. 11.13 Turbine mixer.
Turbine-type mixes will not cope with liquids of very high viscosity since the material will not be drawn into the mixer head. These liquids are best treated as semi-solids and handled in the same equipment as used for such materials (see below).
In-line mixers
As an alternative to mixing fluids in batches in vessels, mobile miscible components may be fed through an ‘inline’ mixer designed to create turbulence in a flowing fluid stream. In this case, a continuous mixing process is possible.
Mixing of semi-solids
The problems that arise during the mixing of semi-solids (ointments and pastes) stem from the fact that, unlike liquids, semi-solids will not flow easily. Material that finds its way to a ‘dead spot’ will remain there. For this reason, suitable mixers must have rotating elements with narrow clearances between themselves and the mixing vessel wall, and they must produce a high degree of shear mixing since diffusion mixing cannot occur.
Mixers for semi-solids
Planetary mixers
This type of mixer is commonly found in the domestic kitchen (e.g. Kenwood type mixers) and larger machines which operate on the same principle are used in the pharmaceutical industry (shown in Fig. 11.10). When used for the mixing of semi-solids, they are designed so that there is only a small clearance between the vessel and the paddle in order to ensure sufficient shear. However, ‘scraping down’ of the bowl is usually necessary several times during a run to mix the contents well, since some materials are forced to the top of the bowl.
Double planetary mixers that move material by rotating two identical blades (either rectangular or helical) on their own axes as they orbit on a common axis are often used for mixing highly viscous semi-solid materials. As the blades continuously advance along the periphery of the mixer vessel, they remove material from the walls and transport it towards the interior.
Sigma blade mixers
This robust mixer will deal with stiff pastes and ointments and depends for its action on the close intermeshing of the two blades which resemble the Greek letter Σ in shape – hence the name. The clearance between the blades and the mixing trough is kept small by the design shown in Figure 11.14.
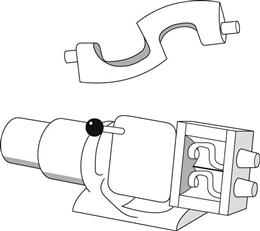
Fig. 11.14 Sigma blade mixer.
Further treatment of semisolid dispersions
It is very difficult, using primary mixers, to completely disperse powder particles in a semi-solid base so that they are invisible to the eye. The mix is usually subjected to the further action of a roller mill or colloid mill so as to ‘rub out’ these particles by the intense shear generated by rollers or cones set with a very small clearance between them.
References
1. Bakeev KA. Process Analytical Technology. Chichester, UK: John Wiley & Sons; 2010.
2. Ciurczak EW, Drennen JK. Pharmaceutical and medical applications of near-infrared spectroscopy. New York: Marcel Dekker; 2002.
3. Nikolakakis N, Newton M. Solid state adsorption of antibiotics onto sorbitol. Journal of Pharmacy and Pharmacology. 1989;41:145–148.
4. Travers DN, White RC. The mixing of micronized sodium bicarbonate with sucrose crystals. Journal of Pharmacy and Pharmacology. 1971;23:260S–261S.
5. Venables HJ, Wells JI. Powder mixing. Drug Development and Industrial Pharmacy. 2001;27:599–612.
Bibliography
1. Harnby N, Edwards MF, Nienow AW. Mixing in the Process Industries. 2nd edn Oxford: Butterworth-Heinemann; 1997.
2. Kaye BH. Powder Mixing. London: Chapman and Hall; 1997.
3. Levin M. Pharmaceutical Process Scale-up. 3rd edn London: Informa Healthcare; 2011.
4. Miyanami K. Mixing. In: Masuda H, Higashitani K, Yoshida H, eds. Powder Technology Handbook. 3rd edn New York: Marcel Dekker; 1996.
5. Paul EL, Atiemo-Obeng VA, Kresta SM. Handbook of Industrial Mixing – Science and Practice. New Jersey: John Wiley and Sons; 2004.
6. Staniforth JN. Advances in powder mixing and segregation in relation to pharmaceutical processing. International Journal of Pharmaceutical Technology and Product Manufacture. 1982;3(Suppl):1–12.

