Chapter 7 Methods in natural product chemistry
In Chapter 6 we looked at the initial process in the selection of biomass (plant or microbe), its extraction and screening in different formats (high- and low-throughput screening), the isolation of the active components (bioassay-guided isolation) and the evaluation of the drug lead in clinical trials to the final drug. In this chapter we deal with the isolation process in more detail and cover the techniques that are used to isolate and characterize an active compound using chromatographic and spectroscopic techniques.
Bioassay-guided isolation
Bioassay-guided isolation is the physical process used to isolate biologically active chemicals from a natural source. Many of the chemicals described in Chapter 6 are from plant sources, but microbes are also an exceptionally valuable source of chemical diversity, in particular the filamentous bacteria (the Actinomycetes) of which the antibiotic-producing genus Streptomyces is the most widely studied for bioactive compounds. The fungi are also important and microbiologists spend time working in biota-rich environments such as the Amazon basin collecting, typing (identifying) and culturing samples for shipment back to the laboratory to be screened for bioactivity. As with plants, this process can be highly complicated, particularly in the identification of fungi, of which there may be potentially millions of new species waiting to be described in remote locations. This exercise is extremely worthwhile, as it is highly likely that new species will contain new chemistry that may have interesting bioactivity when fully screened. This will be particularly relevant for the Basidiomycetes, a large group of fruiting fungi that produce a mushroom cap (basidium) and are sometimes difficult to grow in solution fermentation.
Preparation and extraction
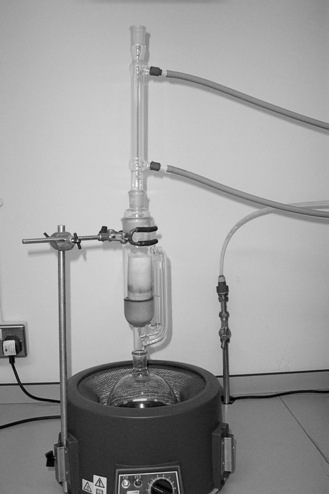
The most widely used method for extraction of plant natural products is Soxhlet extraction (Fig. 7.1). This technique uses continuous extraction by solvents of increasing polarity. The biomass is placed in a Soxhlet thimble constructed of filter paper, through which solvent is continuously refluxed. The Soxhlet apparatus will empty its contents into the round-bottomed flask once the solvent reaches a certain level. As fresh solvent enters the apparatus by a reflux condenser, extraction is very efficient and compounds are effectively drawn into the solvent from the biomass due to their low initial concentration in the solvent. The method suffers from the same drawbacks as other hot extraction methods (possible degradation of products), but it is the best extraction method for the recovery of big yields of extract. Moreover, providing biological activity is not lost on heating, the technique can be used in drug lead discovery.
If it is known that certain classes of compounds, such as acids or bases, are present in the biomass, they can be extracted using a tailored protocol. The most common group of natural products that are extracted in this manner are the alkaloids (see Chapter 6 and below), which are often present in plant material as salts. A brief outline of how these basic compounds may be extracted is as follows:
1. Alkaloids can be recovered from their salts by making the dry powdered plant material alkaline with aqueous ammonia. This leaves the alkaloids as free bases that are no longer ionic salts and are much more soluble in organic solvents such as dichloromethane or ethyl acetate.
2. This increased solubility in organic solvents allows partitioning of the free bases into ethyl acetate or dichloromethane, which can then be separated from the aqueous ammonia layer in a separating funnel as these solvents form immiscible layers.
3. The dichloromethane solution will contain the free bases, which can be extracted with aqueous acid, for example by extracting three times with 2 M hydrochloric acid, and the alkaloids will transfer from the organic phase to the aqueous phase as hydrochloride salts. The remaining dichloromethane layer can be tested using a specific colour test for alkaloids (e.g. Dragendorff’s reagent) to ensure that all of the alkaloids have been transferred to the acidic aqueous layer.
4. The acidic layer can then be basified, which results in the precipitation of the alkaloids (which are no longer salts and therefore no longer soluble in aqueous media) and can be extracted back into an organic solvent (ethyl acetate or dichloromethane).
Isolation methods
Ion-exchange chromatography
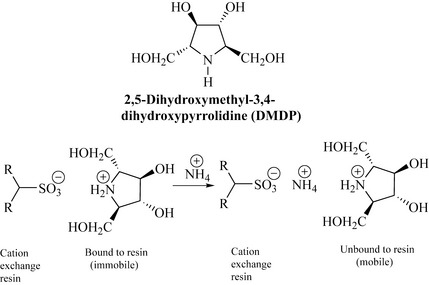
An example of the technique is shown in Fig. 7.2. 2,5-Dihydroxymethyl-3,4-dihydroxypyrrolidine (DMDP) from Lonchocarpus sericeus (Fabaceae) is a nematocidal polyhydroxylated alkaloid (PHA), and also inhibits insect α- and β-glucosidases. Compounds of this type are bases and form cations in acidic solutions. When added to a cation exchanger [e.g. Amberlite CG-120, which has a sulfonic acid bound to the resin which can exchange its proton (cation)], the DMDP cations are retained (bound) by the cation exchanger and protons are displaced. If the cation exchanger is then eluted with a solution containing a stronger cation such as  (e.g. from 0.2 M NH4OH), then the DMDP cation is desorbed from the exchanger and is unbound and mobile. This affinity can be used to separate such alkaloids from acidic (anionic) or neutral components which would not be retained by the cation exchanger and may be washed from the resin by water.
Biotage™ flash chromatography
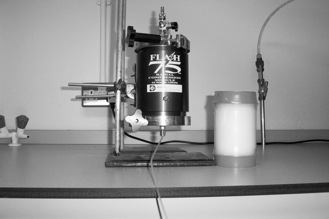
Biotage™ flash chromatography may be used for quick efficient separations. This employs pre-packed solvent-resistant plastic cartridges (Fig. 7.3), which contain the sorbent (silica, alumina, C18, HP-20, or ion exchange resin). These cartridges are introduced into a radial compression module (the metal cylinder in Fig. 7.3), which pressurizes the cartridge and sorbent radially. This results in a very homogeneous packed material (sorbent), reduces the possibility of solvent channelling when the system is run and minimizes void spaces on the column head.
Thin-layer chromatography
• It is cost-effective compared with instrumental methods and requires little training or knowledge of chromatography
• Easy scale-up from analytical to preparative mode with quick isolation of milligram to gram amounts of product
• Flexibility of choice of mobile and stationary phases
• A separation may be readily optimized to ‘zero in’ on one component and methods may be quickly developed
• Practically any separation can be achieved with the correct mobile and stationary phases
• A large number of samples may be analysed or separated simultaneously.
Isolation strategy
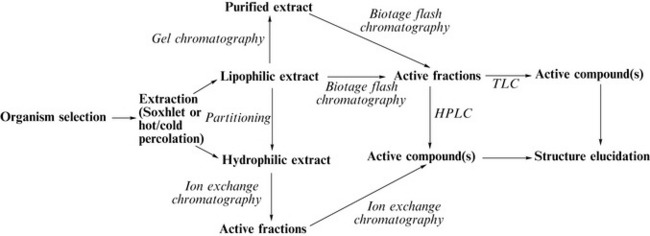
How do the isolation methods described above fit together? Figure 7.4 gives a general isolation protocol starting with selection of biomass (e.g. plant or microbe), which is then extracted using a Soxhlet apparatus, cold or hot percolation or supercritical fluid extraction. Hydrophilic extracts will then typically undergo ion exchange chromatography with bioassay of generated fractions. A further ion exchange method of bioactive fractions would yield pure compounds, which could then be submitted for structure elucidation. Lipophilic extracts could initially be partitioned to generate a further hydrophilic fraction which could be dealt with by ion exchange chromatography as described above.
Structure elucidation
Mass spectrometry
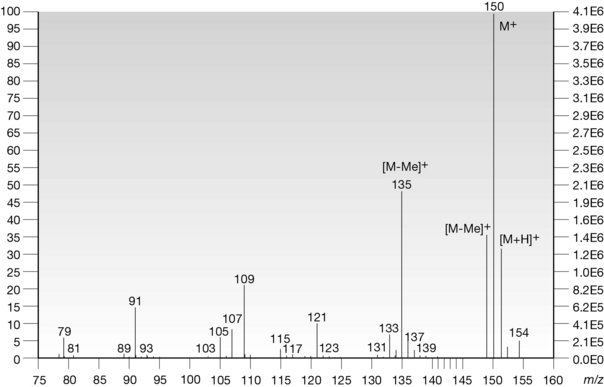
Compound X was submitted to FAB-MS; the spectrum is shown in Fig. 7.5. The scale on the x-axis is the mass (m) to charge (z) ratio (m/z). As compound X readily forms single ions, m/z is in effect m/1 and therefore directly related to the weight of fragments and, in the case of the molecular ion, the molecular weight of the compound.
NMR spectroscopy
1H NMR spectroscopy
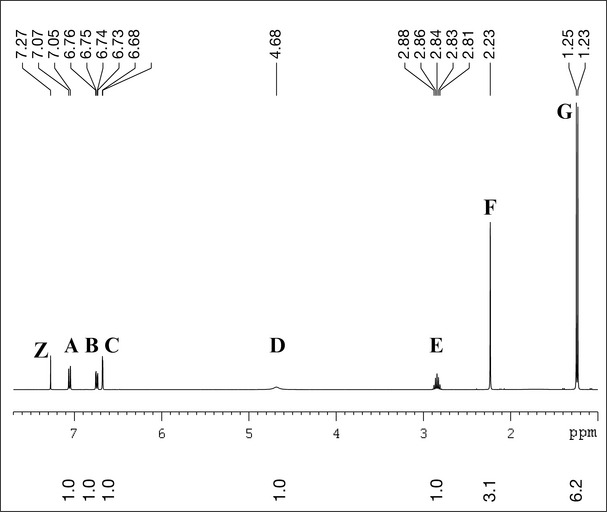
The next step in this process is the recording of a 1H NMR spectrum (Fig. 7.6). This will indicate the number of hydrogen atoms associated with a particular group (integration) and how shielded or deshielded that group is. Shielding and deshielding occur due to the presence of groups that are either electron-withdrawing (deshielding) or electron-donating (shielding).
Expansion of the aromatic region 6.6–7.1 ppm (Fig. 7.7) shows the coupling pattern of the aromatic ring. Inspection of this area allows measurement of coupling constants, referred to as J values. Taking peak A, which is a doublet (two lines), as an example, this is done by subtracting the lower ppm value for this peak from the higher ppm value and multiplying the difference by the field strength at which this experiment was measured (400 MHz in this case). This gives:
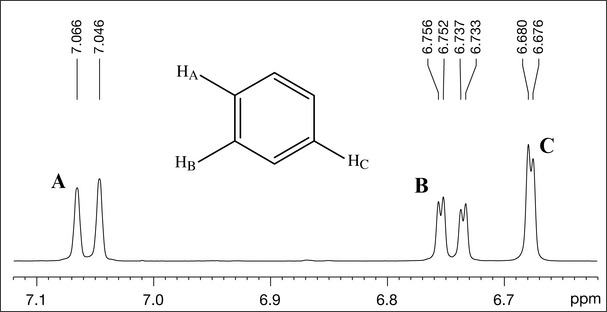

The size of this coupling constant indicates that peak A is coupled to another proton which is ortho to itself (ortho coupling constants are of the order of 6–9 Hz). Peak B is a double doublet (and has four lines) with two couplings (8 and 1.6 Hz), indicating that this is the proton which is ortho to peak A (it has the same coupling constant of 8 Hz) and the smaller coupling constant (1.6 Hz) is indicative of a meta coupling to another proton (meta coupling constants are typically 1–2 Hz). Peak C at 6.67 ppm is a doublet (1.6 Hz) which has the same coupling constant as one of those for peak B, indicating that this is the proton that is meta to B. This part of the spectrum therefore tells us that we have an aromatic ring with three protons attached to it in the 1, 2 and 4 positions (Fig. 7.7).
13C NMR spectroscopy
The proton spectrum has revealed much about the number of protons present and their chemical environments – i.e. whether they are shielded or deshielded by electron-donating or electron-withdrawing groups, respectively. The next step is the acquisition of a 13C NMR spectrum which will give further information regarding the environment of the different groups and the number of carbons present. Two 13C NMR spectra of compound X are shown in Fig. 7.8.
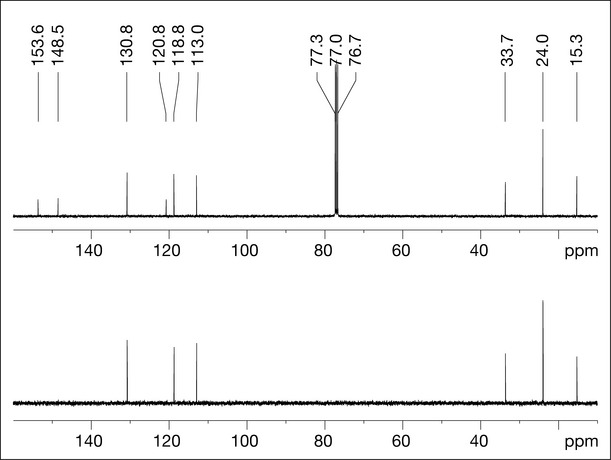
The top spectrum is the broadband decoupled spectrum which shows all of the carbons present; the carbons appear as singlets due to proton decoupling. The top spectrum of compound X was recorded in CDCl3, which occurs as three lines at 77.0 ppm. There are only nine carbons evident, which might be confusing as we know from the mass spectrum that compound X should contain 10 carbons. However, as the 1H spectrum has two coincident methyl groups, it is possible that there are two carbons associated with the peak at 24 ppm. If both methyl groups were in the same environment (as they are in an isopropyl group), then they would occur at the same position in the spectrum. As with the proton spectrum, the carbon signals occur over a large range, which is again determined by whether the carbons are deshielded (high ppm value) or shielded (low ppm value). The lower 13C spectrum has been produced by a special experiment called DEPT-135, which lacks the solvents signals, but, more importantly, it only shows carbons that have protons attached to them (CH, CH2 and CH3). As compound X does not have any CH2 groups (there are no groups in the 1H spectrum which integrate for two protons), only CH and CH3 carbons are shown. This is useful as it allows quaternary carbons (carbons with no protons attached) to be identified, and it can be seen that there are three additional aromatic quaternaries in the top spectrum, at 153.6, 148.5 and 120.8 ppm. The range for aromatic carbons is 110–160 ppm. The carbon at 153.6 is highly deshielded and it is possible that this carbon is attached to an oxygen atom (from the OH group in compound X). The three peaks at 130.8, 118.8 and 113.0 are all carbons bearing one proton (CH or methine carbons); these correspond to proton peaks A, B and C in the 1H spectrum (Fig. 7.6). The remaining peaks at 33.7, 24.0 and 15.3 are carbons associated with the multiplet (peak E), two coincident methyl groups (peak G) and a methyl singlet (peak F).
Homonuclear correlation spectroscopy
The next technique that can aid in the structure determination of compound X is COrrelation SpectroscopY (COSY), which reveals couplings between protons that are close (two, three or four bonds distant from each other). It is referred to as a homonuclear (same nuclei, both of which are 1H) two-dimensional technique because the data are displayed in a matrix format with two one-dimensional experiments (1H spectra) displayed on the x– and y-axes (Fig. 7.9). A diagonal series of peaks correspond to the 1H spectrum signals. Peaks that are away from the diagonal (referred to as cross-peaks) indicate coupling between signals.
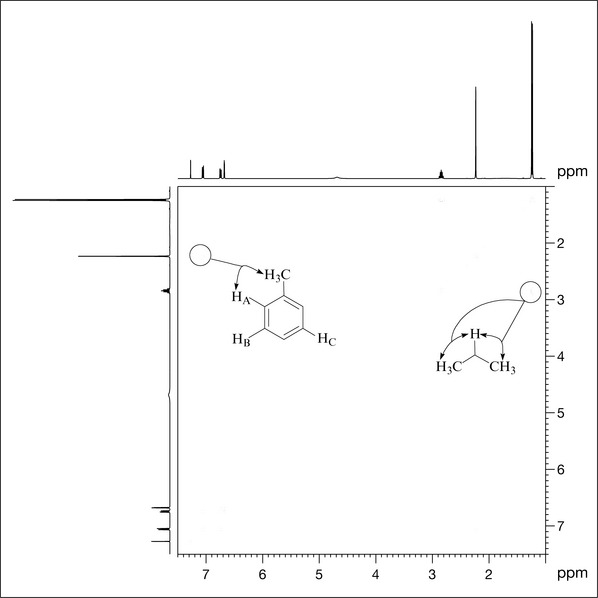
For example, inspection of Fig. 7.9 shows a cross-peak between the signal at 1.23 ppm (coincident methyl groups, G) and the multiplet signal at 2.84 ppm (group E), confirming that they are coupled to each other (implied by the couplings in the 1H spectrum) and that together E and G are an isopropyl group. Additionally, group F (a methyl singlet at 2.23 ppm) shows a coupling to proton A, indicating that the methyl group is ortho to this proton (Fig. 7.9).
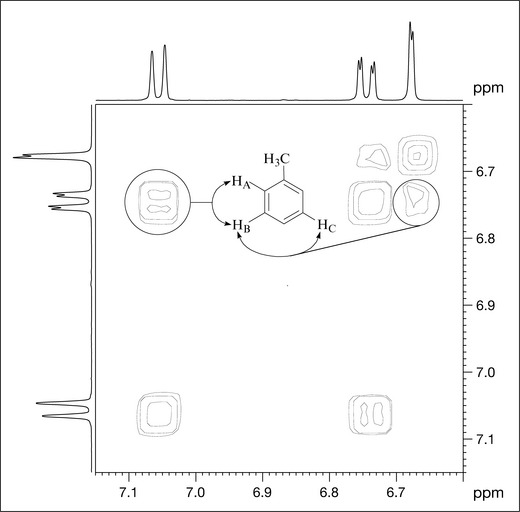
Inspection of an expansion of the aromatic region (Fig. 7.10) provides further support for the coupling pattern already suggested by the 1H spectrum. HA has an ortho coupling to HB and, in addition to coupling to HA, HB has a meta coupling to HC and appears as a double doublet (four lines). This coupling pattern is indicative of a 1,2,4-protonated aromatic ring and confirms the data from the 1H spectrum.
Heteronuclear correlation spectroscopy
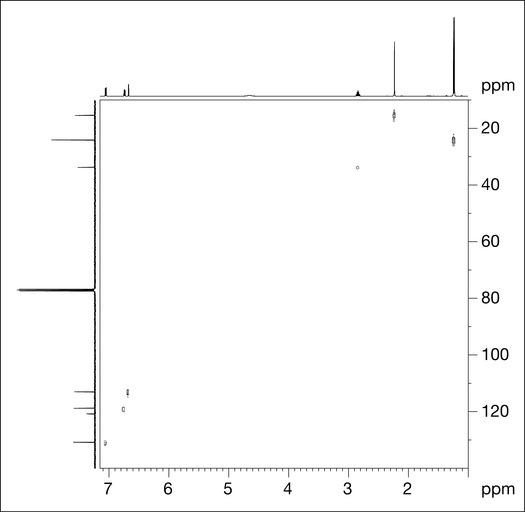
HSQC shows which protons are attached to which carbons. Figure 7.11 shows an HSQC spectrum for compound X from which clear correlations can be seen for protons A–C and E–G with the carbons to which they are attached. Proton D is a proton attached to oxygen (an hydroxyl group), so there is no carbon to correlate to (and therefore no signal). The aromatic protons all correlate to carbons at higher ppm; the aliphatic protons correlate to lower ppm carbons.
HMBC shows correlations between protons and the carbon atoms that are two and three bonds distant; these couplings are referred to as 2 J and 3 J, respectively. The experiment is set to show correlations that occur where the coupling constant between protons and carbons is of the order of 7 Hz. Two bond correlations are not always present in the spectrum as the coupling constant for 2 J correlations may be less or greater than 7 Hz. Figure 7.12 shows the HMBC spectrum for compound X.
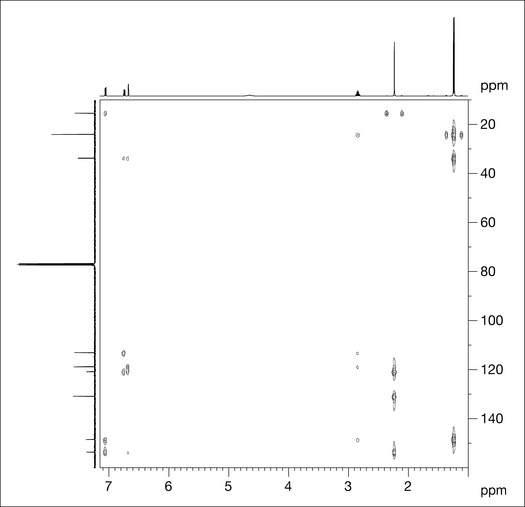
HMBC spectra are highly informative and allow partial structure fragments to be constructed which can enable the full structure elucidation of natural products. The correlations for each proton group of compound X are given in Fig. 7.13.
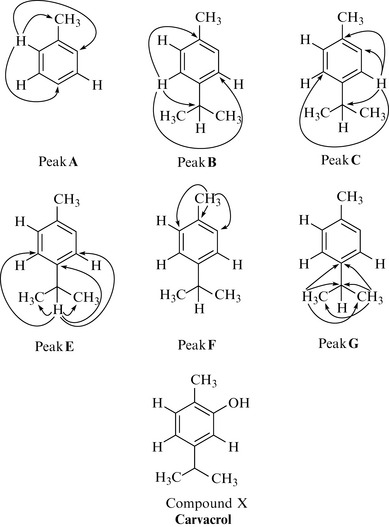
For peak F (3 H singlet protons at 2.23 ppm) there are two correlations that appear equidistant at 15.3 ppm in the carbon domain and are an artifact of the HMBC spectrum (they are in fact the unsuppressed direct correlation between the protons of peak F and the carbon to which they are directly attached; compare with the HSQC spectrum in Fig. 7.11). There are three couplings for peak F: to the carbon attached to proton A, and to two quaternary carbons, one of which is the most downfield carbon (153.6 ppm).
Figure 7.13 shows all of the correlations for each peak. The position of the hydroxyl group has yet to be assigned, but, as there is only one position available on the aromatic ring, the hydroxyl must be placed ortho to the methyl group. This is supported by the fact that the carbon to which this hydroxyl group is attached is the most downfield aromatic quaternary carbon (153.6 ppm), and heteroatoms such as oxygen are known to deshield carbon nuclei (compare the ppm value of this quaternary carbon with other quaternary aromatic carbons in compound X).
A database search indicates that compound X is carvacrol (Fig. 7.13), which is a common component of volatile oils, especially those from plants belonging to the mint family (Lamiaceae) of which Thymus vulgaris is a member.
The industrial approach to natural product drug lead discovery
Natural product libraries
There are a number of benefits to this procedure over conventional HTS and synthetic libraries:
• The isolation chemistry in HTS has always been the slow bottleneck. The process is faster in the library generation which enables decisions about active natural products to be made rapidly.
• All compounds have a defined concentration in the microtitre plate and so the potency of the compound in the assay is known immediately; this is not true with extract screening. Most active extracts may contain one major component with poor activity or, even worse, the least-active extract may have a low concentration of a very potent compound which may be deprioritized.
• Screening a pure compound will give a better assay response, as single components have a cleaner interaction with the biological target and there are no interfering compounds present in the extract (e.g. tannins, which may mask the presence or absence of an active component).
• The dereplication process is more successful with pure compounds and a large amount of data can be acquired.
• Identification of the active compound may be total before screening and this can give useful information on any structure–activity relationships with other screened compounds.
• The whole process is now much quicker; the limiting step is now assay technology, which is itself very rapid.
• Large amounts of pure compounds can be isolated (5–10 mg), so retesting and further assays can be performed quickly without delay in further isolation.
• Most importantly, the cost is less than HTS as the time for discovery of a natural lead is reduced.
Several companies have adopted this approach, notably Hypha Discovery Ltd (http://www.hyphadiscovery.co.uk) who market a fungal natural product library produced using a novel fermentation technique. The company sells (or licences) the library for drug and agrochemical discovery to larger companies. For compounds that are of further interest to the customer, Hypha Discovery can then scale-up the extraction and purification of the compound by large-scale fermentation at their facilities.
Why natural products as drugs?
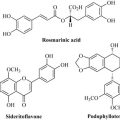
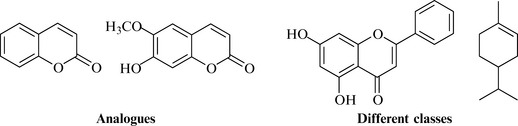
In screening for new bioactive compounds, it is important to access as wide a range of diverse biological specimens as possible because it is thought that this high range of biological diversity mirrors or gives rise to a high degree of chemical diversity (i.e. a wide array of structurally unrelated molecules). Ideally, a drug discovery programme should have access to as many different species as possible from groups such as plants, fungi, filamentous bacteria, corals, sea animals and amphibia. The tropics hold a vast repository of numbers of such species, and there is, therefore, enormous potential to discover new bioactive entities in this region of the world. Using Costa Rica as an example, the Instituto Nacional de Biodiversidad (INBio) has been conducting a national inventory of plants, insects, microbes and animals, and has so far assessed almost 500,000 species. This incredible genetic resource could potentially generate millions of natural products to be assessed for biological activity. Individual species are also adept at producing not only different classes of natural product (e.g. flavonoids and monoterpenes simultaneously), but also analogues of the same natural product class (Fig. 7.14).
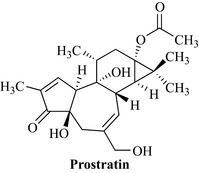
The Convention on Biological Diversity is a treaty between 182 countries to recognize the authority that countries/states have over their genetic resources (see also Chapter 5, p54-55). The treaty recognizes that access to biodiversity, be it plant, microbial or animal, is governed by the sovereign authority of that particular state. This means that it is not possible to acquire biological specimens from an area without ‘prior informed consent’ on ‘mutually agreed terms’ and that, should any commercial benefit arise from collection of biota (e.g. in the discovery of a new drug), then ‘equitable sharing of benefits’ should occur. This is an exceptionally important concept for profit sharing and one that can be highlighted by the example of prostratin (Fig. 7.15) from Homolanthus nutans (Euphorbiaceae).
Balick M.J., Cox P.A. Plants, people and culture: the science of ethnobotany. New York: Scientific American Library; 1996.
Crews P., Rodriguez J., Jaspars M. Organic structure analysis, second ed. Oxford: Oxford University Press; 2009.
Hostettmann K., Marston A., Hostettmann M. Preparative chromatography techniques: applications in natural product isolation, second revised ed. Berlin: Springer-Verlag; 2010.
Sarker S.D., Latif Z., Gray A.I. Natural products isolation. Methods in biotechnology, second ed. Totowa: Humana Press; 2010.
Williams D.H., Fleming I. Spectroscopic methods in organic chemistry, sixth ed. London: McGraw-Hill; 2007.