Measures of volume status in the intensive care unit
Overview
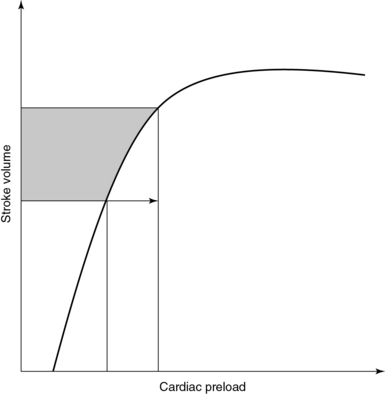
Prescribing fluid therapy is a common therapeutic dilemma in the intensive care unit (ICU); however, different methods of evaluating volume status are available to guide this decision. This chapter discusses these methods briefly. Fluid therapy is of critical importance in the treatment of patients in shock since it may result in improved tissue perfusion and organ function. Administration of fluids is a key feature of “goal-directed” therapy protocols in patients with septic shock inasmuch as early fluid resuscitation was suggested to improve outcomes in such patients.1 Nonetheless, overzealous resuscitation may result in tissue edema and thus impair pulmonary gas exchange, gastrointestinal motility, and wound repair. A negative impact of excessive fluid loading on outcome was demonstrated in patients with sepsis, acute respiratory distress syndrome, and renal failure.2–4 The rationale for fluid administration is the anticipated increase in cardiac output (CO) in accordance with the Frank-Starling mechanism. Starling’s law states that stroke volume (SV) increases in response to increased left ventricular end-diastolic volume or preload (Figure 37-1). Optimal preload corresponds to maximal overlap of actin-myosin fibrils. In healthy subjects, both ventricles are working on the ascending part of the Frank-Starling curve and therefore have a functional reserve in the event of acute stress.5 In critical care patients, however, the ventricles often operate on the flat part of the curve. Hence increased preload does not result in increased SV but may lead to adverse effects such as pulmonary edema. A prudent policy is to identify patients in whom CO increases in response to increased preload (fluid responsive) well before prescribing fluid therapy.
Pressure-related techniques
Measuring volume status is rather sophisticated, whereas determining filling pressure appears to be simpler. Central venous pressure (CVP) or pulmonary artery occlusion pressure (PAOP) can be estimated by inserting a central venous and a pulmonary artery catheter, respectively. In healthy persons, CVP and PAOP should represent right and left ventricular filling pressure, respectively. Ventricular volume and pressure are linked by the volume-pressure curve. Increments in end-diastolic volume result in increased end-diastolic filling pressure. Unfortunately, there is no linear correlation between volume and pressure. Recently, it was demonstrated that both CVP and PAOP failed to predict changes in end-diastolic ventricular volume after the infusion of 3 L of saline into healthy volunteers.6 If this principle does not apply to healthy subjects, it may indeed be of limited value in the ICU. Remarkable changes in ventricular compliance and intrathoracic pressure take place in the critically ill, mainly because most of them are mechanically ventilated and under the influence of vasoactive agents (e.g., inotropes). The impact of these changes on determination of CVP or PAOP is unpredictable. Surely, CVP is not associated with circulating blood volume and does not predict fluid responsiveness.7 Accordingly, determination of PAOP is not recommended as a predictor of fluid responsiveness. Despite the aforementioned considerations, CVP and PAOP are routinely used as measures of volume status in the ICU. Surveys have confirmed that more than 90% of intensivists use CVP to guide fluid therapy.8 The Surviving Sepsis Campaign recommended that septic patients be fluid-resuscitated to a CVP goal of 8 to 15 mm Hg.9 This might be due to the fact that central venous catheters are standard tools in the hands of intensivists. Also, it is not always easy to alter clinical notions that have been shaped in a particular manner over a long period. If CVP is used to guide fluid therapy, single point estimations should not be interpreted in isolation but always in the context of pertinent clinical scenarios.
Static volume-based parameters
Measuring end-diastolic filling volume is challenging, although estimates can be obtained with the transpulmonary thermodilution method. The latter is integrated into the PiCCO system (Pulsion Medical Systems AG, Munich, Germany). After injecting a cold saline bolus via a central line, the temperature is recorded with a large arterial thermistor. Mathematical analysis of the thermodilution curve provides the global end-diastolic volume (GEDV). This virtual volume reflects the volume of all four cardiac chambers in diastole. Several studies have demonstrated that GEDV is superior to filling pressure in estimating fluid responsiveness in various clinical scenarios.10 The main issue is defining normal ranges of GEDV even after it is indexed for body surface area; moreover, GEDV seems to be influenced by age, gender, and left ventricular function.11,12 Thus application of GEDV measurements in an individual patient may be difficult to interpret.
Dynamic changes in arterial waveform
Currently, positive-pressure mechanical ventilation modes are used and are associated with cyclic changes in intrathoracic pressure. During inspiration, intrapleural pressure increases, which results in reduced venous return to the right ventricle (decreased preload). Additionally, a concomitant increase in right ventricular afterload takes place as a result of the increased transpulmonary pressure. Alterations in preload and afterload result in decreased right ventricular SV. The opposite is true for the left ventricle. However, with a short delay because of pulmonary circuit transit time, the reduced right ventricular SV leads to decreased left ventricular filling volume. If the ventricle is operating on the steep part of the Frank-Starling curve, decreased left ventricular SV with maximum depression in the expiration phase will be induced. Hence cyclic changes in SV and subsequently in systolic blood pressure occur in fluid-responsive patients during mechanical ventilation. Measures such as systolic pressure variation (SPV), pulse pressure variation (PPV), and SV variation (SVV) can be determined by sophisticated software analysis of the arterial waveform and pulse contour analysis. A variation threshold of 11% to 13% was reported to predict fluid responsiveness. PPV seems to be superior to SPV and SVV and has a sensitivity of 0.89 and a specificity of 0.88 in identifying fluid-responsive patients.13 Although these measures exhibit higher diagnostic yield than do other hemodynamic markers (e.g., CVP), important limitations exist. Reliable analysis of the arterial waveform in mechanically ventilated patients can be achieved only in a volume control mode. Tidal volume is set to a value of between 8 and 10 mL/kg ideal body weight. Another important requirement is stable sinus rhythm. Arrhythmias, as well as spontaneous breathing, lead to errors in interpretation. Furthermore, the usefulness of arterial waveform analysis in patients under open chest conditions (e.g., heart surgery) remains debatable.
Passive leg-raising test
Evaluating SV and thus alterations in CO to optimize fluid therapy is a routine challenge. Alterations in arterial blood pressure are not a sensitive measure of changes in SV because the former represents one of the late pathophysiologic stages in the temporal order of hemodynamic events that start with alterations in SV and culminate in shifts in urine output.14 Presumably, integration of continuous real-time CO monitoring into routine practice as provided by systems such as the PiCCO or the FloTrac-Vigileo (Edward Lifesciences, Irvine, CA) may provide solutions. Alternatively, ultrasound-based methods may be used.
Ultrasound
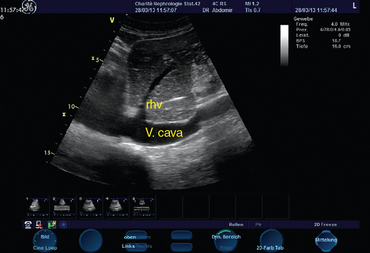
IVC diameter is measured with M-mode via subcostal views. These measurements should be made less than 2 cm from the right atrium (Figure 37-2). The absolute diameter of the IVC may provide a first impression of cardiac preload. Kosiak et al proposed an index (IVC/aortic diameter) for pediatric patients to evaluate volume status15 because absolute diameters appear to be less sensitive. Physicians should be aware of the cyclic changes in intrathoracic pressure during ventilation. In spontaneously breathing patients, inspiration lowers intrathoracic pressure and thereby results in accelerated venous return. The sonographic feature is an inspiratory-related decrease and an expiratory-related increase in IVC diameter. In mechanically ventilated patients the opposite is true because of the application of positive end-expiratory pressure. Lack of variation in IVC diameter during ventilation reflects a poorly compliant vessel and excludes fluid responsiveness. In spontaneously breathing patients, changes in IVC diameter greater than 50% during the respiratory cycle were associated with low CVP.16 In mechanically ventilated patients, IVC variation thresholds indicating fluid responsiveness seem to be lower. Feissel et al expressed the respiratory-related changes in IVC diameter as maximal inspiratory diameter minus minimal expiratory diameter divided by the average value of the two diameters. They found that a 12% increase in IVC diameter during inspiration could predict volume responsiveness with a positive predictive value of 93%.17 Barbier et al used a different index (ΔIVC = (IVCmax “(” IVCmin)/(IVCmin) (100, where IVCmax = maximal IVC diameter, IVCmin = minimal IVC diameter) to demonstrate fluid responsiveness with a sensitivity and specificity of 90% for ΔIVC greater than 18%.18 Similar results have been presented by others.19 In the case of elevated right atrial pressure (e.g., ventricular failure, cardiac tamponade), vena cava diameter does not reflect volume-dependent preload. Also, the method is not reliable in patients with intraabdominal hypertension. Finally, dynamic changes during the respiratory cycle should be evaluated with the patient on volume control ventilation and in sinus rhythm.
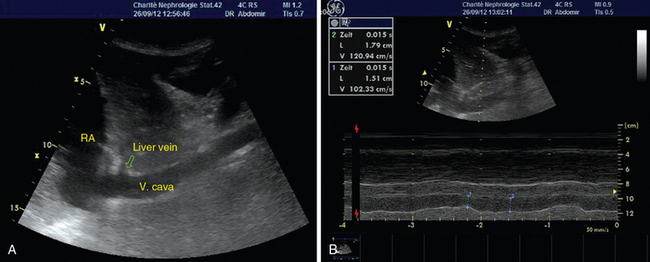
Figure 37-2 Visualization of the inferior vena cava (A) and determination of respiratory-related changes in diameter by M-mode (B).
Although surface ultrasound using low-frequency 2- to 5-MHz microconvex transducers can depict the SVC, the latter is mainly visualized by transesophageal echocardiography (TEE). During mechanical ventilation, SVC diameter is minimal in inspiration and maximal in expiration. Vieillard-Baron et al demonstrated fluid responsiveness in mechanically ventilated patients with sepsis when the SVC collapsibility index was greater than 36%.20 Although TEE is a semiinvasive method, it provides information about the structure and function of both ventricles, which is important in complex hemodynamic scenarios. TEE requires high educational standards and advanced skill levels for intensivists.
IMAGING CASE
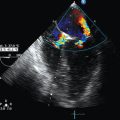
A 64-year-old male patient with ischemic heart failure (New York Heart Association class IV) was admitted to our hospital because of an exacerbation of his symptoms. His medications included high-dose diuretics (furosemide and spironolactone), a XXgw:math1XXbZZgw:math1ZZ-blocker, and an angiotensin-converting enzyme inhibitor. His serum creatinine level on admission was 2.8 mg/dL, as opposed to a 1.3-mg/dL baseline value. In the ward, an infusion of furosemide was initiated and led to exacerbation of the dyspnea and renal function (creatinine, 3.7 mg/dL); soon afterward he was admitted to the ICU. His acute kidney injury could have been attributed to volume depletion following diuretic therapy, or diuretic resistance with increased blood volume might have been the case. The dilemma was obvious: prescribe or remove fluids. Sonographic vena cava analysis revealed an IVC diameter greater than 25 mm without respiratory variation (Figure 37-3). Ultrafiltration resulted in radical clinical improvement in this patient with cardiorenal syndrome, and his creatinine values returned to baseline levels after a few days.
Pearls and highlights
• Fluid responsiveness means patients’ ability to increase CO after volume expansion.
• Static parameters such as CVP are poorly correlated with cardiac preload.
• Dynamic parameters such as SVV and PPV or PLR tests are more accurate measures of volume status than static ones are; however, their use has limitations.
• Sonographic vena cava analysis is a readily available, noninvasive approach for bedside evaluation of volume status, but it has limitations too.
References
1. Rivers, E, Nguyen, B, Havstad, S, et al. Early goal-directed therapy in the treatment of severe sepsis and septic shock. N Engl J Med. 2001; 345:1368–1377.
2. Boyd, JH, Forbes, J, Nakada, TA, et al, Fluid resuscitation in septic shock: a positive fluid balance and elevated central venous pressure are associated with increased mortality. Crit Care Me. 2011; 39:259–265.
3. Rosenberg, AL, Dechert, RE, Park, PK, Bartlett, RH, Review of a large clinical series: association of cumulative fluid balance on outcome in acute lung injurya retrospective review of the ARDSnet Tidal Volume Study Cohort. J Intensive Care Me. 2009; 24:35–46.
4. Bouchard, J, Soroko, SB, Chertow, GM, et al. Fluid accumulation, survival and recovery of kidney function in critically ill patients with acute kidney injury. Kidney Int. 2009; 76:422–427.
5. Nixon, JV, Murray, RG, Leonard, PD, et al. Effect of large variations in preload on left ventricular performance characteristics in normal subjects. Circulation. 1982; 65:698–703.
6. Kumar, A, Anel, R, Bunnell, E, et al. Pulmonary artery occlusion pressure and central venous pressure fail to predict ventricular filling volume, cardiac performance, or the response to volume infusion in normal subjects. Crit Care Med. 2004; 32:691–699.
7. Marik, PE, Baram, M, Vahid, B. Does central venous pressure predict fluid responsiveness? A systematic review of the literature and the tale of seven mares. Chest. 2008; 134:172–178.
8. McIntyre, LA, Hebert, PC, Fergusson, D, et al. A survey of Canadian intensivists’ resuscitation practices in early septic shock. Crit Care. 2007; 11:R74.
9. Dellinger, RP, Carlet, JM, Masur, H, et al. Surviving Sepsis Campaign guidelines for management of severe sepsis and septic shock. Crit Care Med. 2004; 32:858–873.
10. Michard, F, Alaya, S, Zarka, V, et al. Global end-diastolic volume as an indicator of cardiac preload in patients with septic shock. Chest. 2003; 124:1900–1908.
11. Wolf, S, Riess, A, Landscheidt, JF, et al. Global end-diastolic volume acquired by transpulmonary thermodilution depends on age and gender in awake and spontaneously breathing patients. Crit Care. 2009; 13:R202.
12. Trof, RJ, Danad, I, Reilingh, MW, et al, Cardiac filling volumes versus pressures for predicting fluid responsiveness after cardiovascular surgery: the role of systolic cardiac function. Crit Car. 2011; 15:R73.
13. Marik, PE, Cavallazzi, R, Vasu, T, Hirani, A, Dynamic changes in arterial waveform derived variables and fluid responsiveness in mechanically ventilated patients: a systematic review of the literature. Crit Care Me. 2009; 37:2642–2647.
14. Cavallaro, F, Sandroni, C, Marano, C, et al, Diagnostic accuracy of passive leg raising for prediction of fluid responsiveness in adults: systematic review and meta-analysis of clinical studies. Intensive Care Me. 2010; 36:1475–1483.
15. Kosiak, W, Swieton, D, Piskunowicz, M. Sonographic inferior vena cava/aorta diameter index, a new approach to the body fluid status assessment in children and young adults in emergency ultrasound—preliminary study. Am J Emerg Med. 2008; 26:320–325.
16. Nagdev, AD, Merchant, RC, Tirado-Gonzalez, A, et al. Emergency department bedside ultrasonographic measurement of the caval index for noninvasive determination of low central venous pressure. Ann Emerg Med. 2010; 55:290–295.
17. Feissel, M, Michard, F, Faller, JP, Teboul, JL. The respiratory variation in inferior vena cava diameter as a guide to fluid therapy. Intensive Care Med. 2004; 30:1834–1837.
18. Barbier, C, Loubieres, Y, Schmit, C, et al. Respiratory changes in inferior vena cava diameter are helpful in predicting fluid responsiveness in ventilated septic patients. Intensive Care Med. 2004; 30:1740–1746.
19. Machare-Delgado, E, Decaro, M, Marik, PE, Inferior vena cava variation compared to pulse contour analysis as predictors of fluid responsiveness: a prospective cohort study. J Intensive Care Me. 2011; 26:116–124.
20. Vieillard-Baron, A, Chergui, K, Rabiller, A, et al. Superior vena caval collapsibility as a gauge of volume status in ventilated septic patients. Intensive Care Med. 2004; 30:1734–1739.