[level-membership-for-cardiovascular-category]
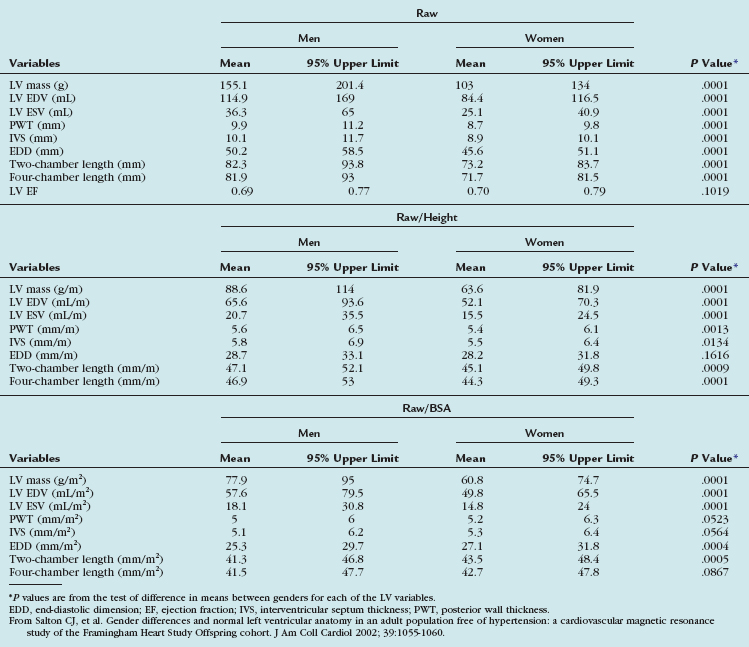
TABLE 55-3 Means and 95% Upper Limits for Raw, Height-Adjusted, and Body Surface Area–Adjusted Left Ventricular Variables
CHAPTER 55 Magnetic Resonance and Computed Tomographic Imaging of Myocardial Function
The work-up of ischemic heart disease necessitates an accurate and reproducible method of assessing cardiac function. The importance of cardiac function analysis in the evaluation of coronary artery disease (CAD) lies in the diagnostic and prognostic implications and, consequently, its usefulness in guiding medical therapy. Being the reference standard technique, MRI can quantify global systolic function and detect regional abnormalities in wall motion and help establish the diagnosis of CAD. In addition, pharmacologic stress imaging protocols using function or perfusion MRI have been shown to provide a sensitive detection of CAD.1 CT seems promising in at least some of these applications,2 although it is currently limited by the temporal resolution and scarce clinical validation data. Exercise stress imaging using MRI has been performed, although its feasibility in assessing patients with or suspected to have ischemic heart disease has been shown only in select, highly experienced sites.3
Prognosis after myocardial infarction (MI) has been correlated with the extent of myocardial necrosis and the degree of contractile dysfunction of the left ventricle.4 In patients with MI and chronic left ventricular (LV) dysfunction, LV ejection fraction and LV volumes are important prognostic parameters.5 The extent of late myocardial hyperenhancement on MRI and regional contractile improvement in response to low-dose dobutamine stress MRI can accurately predict recovery of function after MI, identify myocardial viability, and effectively guide coronary revascularization therapy.6–9
Although still experimental, growing evidence suggests that assessment of diastolic functional parameters is possible using current CT and MRI techniques. A time/volume curve per heart cycle is calculated on multidetector CT, from which determination of the peak filling rate (PFR) and the ratio of time to peak filling rate to R–R interval (tPFR/RR) have been evaluated as parameters of LV diastolic function. The early-to-late diastolic filling ratio (E/A) on Doppler echocardiography has been found to correlate positively with PFR (r = 0.54) and negatively with tPFR/RR (r = −0.57) on multidetector CT.10 Using MRI, a time/volume curve can likewise be derived, and diastolic function is expressed as PFR, early and active PFR (PFRE and PFRA), and their ratios. Diastolic parameters using echocardiography and MRI have been shown to vary by gender and age. Aging results in a decrease in LV distensibility that increases the early diastolic filling time, allowing the ventricle more time to fill, and increases the contribution of the atrial kick to LV filling. Although Doppler echocardiography provides peak velocities, MRI provides absolute peak filling rates from the time/volume curves. These data are also obtainable from radionuclide ventriculography; however, MRI has the advantage of significantly higher spatial resolution.11
Another more advanced MRI technique that has been studied in the evaluation of diastolic function involves the use of a high temporal resolution velocity-mapping technique that is able to identify previously undetectable myocardial motion patterns. This method has been shown to be comparable to tissue Doppler imaging—a well-established method that allows noninvasive assessment of diastolic function. Tissue Doppler imaging is limited, however, by limitations in acoustic window, low velocity resolution, lack of spatial information, and effect of the angle of insonation on myocardial velocities. Other established MRI methods for quantifying wall motion, such as tagging, phase contrast velocity mapping (tissue phase mapping), and displacement encoding with stimulated echoes (DENSE), can also be used to extract parameters such as strain or radial and circumferential velocity components, which are measures of diastolic function.12
Various imaging modalities are available to assess ventricular systolic function. Direct left ventriculography may be used, but it is rarely employed for the sole purpose of determining LV function because of its invasive nature. Among noninvasive imaging modalities, echocardiography is the most widely used because of its ease, relatively low cost, and widespread availability. Nuclear scintigraphy including gated single photon emission computed tomography (SPECT) and positron emission tomography can assess global and regional LV function, although their accuracies in this regard have been challenged by low spatial and temporal resolution. Radionuclide ventriculography provides accurate and reproducible assessment of global LV function. More recently, multidetector CT has been used in the evaluation of global and regional systolic LV function.13,14 Among all noninvasive imaging modalities, MRI has been shown to be the most accurate and reproducible modality for the evaluation of global and regional systolic LV function.15
INDICATIONS AND APPLICATIONS OF MAGNETIC RESONANCE IMAGING AND COMPUTED TOMOGRAPHY IN THE EVALUATION OF ISCHEMIC HEART DISEASE
Magnetic Resonance Imaging
Improvements in MRI have introduced new methods for evaluating CAD and its consequences. MRI often provides additional data that may be unavailable from other noninvasive imaging modalities, such as echocardiography, nuclear scintigraphy, and CT. Table 55-1 lists indications for MRI in CAD based on the European Consensus Panel report. Not included in this list are less common techniques, such as T2* measurements and T2-weighted edema imaging, which are being increasingly used in more experienced centers for assessment of cardiomyopathy of unknown etiology.
TABLE 55-1 Indications for Magnetic Resonance Imaging in Coronary Artery Disease
| Indication | Class* |
|---|---|
| Assessment of Global Ventricular (Left and Right) Function and Mass | I |
| Detection of CAD | |
| Regional LV function at rest and during dobutamine stress | II |
| Assessment of myocardial perfusion | II |
| Coronary MR angiography (CAD) | III |
| Coronary MR angiography (anomalies) | I |
| Coronary MR angiography of bypass graft patency | II |
| MRI flow measurements in coronary arteries | Inv |
| Arterial wall imaging | Inv |
| Acute and Chronic MI | |
| Detection and assessment | I |
| Myocardial viability | I |
| Ventricular septal defect | III |
| Mitral regurgitation (acute MI) | III |
| Ventricular thrombus | II |
| Acute coronary syndromes | Inv |
* Indication class: I, provides clinically relevant information and is usually appropriate; may be used as first-line imaging technique; usually supported by substantial literature; II, provides clinically relevant information and is frequently useful; other techniques may provide similar information; supported by limited literature; III, provides clinically relevant information, but is infrequently used because information from other imaging techniques is usually adequate; Inv, potentially useful, but still investigational.
From Pennell DJ, et al. Clinical indications for cardiovascular magnetic resonance (CMR): consensus panel report. Eur Heart J 2004; 25:1940-1965.
Computed Tomography
CT is increasingly being used in diagnosis of CAD. Because of its prognostic implications, the quantification of coronary artery calcification is a growing clinical application. Arad and colleagues17 were the first to report attempts to predict cardiac events with coronary calcium as detected by electron-beam CT, showing increased risk of cardiovascular events with higher Agatston scores. Coronary calcium scoring is discussed in Chapter 32.
Contrast-enhanced CT angiography of the coronary arteries is another application of multidetector CT used in the delineation of coronary anatomy and the detection of vascular stenosis. This technique has been used in the detection of CAD in patients at risk, and has been found to correlate with findings on invasive angiography.18
Multidetector CT was initially primarily used for detection of coronary artery stenosis and assessment of cardiac morphology, but more recently has been shown to be useful for cardiac function.10,13,14 Considering the need for administration of contrast material, radiation exposure, and limited temporal resolution (80 to 250 ms), use of multidetector CT exclusively for analysis of cardiac function parameters does not seem clinically prudent at present. If the data are already obtained across all phases of the cardiac cycle during a standard coronary CT angiography evaluation, however, the combination of noninvasive coronary artery imaging and assessment of cardiac function with multidetector CT is a suitable approach because it enables a more comprehensive cardiac work-up in patients with suspected CAD.
Quantification of cardiac function using multidetector CT has been shown to be in good agreement with echocardiography, invasive cine ventriculography, SPECT, and MRI as the reference standard.19 In addition, CT provides a useful alternative to MRI in the evaluation of ischemic heart disease in patients in whom MRI is contraindicated (e.g., patient has a periorbital metallic foreign body or metallic device; see Chapter 19 on MR safety for more information). Table 55-2 compares the advantages and disadvantages of the use of CT versus MRI in the evaluation of CAD.
TABLE 55-2 Advantages and Disadvantages of Magnetic Resonance Imaging and Computed Tomography
| MRI | Multidetector CT | |
|---|---|---|
| Advantages | No ionizing radiation | Widely available |
| No exposure to iodinated contrast media | Ease and rapidity of performance | |
| Better temporal and spatial resolution | Not contraindicated in patients with cardiac devices | |
| Better validation in clinical assessment of the following: | Single breath-hold acquisition eliminates motion artifact | |
ASSESSMENT OF CARDIAC FUNCTION
Global Systolic Function
Magnetic Resonance Imaging
Anatomic Planning and Standard Views
To produce high accuracy and reproducibility, standard imaging planes need to be used in quantifying ventricular function. The axes of the heart are defined using transverse, coronal, and sagittal views obtained as three-plane or individual scout images or through the use of real-time imaging techniques. We present one of many approaches to localize quickly and obtain the standard imaging planes for this purpose using cine MRI. Coronal images are used to define the transverse mid-ventricular slices (i.e., oblique axial images or “quasi” four-chamber view*). The short-axis views of the left ventricle can be defined by prescribing views perpendicular to the line between the center of the mitral valve and apex on the “quasi” four-chamber view. Slices are obtained from the base of the left ventricle at the level of the mitral annulus to the apex, allowing for full LV coverage for proper calculation of LV volumes, ejection fraction, and mass.
RV function is typically evaluated using the previously described LV views to limit total imaging time. A more detailed evaluation of RV structure and function, of particular importance in the evaluation of arrhythmogenic RV dysplasia, requires the acquisition of additional views. Standard transverse views from cranial to caudal slices are roughly perpendicular to the RV outflow tract, RV free wall, and RV inflow. To visualize the diaphragmatic segment of the right ventricle, a slice planned on a coronal scout, generating an oblique sagittal view through the long axis of the RV outflow tract, should be acquired.20
Sequences
Evaluation of cardiac function involves the use of multiphase, or cine, MRI that employs fast gradient-echo imaging with k-space segmentation to acquire images during end-inspiration breath-holding, which minimizes respiratory motion artifact.21 It is generally accepted that a temporal resolution of 50 ms is required to “freeze” end-systolic motion accurately to quantify ventricular volumes and calculate ejection fraction accurately. Segmented k-space breath-hold cine imaging has an in-plane spatial resolution that typically ranges from 1.5 to 2 mm2, slice thickness of 5 to 10 mm, temporal resolution of 30 to 50 ms, and scan times of 8 to 16 s/slice. The k-space segmentation allows for shorter acquisition times and enables the acquisition of a complete set of multiphase images per slice within a breath-hold. Generally, blood appears bright and myocardium appears gray in these cine gradient-echo images; however, the specific appearance of blood, myocardium, and blood flow depends on whether spoiled gradient-recalled-echo or steady-state free precession (SSFP) is used for signal generation within the segmented k-space structure.15
The use of spoiler gradients is the most commonly employed method, and involves extending the duration of the readout gradient beyond the sampling of the echo and before the next RF pulse. The prolonged application of the gradient results in accelerated dephasing of the residual transverse magnetization.22 Because residual magnetization is spoiled, signal intensity is not maximized. To improve image quality, SSFP imaging of the heart was later developed, which offers specific advantages to cardiac imaging. This method results in improved signal-to-noise and contrast-to-noise ratios.23 With SSFP, residual transverse magnetization is refocused, not spoiled, before the next RF pulse, and signal intensity is maximized. With this method, magnetization is in a steady state, so the RF pulses are applied throughout the acquisition.
SSFP is extremely sensitive to field inhomogeneities, of particular importance at 3.0 T, where repeated local shimming or frequency manipulation may be necessary to improve image quality. Traditional fast gradient-echo pulse sequences should be used for the detection of subtle flow abnormalities in valvular heart disease, or when field inhomogeneities result in significant artifacts with SSFP.22 The energy deposition associated with continuous application of RF pulses to maintain steady-state magnetization is higher, and specific absorption rate limits may be reached during SSFP, particularly with higher performance gradient scanners.
Myocardial contractility and regional function can be evaluated further through the use of cine MRI with tagging in conjunction with segmented k-space cine gradient-echo imaging, also known as spatial modulation of magnetization. To evaluate diastolic function, the tagging pulse may be applied in late systole, with images acquired throughout diastole. Quantification of wall motion and myocardial strain can be determined based on displacement of the tagged regions.22 To overcome the time-consuming aspect of tag analysis, harmonic phase analysis and DENSE techniques have been developed to improve the postprocessing duration.24–26
Image Analysis
Quantification of myocardial mass, ventricular volumes and dimensions, stroke volume, and ejection fraction is currently done using volumetric data computed from tracings of contiguous short-axis images obtained using cine SSFP pulse sequences. It is important to identify correctly the most basal extent of the ventricle because this determines the LV volumes and the LV ejection fraction.27 Manual planimetry of LV endocardial and epicardial borders is performed during end-systole and end-diastole on each of the short-axis slices (Fig. 55-1). Because of the time required to do manual planimetry, automatic and semiautomatic methods have been developed. In studies comparing manual, automatic, and semiautomatic techniques in animals that were sacrificed for ex vivo measurements, it was determined that manual contours were closer to ex vivo measurements than automatic contours, however, which overestimates true volume.28,29 After border detection, cardiac volumes are calculated by multiplying the blood pool area (defined by the endocardial border) by the slice thickness and summing all the slices. Myocardial mass is computed from the difference between the volumes determined from the endocardial and epicardial borders multiplied by the specific gravity of the myocardium (1.05 g/cm3).15
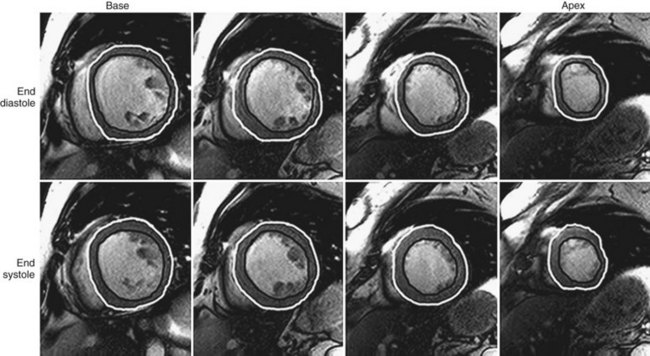
 FIGURE 55-1
Cine MRI enables the accurate description of segmental wall motion and quantitation of contractile function. The excellent contrast between the endocardium and blood pool improves measurement of wall thickness, end-diastolic and end-systolic volumes, and LV ejection fraction. The assumption of a uniform LV shape in the calculation of global functional parameters, as is practiced in other noninvasive imaging modalities such as echocardiography, carries potential errors. Errors resulting from these assumptions are magnified when the LV shape is deformed, such as in dilated cardiomyopathy or after MI. Because cine MR images are acquired in a tomographic set of planes, and no specific assumptions regarding LV geometry are necessary, volumetric measurements made from MRI generally provide more precise quantification of myocardial function.15
Computed Tomography
Techniques
Ventricular volume and function is quantified using multiplanar reformations of the retrospectively ECG gated data set obtained for coronary artery imaging. Multiphase reconstructions are performed throughout the entire cardiac cycle in increments of 5% or 10%, with 20 heart phases or 10 heart phases that are obtained and can be displayed as a cine loop. Temporal resolution varies from 80 to 250 ms, depending on the patient’s heart rate, hardware, and algorithm used for reconstruction.13,30 The selection of planes aligned with the axes of the heart is essential in the accurate analysis of global and regional LV function. These orientations are initially obtained from the axial plane, where a line transecting the apex and the midline of the base of the left ventricle yields a standard two-chamber view. Using this second image reference, the line transecting the apex and base of the left ventricle generates a longitudinal horizontal plane four-chamber view. From these longitudinal views of the heart, a series of short-axis planes can be obtained (Fig. 55-2).
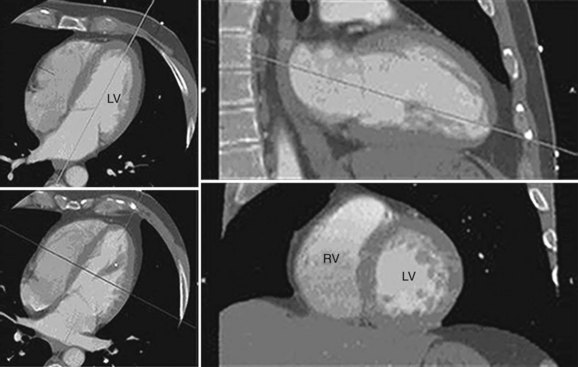
 FIGURE 55-2
End-diastolic and end-systolic frames are selected, and endocardial borders can be automatically detected, although these usually require some manual adjustment (Fig. 55-3). Quantification of LV volumes and LV ejection fraction is obtained from the entire three-dimensional data set with software analysis using the same summation principles applied in the evaluation of cardiac function in MRI as described in the previous section. As with MRI, a tomographic set of planes is acquired, and no assumptions are made concerning LV geometry, resulting in an accurate assessment of functional parameters.
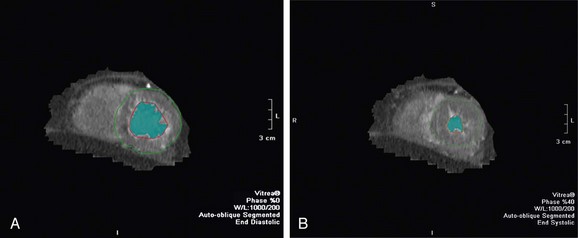
 FIGURE 55-3
In a study of 50 patients, Yamamuro and colleagues13 compared LV ejection fraction values estimated with multidetector CT, echocardiography, and SPECT using MRI as a standard, and found that functional analysis with multidetector CT had good correlation with MRI and was more accurate than analysis with two-dimensional echocardiography or ECG gated SPECT.13 Other investigators have confirmed the accuracy of assessment of LV ejection fraction and excellent correlation of functional parameters obtained by multidetector CT compared with cine MRI.31 Because of the limitations with insufficient temporal resolution in functional analysis using multidetector CT, Brodoefel and coworkers32 assessed the performance of a dual-source CT system compared with cine MRI. With the improvement of temporal resolution to 42 to 83 ms, dual-source CT enables improved accuracy in the assessment of global functional parameters.
Left Ventricular Function
Magnetic Resonance Imaging
Normal Values
Several reports of MRI-based normal values for LV function have been published. Normal values using earlier fast gradient-echo techniques differ from SSFP-derived values.11,33,34 SSFP imaging sequences have higher temporal resolution and improved myocardial–blood pool differentiation compared with the earlier gradient-echo techniques, leading to less blurring and thinner appearance of myocardial walls. As a result, calculated LV mass is smaller and measured LV volumes are larger using SSFP.34
Although there is general agreement that normal values should be indexed to body size, some debate exists whether to normalize for height or body surface area (BSA). Some authors recommend normalization for height because this is genetically determined, whereas adjustment for BSA benefits obese patients.33
Gender-specific MRI reference values for normal LV anatomy and function in a healthy adult population were derived from a representative sample of 318 Framingham Heart Study Offspring participants free of clinically overt cardiovascular disease. These patients underwent MRI examination using fast gradient-echo sequences. The following parameters were measured: LV end-diastolic volume (EDV) and end-systolic volume (ESV), mass, LV ejection fraction, and linear dimensions (wall thickness, cavity length). All volumetric (EDV, ESV, LV mass) and unidimensional measures were significantly greater in men than in women, and remained greater after adjustment for subject height. Volumetric measures were greater in men than in women after adjustment for BSA, but there were increased linear dimensions in women after adjustment for BSA. In particular, end-diastolic dimension indexed to BSA was greater in women than in men. There were no gender differences in global LV ejection fraction. The range of values derived from this study is provided in Table 55-3.
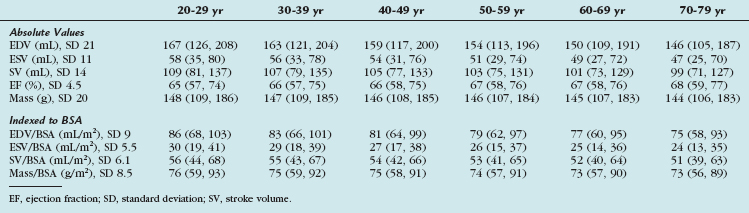
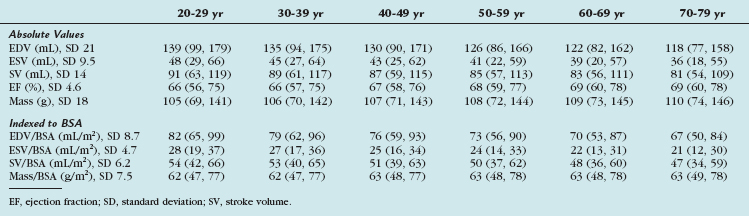
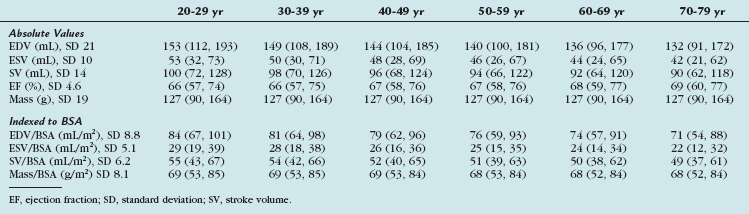
More recently, cine SSFP MRI has been used to define ranges for normal LV volumes and systolic and diastolic function. These were normalized to gender, BSA, and age. The determination of normality or the severity of abnormality depends on the use of appropriate reference ranges normalized to all three variables. Values derived from this study are presented in Tables 55-4, 55-5, and 55-6.11
TABLE 55-4 Left Ventricular Volumes, Systolic Function, and Mass (Absolute and Indexed to Body Surface Area) by Age Decile (Mean, 95% Confidence Interval) in Men
Computed Tomography
Normal Values
Normal adult values had been established by electron-beam CT in the mid-1980s for LV myocardial mass (98 ± 18 g/m2), EDV (73 ± 19 mL/m2), ESV (24 ± 8 mL/m2), and stroke volume (48 ± 11 mL/m2).35 Although most of the earlier validation studies were performed using electron-beam CT, many have been adapted and validated using multidetector CT.
Right Ventricular Function
Magnetic Resonance Imaging
Normal Values
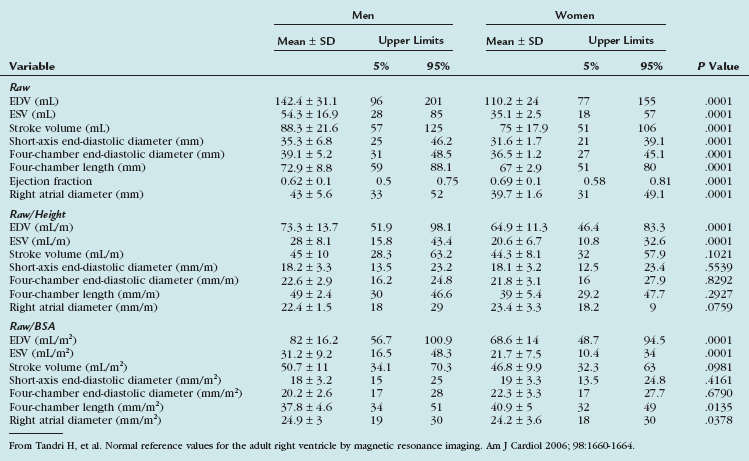
Tandri and associates36 examined 500 subjects free of cardiovascular disease who were participants in the Multi-Ethnic Study of Atherosclerosis. The endocardial borders of the right ventricle were manually traced on short-axis images, and RV volumes were calculated using summation-of-disks method. RV dimensions were measured on four-chamber gradient-echo images and in the short-axis plane. Except for the ejection fraction, all unadjusted RV parameters were significantly greater in men than in women. RV volumes and linear dimensions each correlated significantly with height and BSA. Gender differences remained after adjustment for subject height. After adjustment for BSA, volumetric variables remained significantly greater in men than in women. Table 55-7 presents gender-specific normal values for the adult right ventricle by MRI. Cardiovascular MRI measures of RV volumes and linear dimensions differ significantly according to gender and body size. These values are useful in distinguishing RV health from diseases that result in abnormal RV structure and function.
TABLE 55-7 Gender-Specific Raw, Height-Adjusted, and Body Surface Area–Adjusted Right Ventricular Variables
More recent advances in MRI include improved image quality with SSFP sequences and advanced postprocessing of high temporal resolution ventricular function. SSFP cine imaging with three-dimensional modeling was performed on 120 healthy subjects, yielding a set of normal RV reference values normalized to age, sex, and BSA. These RV functional parameters are listed in Tables 55-8, 55-9, and 55-10.11
TABLE 55-8 Right Ventricular Volumes, Systolic Function, and Mass (Absolute and Normalized to Body Surface Area) by Age Decile (Mean, 95% Confidence Interval) in Men
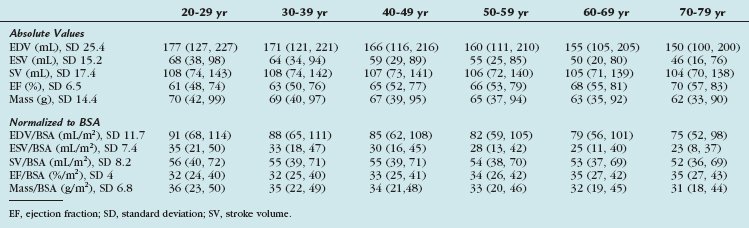
TABLE 55-9 Right Ventricular Volumes, Systolic Function, and Mass (Absolute and Normalized to Body Surface Area) by Age Decile (Mean, 95% Confidence Interval) in Women
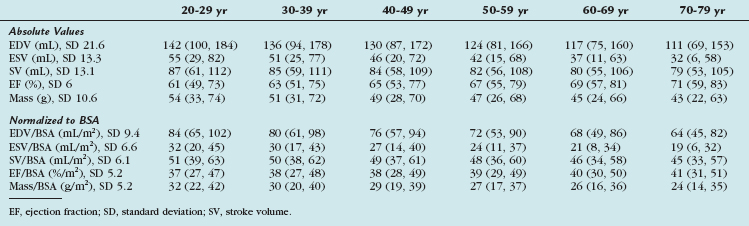
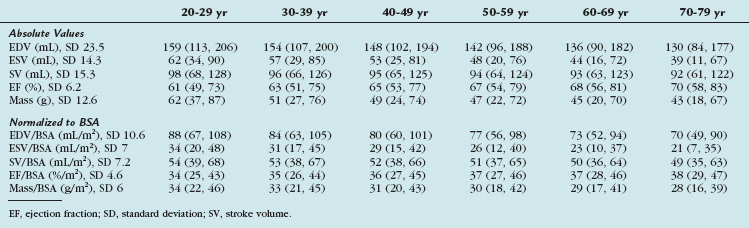
TABLE 55-10 Right Ventricular Volumes, Systolic Function, and Mass (Absolute and Normalized to Body Surface Area) by Age Decile (Mean, 95% Confidence Interval) in All Subjects
Identification of RV dysfunction is of particular importance in the assessment of ischemic heart disease. It has been reported that in post-MI patients, reduction in RV function to less than 40% was strongly associated with mortality.37
Computed Tomography
Currently, there are no widely established normal values for RV volumes and function using multidetector CT in normal volunteers because evaluation of cardiac function using this modality is performed using data obtained from coronary CT angiography in patients originally referred for suspected CAD. It has been shown that enlarged RV dimensions detected on multidetector CT carry a worse prognosis in other diseases, such as pulmonary embolism.38
Kim and colleagues39 assessed RV EDV, ESV, ejection fraction, and mass using multidetector CT compared with first-pass radionuclide angiography (FPRA). The mean RV ejection fraction (47 ± 7%) measured by multidetector CT showed good correlation with RV ejection fraction (44 ± 6%) measured by FPRA. A significant difference in the mean RV ejection fraction was found between cardiac multidetector CT and FPRA, with an overestimation of 2.9 ± 5.3% by multidetector CT versus FPRA. Multidetector CT is relatively simple and allows the RV volume and mass to be assessed, and the RV ejection fraction obtained by multidetector CT correlates well with that measured by FPRA.
Using semiautomated contour detection software, Koch and associates40 determined RV EDV and ESV from short-axis CT multiplanar reconstruction (MPR) created at every 10% of the R–R interval. End-systolic and end-diastolic axial images were transformed to three-dimensional images to determine the volumes by using a threshold-supported reconstruction algorithm. CT-derived RV parameters were compared with parameters obtained using SSFP cine MRI in the short-axis orientation. Mean RV EDV (155.4 ± 54.6 mL) and ESV (79.1 ± 37 mL) determined with MPR correlated well with MRI values (151.9 ± 53.7 mL and 75 ± 36 mL). RV stroke volume (76.2 ± 20.2 mL for MPR CT, 76.9 ± 20.7 mL for MRI) showed a good correlation, and RV ejection fraction (50.8 ± 8.4% for MPR CT, 51.9 ± 7.4% for MRI) showed a moderate correlation. Threshold-supported three-dimensional reconstructions revealed insufficient correlations with MRI. MPR-based semiautomated analysis of cardiac 16-detector row CT allows for RV functional analysis and correlates well with MRI findings. Threshold value–supported three-dimensional reconstructions did not show adequate MRI correlation because of inhomogeneities of RV contrast enhancement.
Regional Myocardial Function
Nomenclature
In the evaluation of myocardial segments, the American Heart Association recommends a 17-segment model of the left ventricle for standardized description that is applicable to all cardiac imaging modalities, including CT and MRI (Figs. 55-4 and 55-5). Identification of abnormalities in particular myocardial segments enables the approximate localization of coronary disease to the corresponding artery supplying the affected territory (Fig. 55-6).
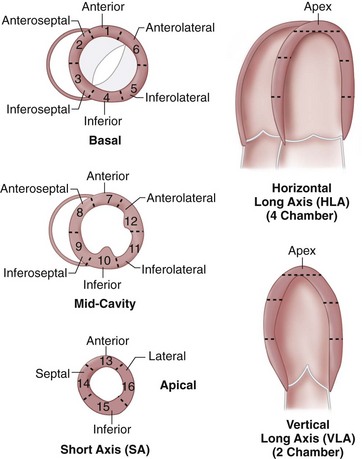
 FIGURE 55-4
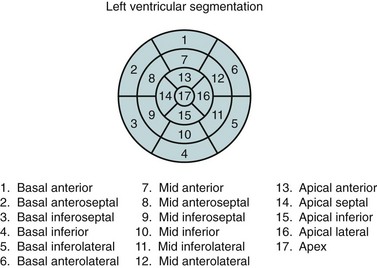
 FIGURE 55-5
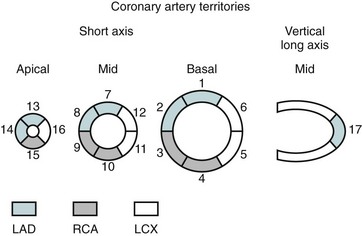
 FIGURE 55-6
Magnetic Resonance Imaging
Techniques
Displacement fields are the basis for computing functional maps of myocardial strain, strain rates, and torsion. Strain represents local deformation and is often calculated from the differences in displacement vectors of adjacent pixels. Torsion and twist of the ventricle refer to the rotation of the ventricular wall around its longitudinal axis, and torsion maps are obtained by calculating the rotation of individual pixels.15
Early displacement-imaging methods used modulation of image intensity. Zerhouni and coworkers42 proposed the concept of myocardial tagging for quantifying regional myocardial function. Radial and linear grids of low signal intensity were created by nulling the magnetization in those locations, which are called tags. Tags persist for a period comparable to the T1 relaxation time and move with the underlying tissue. The displacement vectors of tag intersect points can be quantified by directly identifying their positions in the magnitude images (Fig. 55-7).
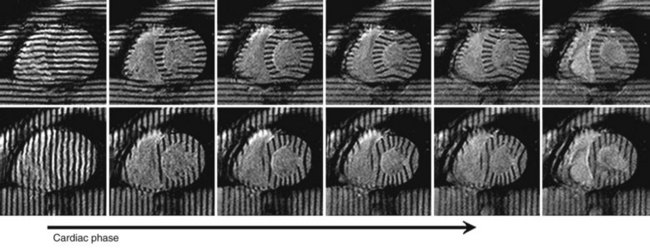
 FIGURE 55-7
Aside from image intensity, the phase of the MRI signal can be modulated to allow tracking of individual pixels.43,44 The benefit of using phase-based methods is the ability to measure the displacement vector of each pixel. Aletras and associates25 developed a technique to improve the spatial and temporal resolution of a conventional phase contrast velocity encoding myocardial motion method for use with more rapid pulse sequences. This technique has the advantages of tagging and phase velocity mapping sequences because it can measure larger displacements over longer periods with greater spatial resolution. This method, known as DENSE, has gained increasing clinical utility as a versatile imaging tool. A typical DENSE magnitude image is shown in Figure 55-8A, which provides no motion information. A DENSE phase image is shown in Figure 55-8B; this phase image shows motion along the x-axis. Because of regional contraction, the myocardium shows values other than gray, which reflects zero motion. For two-dimensional in-plane motion measurements, another DENSE phase map with encoding along the y-axis is acquired (Fig. 55-8C).
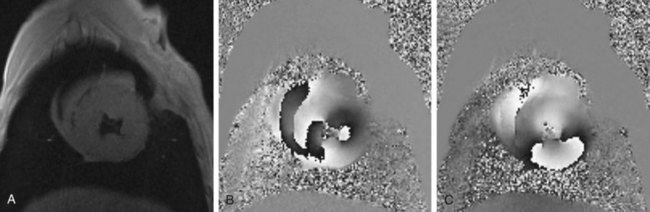
 FIGURE 55-8
The combination of the two phase maps generates a displacement plot (Fig. 55-9) in which each arrowtail corresponds to the position of a pixel at the beginning of systole, and each arrowhead corresponds to the final position at end-systole. Because each pixel carries its own displacement information, there are numerous measurements made within the myocardium.
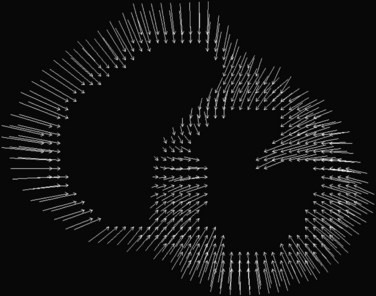
 FIGURE 55-9 Two-dimensional displacement arrow plots derived from the phase maps shown in Figure 55-8.
(From Kwong R. Cardiovascular Magnetic Resonance Imaging. Totowa, NJ, Humana Press, 2007.)
Myocardial strain can be computed from DENSE displacement images and is provided along the circumferential and radial directions. These strain maps show the degree of myocardial shortening in the circumferential direction and its degree of thickening along the radial direction as a result of local contractile action. Normally contracting myocardium would exhibit strain of about 20% along both directions (white part of the scale), and abnormal myocardium would exhibit reduced strain (black part of the scale) (Fig. 55-10).
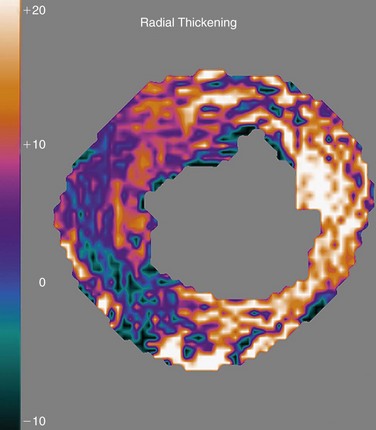
 FIGURE 55-10 Radial thickening strain computed automatically from the displacement plot of Figure 55-9. White zones correspond to normally contracting myocardium, and black zones show contractile abnormalities.
In combination with T2-weighted imaging to assess for myocardial edema after ischemia-reperfusion injury, DENSE allows a full assessment of not only the area at risk, but also the degree and extent of myocardial salvage (Fig. 55-11).45 Application in human studies is now possible to assess infarct size and area of myocardial salvage, determine quantitatively whether novel medical or intervention treatments can be beneficial, and evaluate the success of reperfusion strategies with a noninvasive technique.
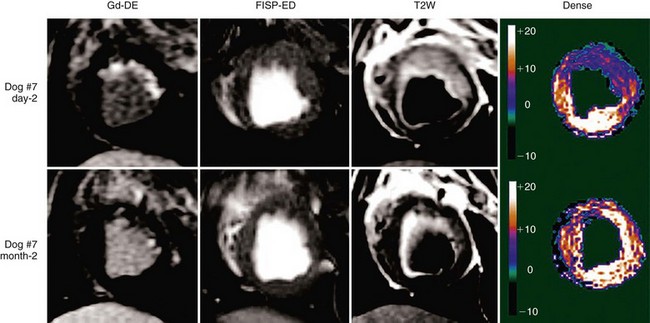
 FIGURE 55-11
Compared with other noninvasive imaging modalities, MRI is a true three-dimensional modality with unmatched soft tissue contrast and image resolution. Translation of the superior image quality into a more accurate assessment of cardiac function requires that analysis goes beyond visual inspection of the images to more detailed and quantitative results using techniques such as MRI displacement imaging and phase tagging.15
Computed Tomography
Multidetector CT has been studied in the assessment of regional wall motion. A study by Haraikawa and colleagues46 included 20 patients with various kinds of heart disease. All patients underwent contrast-enhanced multidetector CT and biplane left ventriculography (LVG). Using a retrospective ECG gating technique, 10 phases over one cardiac cycle were extracted. Wall motion was scored. The scores obtained by multidetector CT were compared with scores obtained by LVG. Wall motion could be assessed in all segments of the 20 patients using interactive multiplanar animation. Of 140 segments in 20 patients, scores in 118 were concordant between multidetector CT and LVG.
Yamaguchi and coworkers10 evaluated regional cardiac function using multidetector CT and quantitative gated SPECT (QGS) compared with LVG, and evaluated parameters of LV diastolic function using multidetector CT. Regional cardiac function was evaluated using shortening fraction. The PFR and tPFR/RR on multidetector CT were measured as parameters of LV diastolic function. The shortening fractions by multidetector CT and LVG were evaluated using a seven-segment model (1, anterobasal; 2, anterolateral; 3, apical; 4, diaphragmatic; 5, posterobasal; 6, septal; 7, posterolateral), and were found to be correlated in almost each segment (r = 0.64 to 0.88) except the anterobasal segment (r = 0.34), whereas the shortening fractions by QGS and LVG were not correlated in more segments. The shortening fractions by QGS and LVG were not correlated in the myocardial infarcted segments. Multidetector CT is more useful in detecting regional cardiac function compared with QGS, and parameters of diastolic function could also be measured by multidetector CT.
Belge and colleagues31 showed that regional end-diastolic and end-systolic wall thicknesses by multidetector CT were highly correlated, but significantly lower than by MRI (8.3 ± 1.8 mm vs. 8.8 ± 1.9 mm and 12.7 ± 3.4 mm vs. 13.3 ± 3.5 mm). Values of regional wall thickening by multidetector CT and MRI were similar (54 ± 30% vs. 51 ± 31%) and correlated well. Retrospectively gated multidetector CT can accurately estimate regional LV wall thickening compared with cine MRI. In a pilot study by Fischbach and coworkers,14 segmental LV wall motion obtained by multidetector CT was assessed using a 17-segment model, and compared with SSFP cine MRI. Multidetector CT correctly identified 252 out of 266 (94.7%) normal segments and 189 out of 214 (88.3%) segments with decreased wall motion, yielding a sensitivity of 88% and specificity of 95% for identification of wall motion abnormalities. LV wall motion scores were identical in 86.7% of 480 segments. Multidetector CT had a tendency to underestimate the degree of wall motion impairment. Interobserver agreement was lower in multidetector CT (66.5%) than in MRI (89.1%).
Normokinetic segments are reliably identified with multidetector CT. Sensitivity for the accurate detection of regional wall motion abnormalities may be enhanced only by upgrading temporal resolution.14 With the improvement of temporal resolution between 42 ms and 83 ms, some investigators showed the utility of dual-source CT not only in the accurate assessment of global functional parameters, but also in the quantification of time-dependent variables, providing a more reliable evaluation of regional wall motion.32
EVALUATION OF CARDIAC FUNCTION DURING STRESS
Magnetic Resonance Imaging
The use of MRI in the detection of CAD and the assessment of its hemodynamic significance is a growing clinical application. The availability of rapid gradient systems and resultant short imaging times allows for high-resolution cine imaging of the heart at rest and with faster heart rates during stress conditions. Endocardial border definition using standard cine SSFP MRI pulse sequences is superior to even state-of-the-art echocardiographic image quality.15
Stress Agents
Exercise stress MRI has been performed on healthy subjects in highly experienced centers or in an experimental setting; however, its application and feasibility in detection of ischemic heart disease needs to be exhibited further.3 Physical exercise within the magnet leads to degradation of image quality from motion artifacts, and currently pharmacologic stress is preferred.16 Various pharmacologic stress agents are available, which include the vasodilators adenosine and dipyridamole and the inotropic agent dobutamine. Although vasodilator stress has been reported to induce ischemic wall motion abnormalities, a low diagnostic sensitivity for the detection of epicardial CAD has been reported using any cine imaging technique during vasodilator stress.47
Dobutamine stress MRI is well established as a technique for identifying ischemia-induced wall motion abnormalities in CAD, with developed guidelines for clinical practice.1 In a head-to-head comparison of dobutamine stress echocardiography and high-dose dobutamine/atropine stress MRI (DSMRI), with x-ray coronary angiography as the standard of reference in a large patient cohort, Nagel and associates48 showed a high accuracy of DSMRI for the detection of inducible wall motion abnormalities related to epicardial coronary stenosis in patients with suspected CAD. Diagnostic accuracy was 86% (sensitivity 86%, specificity 86%), which was superior to dobutamine stress echocardiography (76% accuracy). In patients with limited echocardiographic image quality, Hundley and colleagues49 reported a similar diagnostic performance of DSMRI (accuracy 83%, sensitivity 83%, specificity 83%). The gain in diagnostic accuracy is high in patients with inadequate acoustic windows or limited echocardiographic image quality despite the use of second-harmonic imaging.
Results obtained from dobutamine stress testing have important prognostic implications. Normal dobutamine stress function carries a good prognosis, whereas the presence of inducible ischemia signifies an increased risk for cardiovascular events.50
Dobutamine Stress Magnetic Resonance Imaging Protocol
We present in this section the current DSMRI imaging protocol used in our center. We use a standard high-dose dobutamine/atropine regimen similar to stress echocardiography. Cine MRI scans are acquired in the diagnostic standard views (apical, mid, and basal short-axis view; four-chamber, two-chamber, and three-chamber view) at rest and during each stage of progressive dobutamine infusion at 3- to 5-minute intervals at doses of 10 µg/kg/min, 20 µg/kg/min, 30 µg/kg/min, and 40 µg/kg/min. If the age-predicted target heart rate ([220 − age] × 0.85) is not achieved at the maximal dobutamine dose, a maximal dose of 2 mg of atropine is administered in 0.25-mg increments every 1 to 2 minutes. We prefer to administer atropine at the early part of the 30 µg/kg/min infusion stage, when the inotropic effect of dobutamine has been reached so that atropine aliquots can help achieve the desired target heart rate sooner than depending on progressive dobutamine alone. Termination criteria are identical to those of dobutamine stress echocardiography: achievement of target heart rate, systolic blood pressure decrease more than 40 mm Hg, blood pressure increase greater than 240/120 mm Hg, intractable symptoms, new or worsening wall motion abnormalities in at least two adjacent left ventricular segments, or complex cardiac arrhythmias.1
Although debate remains, there have been reports of specific clinical settings when DSMRI was compared with gadolinium-enhanced scar imaging (i.e., myocardial delayed enhancement [MDE] imaging), and it was found that low-dose dobutamine is superior in predicting recovery of function after revascularization.1 This observation was most pronounced in segments with nontransmural scar. It has been suggested that the reason for this phenomenon is that even though scar imaging depicts the area of myocardial necrosis, it does not assess the functional state of the surrounding (potentially viable) epicardial myocardium, and its capability for the prediction of functional recovery of nontransmurally scarred myocardium is limited.15 The use of MRI in the detection of myocardial viability is discussed further in Chapter 57.
Diagnostic Criteria
The standard 17-segment model as described in the previous section is used in the evaluation of stress-induced perfusion and wall motion abnormalities. Perfusion imaging may be performed with any of the pharmacologic stress agents mentioned. The principle behind first-pass myocardial perfusion imaging is that differences in myocardial blood flow can be assessed by direct visualization of enhancement from a first-pass transit of a gadolinium contrast agent.22 The use of MRI in the evaluation of myocardial perfusion is discussed further in Chapter 54.
Regional wall motion is graded by visual assessment because quantification has not been shown to be superior to visual assessment. Each of the 17 myocardial segments needs to be assessed at all times. For image interpretation, multiple synchronized cine loop display is used to view one or more imaging planes at each dose level simultaneously. Segmental wall motion is classified as normokinetic, hypokinetic, akinetic, or dyskinetic and assigned a grade of 1 to 4. The sum of points divided by the number of analyzed segments generates a wall motion score. A wall motion score of 1 indicates normal contraction, whereas a higher score indicates wall motion abnormalities. With increasing doses during dobutamine stress, a lack of augmentation in the wall motion or systolic wall thickening and a reduction of the wall motion or thickening are regarded as pathologic findings.15
Other MRI techniques have been used to assess CAD during DSMRI. Tagging methods have shown increased sensitivity for diagnosis of CAD.51,52 Objective analysis of myocardial wall motion using tagging would be expected to reduce observer interpretation variability, which remains an issue in dobutamine stress echocardiography. The application of this MRI technique in a large clinical trial is anticipated.16 An example of the application of tagging in the analysis of myocardial function during dobutamine stress is shown in Figure 55-12.
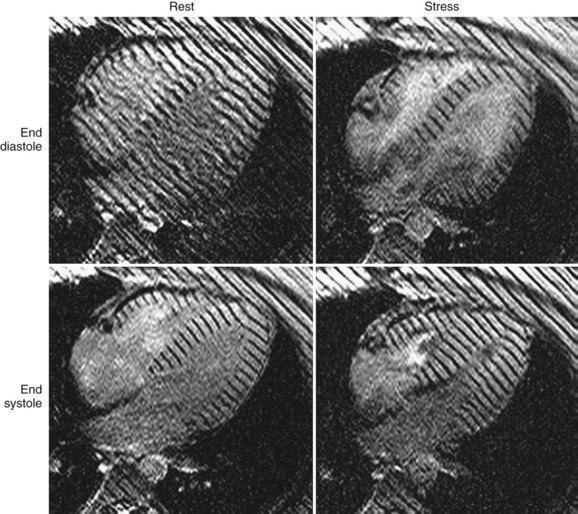
 FIGURE 55-12
Computed Tomography
The clinical application of stress imaging techniques using multidetector CT is still in development. George and colleagues2 showed the use of adenosine-augmented multidetector CT myocardial perfusion imaging in providing semiquantitative measurements of myocardial perfusion during first-pass multidetector CT in a canine model of left anterior descending coronary artery stenosis.2 This technique of identifying the presence of CAD using adenosine stress multidetector CT is yet to be validated in humans. The detection of stress-induced regional wall motion abnormalities with either exercise or dobutamine is not currently possible using multidetector CT because of limited temporal resolution.
Late enhancement imaging using multidetector CT has been used in the evaluation of myocardial viability, providing useful information in the prediction of LV remodeling and prognosis after MI.6 In a small pilot study of patients with acute MI, late enhancement multidetector CT has been shown to correlate well with late enhancement MRI in assessing infarct size and myocardial viability.7 Further clinical validation and investigation of the prognostic implication of multidetector CT in various clinical settings need to be prospectively studied. CT applications in the assessment of myocardial perfusion and viability are discussed further in Chapters 54 and 57.
1 Nagel E, et al. Stress cardiovascular magnetic resonance: consensus panel report. J Cardiovasc Magn Reson. 2001;3:267-281.
2 George RT, et al. Multidetector computed tomography myocardial perfusion imaging during adenosine stress. J Am Coll Cardiol. 2006;48:153-160.
3 Jekic M, et al. Cardiac function and myocardial perfusion immediately following maximal treadmill exercise inside the MRI room. J Cardiovasc Magn Reson. 2008;10:3.
4 Sanz G, et al. Determinants of prognosis in survivors of myocardial infarction: a prospective clinical angiographic study. N Engl J Med. 1982;306:1065-1070.
5 White HD, et al. Left ventricular end-systolic volume as the major determinant of survival after recovery from myocardial infarction. Circulation. 1987;76:44-51.
6 Sato A, et al. Early validation study of 64-slice multidetector computed tomography for the assessment of myocardial viability and the prediction of left ventricular remodelling after acute myocardial infarction. Eur Heart J. 2008;29:490-498.
7 Mahnken AH, et al. Assessment of myocardial viability in reperfused acute myocardial infarction using 16-slice computed tomography in comparison to magnetic resonance imaging. J Am Coll Cardiol. 2005;45:2042-2047.
8 Kim RJ, et al. The use of contrast-enhanced magnetic resonance imaging to identify reversible myocardial dysfunction. N Engl J Med. 2000;343:1445-1453.
9 Baer FM, et al. Dobutamine magnetic resonance imaging predicts contractile recovery of chronically dysfunctional myocardium after successful revascularization. J Am Coll Cardiol. 1998;31:1040-1048.
10 Yamaguchi K, et al. Accurate estimation of regional and global cardiac function in old myocardial infarction patients by multidetector-row computed tomography. J Med Invest. 2007;54(1-2):72-82.
11 Maceira AM, et al. Normalized left ventricular systolic and diastolic function by steady state free precession cardiovascular magnetic resonance. J Cardiovasc Magn Reson. 2006;8:417-426.
12 Jung B, et al. Detailed analysis of myocardial motion in volunteers and patients using high-temporal-resolution MR tissue phase mapping. J Magn Reson Imaging. 2006;24:1033-1039.
13 Yamamuro M, et al. Cardiac functional analysis with multi-detector row CT and segmental reconstruction algorithm: comparison with echocardiography, SPECT, and MR imaging. Radiology. 2005;234:381-390.
14 Fischbach R, et al. Assessment of regional left ventricular function with multidetector-row computed tomography versus magnetic resonance imaging. Eur Radiol. 2007;17:1009-1017.
15 Kwong R. Cardiovascular Magnetic Resonance Imaging. Totowa, NJ: Humana Press; 2007.
16 Pennell DJ, et al. Clinical indications for cardiovascular magnetic resonance (CMR): consensus panel report. Eur Heart J. 2004;25:1940-1965.
17 Arad Y, et al. Predictive value of electron beam computed tomography of the coronary arteries: 19-month follow-up of 1173 asymptomatic subjects. Circulation. 1996;93:1951-1953.
18 Miller J, Rochitte C, Dewey M Coronary artery evaluation using 64-row multidetector computed tomography angiography (CORE-64): results of a multicenter, international trial to assess diagnostic accuracy compared with conventional coronary angiography American Heart Association 30th Annual Scientific Sessions, Orlando. 2007.
19 Orakzai SH, et al. Assessment of cardiac function using multidetector row computed tomography. J Comput Assist Tomogr. 2006;30:555-563.
20 Nagel E. Cardiovascular Magnetic Resonance. Berlin: Steinkopff Verlag Darmstadt; 2004.
21 Atkinson DJ, Edelman RR. Cineangiography of the heart in a single breath hold with a segmented turboFLASH sequence. Radiology. 1991;178:357-360.
22 Lee V. Cardiovascular Magnetic Resonance: Physical Principles to Practical Applications. Philadelphia: Lippincott Williams & Wilkins; 2006.
23 Carr JC, et al. Cine MR angiography of the heart with segmented true fast imaging with steady-state precession. Radiology. 2001;219:828-834.
24 Osman NF, et al. Cardiac motion tracking using CINE harmonic phase (HARP) magnetic resonance imaging. Magn Reson Med. 1999;42:1048-1060.
25 Aletras AH, et al. DENSE: displacement encoding with stimulated echoes in cardiac functional MRI. J Magn Reson. 1999;137:247-252.
26 Kim D, et al. Myocardial tissue tracking with two-dimensional cine displacement-encoded MR imaging: development and initial evaluation. Radiology. 2004;230:862-871.
27 Marcus JT, et al. The influence of through-plane motion on left ventricular volumes measured by magnetic resonance imaging: implications for image acquisition and analysis. J Cardiovasc Magn Reson. 1999;1:1-6.
28 Francois CJ, et al. Left ventricular mass: manual and automatic segmentation of true FISP and FLASH cine MR images in dogs and pigs. Radiology. 2004;230:389-395.
29 Shors SM, et al. Accurate quantification of right ventricular mass at MR imaging by using cine true fast imaging with steady-state precession: study in dogs. Radiology. 2004;230:383-388.
30 Pons-Llad G. Atlas of Non-invasive Coronary Angiography by Multidetector Computed Tomography. New York: Springer Publishing; 2006.
31 Belge B, et al. Accurate estimation of global and regional cardiac function by retrospectively gated multidetector row computed tomography: comparison with cine magnetic resonance imaging. Eur Radiol. 2006;16:1424-1433.
32 Brodoefel H, et al. Dual-source CT with improved temporal resolution in assessment of left ventricular function: a pilot study. AJR Am J Roentgenol. 2007;189:1064-1070.
33 Salton CJ, et al. Gender differences and normal left ventricular anatomy in an adult population free of hypertension: a cardiovascular magnetic resonance study of the Framingham Heart Study Offspring cohort. J Am Coll Cardiol. 2002;39:1055-1060.
34 Alfakih K, et al. Normal human left and right ventricular dimensions for MRI as assessed by turbo gradient echo and steady-state free precession imaging sequences. J Magn Reson Imaging. 2003;17:323-329.
35 Guiliani ER. Mayo Clinic Practice of Cardiology, 3rd ed. St Louis: Mosby; 1996.
36 Tandri H, et al. Normal reference values for the adult right ventricle by magnetic resonance imaging. Am J Cardiol. 2006;98:1660-1664.
37 Larose E, et al. Right ventricular dysfunction assessed by cardiovascular magnetic resonance imaging predicts poor prognosis late after myocardial infarction. J Am Coll Cardiol. 2007;49:855-862.
38 Quiroz R, et al. Right ventricular enlargement on chest computed tomography: prognostic role in acute pulmonary embolism. Circulation. 2004;109:2401-2404.
39 Kim TH, et al. Evaluation of right ventricular volume and mass using retrospective ECG-gated cardiac multidetector computed tomography: comparison with first-pass radionuclide angiography. Eur Radiol. 2005;15:1987-1993.
40 Koch K, et al. Assessment of right ventricular function by 16-detector-row CT: comparison with magnetic resonance imaging. Eur Radiol. 2005;15:312-318.
41 Reference deleted in proofs.
42 Zerhouni EA, et al. Human heart: tagging with MR imaging—a method for noninvasive assessment of myocardial motion. Radiology. 1988;169:59-63.
43 Reese TG, Wedeen VJ, Weisskoff RM. Measuring diffusion in the presence of material strain. J Magn Reson B. 1996;112:253-258.
44 Chenevert TL, et al. Elasticity reconstructive imaging by means of stimulated echo MRI. Magn Reson Med. 1998;39:482-490.
45 Aletras AH, et al. Retrospective determination of the area at risk for reperfused acute myocardial infarction with T2-weighted cardiac magnetic resonance imaging: histopathological and displacement encoding with stimulated echoes (DENSE) functional validations. Circulation. 2006;113:1865-1870.
46 Haraikawa T, et al. Assessment of left ventricular wall motion using 16-channel multislice computed tomography: comparison with left ventriculography. Radiat Med. 2006;24:159-164.
47 Paetsch I, et al. Comparison of dobutamine stress magnetic resonance, adenosine stress magnetic resonance, and adenosine stress magnetic resonance perfusion. Circulation. 2004;110:835-842.
48 Nagel E, et al. Noninvasive diagnosis of ischemia-induced wall motion abnormalities with the use of high-dose dobutamine stress MRI: comparison with dobutamine stress echocardiography. Circulation. 1999;99:763-770.
49 Hundley WG, et al. Utility of fast cine magnetic resonance imaging and display for the detection of myocardial ischemia in patients not well suited for second harmonic stress echocardiography. Circulation. 1999;100:1697-1702.
50 Hundley WG, et al. Magnetic resonance imaging determination of cardiac prognosis. Circulation. 2002;106:2328-2333.
51 Kuijpers D, et al. Dobutamine cardiovascular magnetic resonance for the detection of myocardial ischemia with the use of myocardial tagging. Circulation. 2003;107:1592-1597.
52 Power TP, et al. Breath-hold dobutamine magnetic resonance myocardial tagging: normal left ventricular response. Am J Cardiol. 1997;80:1203-1207.
* Because this view is derived from a coronal image, it represents a single oblique view. A “true” four-chamber view requires a double-oblique prescription.
[/level-membership-for-cardiovascular-category][not-level-membership-for-cardiovascular-category]
TABLE 55-3 Means and 95% Upper Limits for Raw, Height-Adjusted, and Body Surface Area–Adjusted Left Ventricular Variables
CHAPTER 55 Magnetic Resonance and Computed Tomographic Imaging of Myocardial Function
The work-up of ischemic heart disease necessitates an accurate and reproducible method of assessing cardiac function. The importance of cardiac function analysis in the evaluation of coronary artery disease (CAD) lies in the diagnostic and prognostic implications and, consequently, its usefulness in guiding medical therapy. Being the reference standard technique, MRI can quantify global systolic function and detect regional abnormalities in wall motion and help establish the diagnosis of CAD. In addition, pharmacologic stress imaging protocols using function or perfusion MRI have been shown to provide a sensitive detection of CAD.1 CT seems promising in at least some of these applications,2 although it is currently limited by the temporal resolution and scarce clinical validation data. Exercise stress imaging using MRI has been performed, although its feasibility in assessing patients with or suspected to have ischemic heart disease has been shown only in select, highly experienced sites.3
Prognosis after myocardial infarction (MI) has been correlated with the extent of myocardial necrosis and the degree of contractile dysfunction of the left ventricle.4 In patients with MI and chronic left ventricular (LV) dysfunction, LV ejection fraction and LV volumes are important prognostic parameters.5 The extent of late myocardial hyperenhancement on MRI and regional contractile improvement in response to low-dose dobutamine stress MRI can accurately predict recovery of function after MI, identify myocardial viability, and effectively guide coronary revascularization therapy.6–9
Although still experimental, growing evidence suggests that assessment of diastolic functional parameters is possible using current CT and MRI techniques. A time/volume curve per heart cycle is calculated on multidetector CT, from which determination of the peak filling rate (PFR) and the ratio of time to peak filling rate to R–R interval (tPFR/RR) have been evaluated as parameters of LV diastolic function. The early-to-late diastolic filling ratio (E/A) on Doppler echocardiography has been found to correlate positively with PFR (r = 0.54) and negatively with tPFR/RR (r = −0.57) on multidetector CT.10 Using MRI, a time/volume curve can likewise be derived, and diastolic function is expressed as PFR, early and active PFR (PFRE and PFRA), and their ratios. Diastolic parameters using echocardiography and MRI have been shown to vary by gender and age. Aging results in a decrease in LV distensibility that increases the early diastolic filling time, allowing the ventricle more time to fill, and increases the contribution of the atrial kick to LV filling. Although Doppler echocardiography provides peak velocities, MRI provides absolute peak filling rates from the time/volume curves. These data are also obtainable from radionuclide ventriculography; however, MRI has the advantage of significantly higher spatial resolution.11
Another more advanced MRI technique that has been studied in the evaluation of diastolic function involves the use of a high temporal resolution velocity-mapping technique that is able to identify previously undetectable myocardial motion patterns. This method has been shown to be comparable to tissue Doppler imaging—a well-established method that allows noninvasive assessment of diastolic function. Tissue Doppler imaging is limited, however, by limitations in acoustic window, low velocity resolution, lack of spatial information, and effect of the angle of insonation on myocardial velocities. Other established MRI methods for quantifying wall motion, such as tagging, phase contrast velocity mapping (tissue phase mapping), and displacement encoding with stimulated echoes (DENSE), can also be used to extract parameters such as strain or radial and circumferential velocity components, which are measures of diastolic function.12
Various imaging modalities are available to assess ventricular systolic function. Direct left ventriculography may be used, but it is rarely employed for the sole purpose of determining LV function because of its invasive nature. Among noninvasive imaging modalities, echocardiography is the most widely used because of its ease, relatively low cost, and widespread availability. Nuclear scintigraphy including gated single photon emission computed tomography (SPECT) and positron emission tomography can assess global and regional LV function, although their accuracies in this regard have been challenged by low spatial and temporal resolution. Radionuclide ventriculography provides accurate and reproducible assessment of global LV function. More recently, multidetector CT has been used in the evaluation of global and regional systolic LV function.13,14 Among all noninvasive imaging modalities, MRI has been shown to be the most accurate and reproducible modality for the evaluation of global and regional systolic LV function.15
INDICATIONS AND APPLICATIONS OF MAGNETIC RESONANCE IMAGING AND COMPUTED TOMOGRAPHY IN THE EVALUATION OF ISCHEMIC HEART DISEASE
Magnetic Resonance Imaging
Improvements in MRI have introduced new methods for evaluating CAD and its consequences. MRI often provides additional data that may be unavailable from other noninvasive imaging modalities, such as echocardiography, nuclear scintigraphy, and CT. Table 55-1 lists indications for MRI in CAD based on the European Consensus Panel report. Not included in this list are less common techniques, such as T2* measurements and T2-weighted edema imaging, which are being increasingly used in more experienced centers for assessment of cardiomyopathy of unknown etiology.
TABLE 55-1 Indications for Magnetic Resonance Imaging in Coronary Artery Disease
| Indication | Class* |
|---|---|
| Assessment of Global Ventricular (Left and Right) Function and Mass | I |
| Detection of CAD | |
| Regional LV function at rest and during dobutamine stress | II |
| Assessment of myocardial perfusion | II |
| Coronary MR angiography (CAD) | III |
| Coronary MR angiography (anomalies) | I |
| Coronary MR angiography of bypass graft patency | II |
| MRI flow measurements in coronary arteries | Inv |
| Arterial wall imaging | Inv |
| Acute and Chronic MI | |
| Detection and assessment | I |
| Myocardial viability | I |
| Ventricular septal defect | III |
| Mitral regurgitation (acute MI) | III |
| Ventricular thrombus | II |
| Acute coronary syndromes | Inv |
* Indication class: I, provides clinically relevant information and is usually appropriate; may be used as first-line imaging technique; usually supported by substantial literature; II, provides clinically relevant information and is frequently useful; other techniques may provide similar information; supported by limited literature; III, provides clinically relevant information, but is infrequently used because information from other imaging techniques is usually adequate; Inv, potentially useful, but still investigational.
From Pennell DJ, et al. Clinical indications for cardiovascular magnetic resonance (CMR): consensus panel report. Eur Heart J 2004; 25:1940-1965.
Computed Tomography
CT is increasingly being used in diagnosis of CAD. Because of its prognostic implications, the quantification of coronary artery calcification is a growing clinical application. Arad and colleagues17 were the first to report attempts to predict cardiac events with coronary calcium as detected by electron-beam CT, showing increased risk of cardiovascular events with higher Agatston scores. Coronary calcium scoring is discussed in Chapter 32.
Contrast-enhanced CT angiography of the coronary arteries is another application of multidetector CT used in the delineation of coronary anatomy and the detection of vascular stenosis. This technique has been used in the detection of CAD in patients at risk, and has been found to correlate with findings on invasive angiography.18
Multidetector CT was initially primarily used for detection of coronary artery stenosis and assessment of cardiac morphology, but more recently has been shown to be useful for cardiac function.10,13,14 Considering the need for administration of contrast material, radiation exposure, and limited temporal resolution (80 to 250 ms), use of multidetector CT exclusively for analysis of cardiac function parameters does not seem clinically prudent at present. If the data are already obtained across all phases of the cardiac cycle during a standard coronary CT angiography evaluation, however, the combination of noninvasive coronary artery imaging and assessment of cardiac function with multidetector CT is a suitable approach because it enables a more comprehensive cardiac work-up in patients with suspected CAD.
Quantification of cardiac function using multidetector CT has been shown to be in good agreement with echocardiography, invasive cine ventriculography, SPECT, and MRI as the reference standard.19 In addition, CT provides a useful alternative to MRI in the evaluation of ischemic heart disease in patients in whom MRI is contraindicated (e.g., patient has a periorbital metallic foreign body or metallic device; see Chapter 19 on MR safety for more information). Table 55-2 compares the advantages and disadvantages of the use of CT versus MRI in the evaluation of CAD.
TABLE 55-2 Advantages and Disadvantages of Magnetic Resonance Imaging and Computed Tomography
| MRI | Multidetector CT | |
|---|---|---|
| Advantages | No ionizing radiation | Widely available |
| No exposure to iodinated contrast media | Ease and rapidity of performance | |
| Better temporal and spatial resolution | Not contraindicated in patients with cardiac devices | |
| Better validation in clinical assessment of the following: | Single breath-hold acquisition eliminates motion artifact | |
ASSESSMENT OF CARDIAC FUNCTION
Global Systolic Function
Magnetic Resonance Imaging
Anatomic Planning and Standard Views
To produce high accuracy and reproducibility, standard imaging planes need to be used in quantifying ventricular function. The axes of the heart are defined using transverse, coronal, and sagittal views obtained as three-plane or individual scout images or through the use of real-time imaging techniques. We present one of many approaches to localize quickly and obtain the standard imaging planes for this purpose using cine MRI. Coronal images are used to define the transverse mid-ventricular slices (i.e., oblique axial images or “quasi” four-chamber view*). The short-axis views of the left ventricle can be defined by prescribing views perpendicular to the line between the center of the mitral valve and apex on the “quasi” four-chamber view. Slices are obtained from the base of the left ventricle at the level of the mitral annulus to the apex, allowing for full LV coverage for proper calculation of LV volumes, ejection fraction, and mass.
RV function is typically evaluated using the previously described LV views to limit total imaging time. A more detailed evaluation of RV structure and function, of particular importance in the evaluation of arrhythmogenic RV dysplasia, requires the acquisition of additional views. Standard transverse views from cranial to caudal slices are roughly perpendicular to the RV outflow tract, RV free wall, and RV inflow. To visualize the diaphragmatic segment of the right ventricle, a slice planned on a coronal scout, generating an oblique sagittal view through the long axis of the RV outflow tract, should be acquired.20
Sequences
Evaluation of cardiac function involves the use of multiphase, or cine, MRI that employs fast gradient-echo imaging with k-space segmentation to acquire images during end-inspiration breath-holding, which minimizes respiratory motion artifact.21 It is generally accepted that a temporal resolution of 50 ms is required to “freeze” end-systolic motion accurately to quantify ventricular volumes and calculate ejection fraction accurately. Segmented k-space breath-hold cine imaging has an in-plane spatial resolution that typically ranges from 1.5 to 2 mm2, slice thickness of 5 to 10 mm, temporal resolution of 30 to 50 ms, and scan times of 8 to 16 s/slice. The k-space segmentation allows for shorter acquisition times and enables the acquisition of a complete set of multiphase images per slice within a breath-hold. Generally, blood appears bright and myocardium appears gray in these cine gradient-echo images; however, the specific appearance of blood, myocardium, and blood flow depends on whether spoiled gradient-recalled-echo or steady-state free precession (SSFP) is used for signal generation within the segmented k-space structure.15
The use of spoiler gradients is the most commonly employed method, and involves extending the duration of the readout gradient beyond the sampling of the echo and before the next RF pulse. The prolonged application of the gradient results in accelerated dephasing of the residual transverse magnetization.22 Because residual magnetization is spoiled, signal intensity is not maximized. To improve image quality, SSFP imaging of the heart was later developed, which offers specific advantages to cardiac imaging. This method results in improved signal-to-noise and contrast-to-noise ratios.23 With SSFP, residual transverse magnetization is refocused, not spoiled, before the next RF pulse, and signal intensity is maximized. With this method, magnetization is in a steady state, so the RF pulses are applied throughout the acquisition.
SSFP is extremely sensitive to field inhomogeneities, of particular importance at 3.0 T, where repeated local shimming or frequency manipulation may be necessary to improve image quality. Traditional fast gradient-echo pulse sequences should be used for the detection of subtle flow abnormalities in valvular heart disease, or when field inhomogeneities result in significant artifacts with SSFP.22 The energy deposition associated with continuous application of RF pulses to maintain steady-state magnetization is higher, and specific absorption rate limits may be reached during SSFP, particularly with higher performance gradient scanners.
Myocardial contractility and regional function can be evaluated further through the use of cine MRI with tagging in conjunction with segmented k-space cine gradient-echo imaging, also known as spatial modulation of magnetization. To evaluate diastolic function, the tagging pulse may be applied in late systole, with images acquired throughout diastole. Quantification of wall motion and myocardial strain can be determined based on displacement of the tagged regions.22 To overcome the time-consuming aspect of tag analysis, harmonic phase analysis and DENSE techniques have been developed to improve the postprocessing duration.24–26
Image Analysis
Quantification of myocardial mass, ventricular volumes and dimensions, stroke volume, and ejection fraction is currently done using volumetric data computed from tracings of contiguous short-axis images obtained using cine SSFP pulse sequences. It is important to identify correctly the most basal extent of the ventricle because this determines the LV volumes and the LV ejection fraction.27 Manual planimetry of LV endocardial and epicardial borders is performed during end-systole and end-diastole on each of the short-axis slices (Fig. 55-1). Because of the time required to do manual planimetry, automatic and semiautomatic methods have been developed. In studies comparing manual, automatic, and semiautomatic techniques in animals that were sacrificed for ex vivo measurements, it was determined that manual contours were closer to ex vivo measurements than automatic contours, however, which overestimates true volume.28,29 After border detection, cardiac volumes are calculated by multiplying the blood pool area (defined by the endocardial border) by the slice thickness and summing all the slices. Myocardial mass is computed from the difference between the volumes determined from the endocardial and epicardial borders multiplied by the specific gravity of the myocardium (1.05 g/cm3).15
[/not-level-membership-for-cardiovascular-category]
