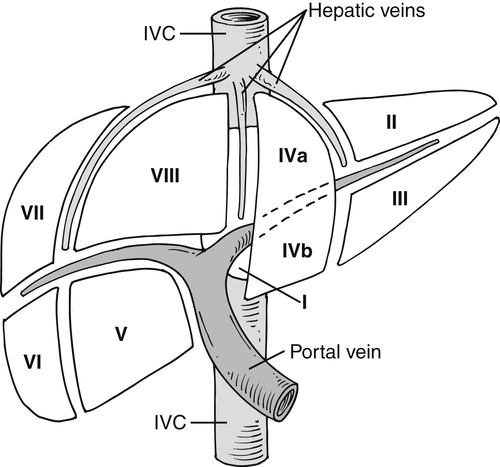
[level-membership-for-gastroenterology-and-hepatology-category]), and determination of lesion location can be critical if surgical resection is being considered. Each segment has portal veins, hepatic arteries, and bile ducts, and each drains into individual lobar hepatic veins (Table 6-1). The middle hepatic vein divides the liver into right and left lobes. The left lobe is then further subdivided by the left hepatic vein into medial (segment IV—sometimes further subdivided into segments IVa and IVb) and lateral components (segments II and III) (Figs. 6-1 and 6-2). Segments II and III are in turn separated by the left portal vein, with segment II above and segment III below (Figs. 6-1 and 6-2). The right hepatic vein subdivides the right lobe into anterior and posterior segments with the right portal vein further dividing these into upper and lower segments (Figs. 6-1 and 6-2). Segment VIII is upper anterior, segment VII is upper posterior, segment V is lower anterior, and segment VI is lower posterior. Segment I, or the caudate lobe, is posterior.
Figure 6-1 Schematic representation of hepatic Couinaud segments.
Table 6-1
Couinaud∗ Liver Segments
| Structure |
Right Lobe |
| Middle hepatic vein |
Divides right and left lobes |
| Right hepatic vein |
Separates right lobe into anterior (segments VIII and V) and posterior (segments VII and VI) |
| Right portal vein |
Separates right lobe into superior (segments VII and VIII) and inferior (segments V and VI) |
| Left hepatic vein |
Divides left lobe into medial (segment IVa and IVb) and lateral (segments II and III) |
| Left portal vein |
Separates segment II (above) and segment III (below) |
| Caudate lobe |
Segment I (posterior) |
| Falciform ligament |
Divides medial and lateral segments of left lobe (segment IV from II and III) |
| Ligamentum venosum |
Obliterated umbilical vein: extends from falciform ligament to umbilicus |
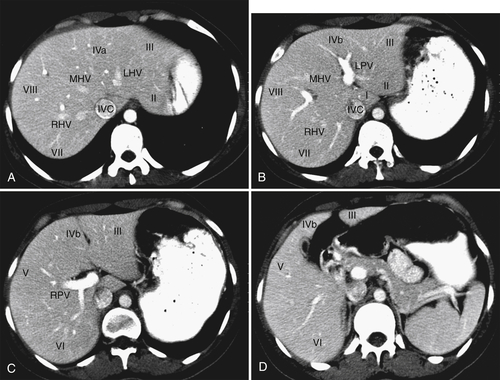
Figure 6-2 A through D, Axial contrast-enhanced images of hepatic segments. LHV, Left hepatic vein; LPV, left portal vein; RHV, right hepatic vein; RPV, right portal vein.
The liver has a dual blood supply, with approximately 80% supplied from the portal vein and 20% from the hepatic artery, and blood freely circulates into the extravascular spaces. An understanding of this paradigm is important in planning appropriate contrast-enhanced imaging protocols because different diseases have different enhancement characteristics depending on the source of their primary blood supply.
Imaging Methods
All imaging methods, from plain radiograph to positron emission tomography (PET), have a role in hepatic imaging. However, the majority of hepatic abnormalities are not only detected, but also characterized, by means of cross-sectional imaging.
Plain Radiograph and Fluoroscopy
Although infrequently used as a primary imaging tool, the plain radiograph is still useful to assess prosthetic positioning, intrahepatic gas, and occasionally calcification and hepatomegaly. Conventional fluoroscopy is still the primary method of choice for performing most interventional hepatic therapeutic procedures.
Ultrasound
Hepatic evaluation by ultrasound (US) is now considered less optimal than CT or magnetic resonance imaging (MRI), particularly in the United States, although the use of Doppler
∗ harmonic and US contrast imaging has shown some advantages. However, these are not in wide clinical use. US still has a critical role in the evaluation of cirrhosis and infiltrative disease, some specific liver lesions, and some interventional procedures. US is highly operator dependent and requires extensive training, and perhaps for these reasons CT and MRI have often superseded it in clinical practice, at least in the United States. This should not deter the radiologist from using US in the appropriate setting, however, given that it is less expensive, relatively easily available, and quick, produces no ionizing radiation, and in the right hands, provides substantial opportunities for liver lesion characterization.
Computed Tomography
Multidetector CT (MDCT) is the workhorse for hepatic imaging because of its excellent spatial and contrast resolution, speed, ease of use, reproducibility, use of intravenous (IV) contrast agents, and ability to postprocess images into multiplanar formats (particularly with the newer higher detector arrays). Imaging can be tailored to coincide with maximal parenchymal, lesion, or vascular enhancement after administration of IV contrast agents, depending on the disease in question. CT provides excellent morphologic information about both the disease and its relationship to normal anatomy. Dual-energy hardware offers further opportunity to evaluate and quantify disease. Perhaps because CT is so ubiquitous and clinically useful, some have raised concerns about overuse, mainly because of cost and radiation dose.
Whether less expensive and more nonionizing radiation techniques will supersede the current demand for CT remains to be determined.The density of the unenhanced normal liver at CT typically ranges between 55 and 65 HU. Unenhanced CT is useful for the evaluation of depositional disease (e.g., hepatic steatosis, hemochromatosis), liver calcifications, hemorrhage, and some high-contrast embolic material used for therapeutic procedures. Most patients, however, are imaged after the administration of IV iodinated contrast medium.
Because of the dual blood supply to the liver, the liver can be imaged during multiple phases. Early imaging during the arterial phase (typically a scan delay of approximately 20 seconds from the start of IV contrast injection), when most of the hepatic normal parenchyma is not yet enhanced, visualizes the arterial structures and offers the opportunity to evaluate disease that is supplied primarily with an arterial blood supply (Table 6-2 and Fig. 6-3). Maximal opacification of the portal vein occurs at approximately 40 seconds after the initiation of IV injection, and the hepatic parenchyma is subsequently maximally enhanced during the portal or hepatic venous phase, usually at approximately 60 seconds. Most hepatic lesions are hypodense during this phase, in contrast to the relatively hyperdense liver parenchyma (Fig. 6-4). A number of lesions can be further characterized with delayed imaging (either because they retain contrast material or because they are more conspicuous against the normal liver background), usually at approximately 120 to 180 seconds after initiation of the injection (Fig. 6-5). Scan times are optimized through automatic bolus tracking techniques, which trigger scanning to coincide with the optimal arterial or portal venous phase (PVP). A fundamental understanding of these vascular dynamics is required to optimize MDCT scan protocols for the disease in question. Some diseases are best imaged with one phase, some with two phases, or some even with three phases. By the addition of a noncontrast CT, the lesions can potentially be evaluated with four phases, although because of the radiation burden this should be avoided unless clinically necessary.
Table 6-2
Phase of CT Imaging in Hepatic Disease
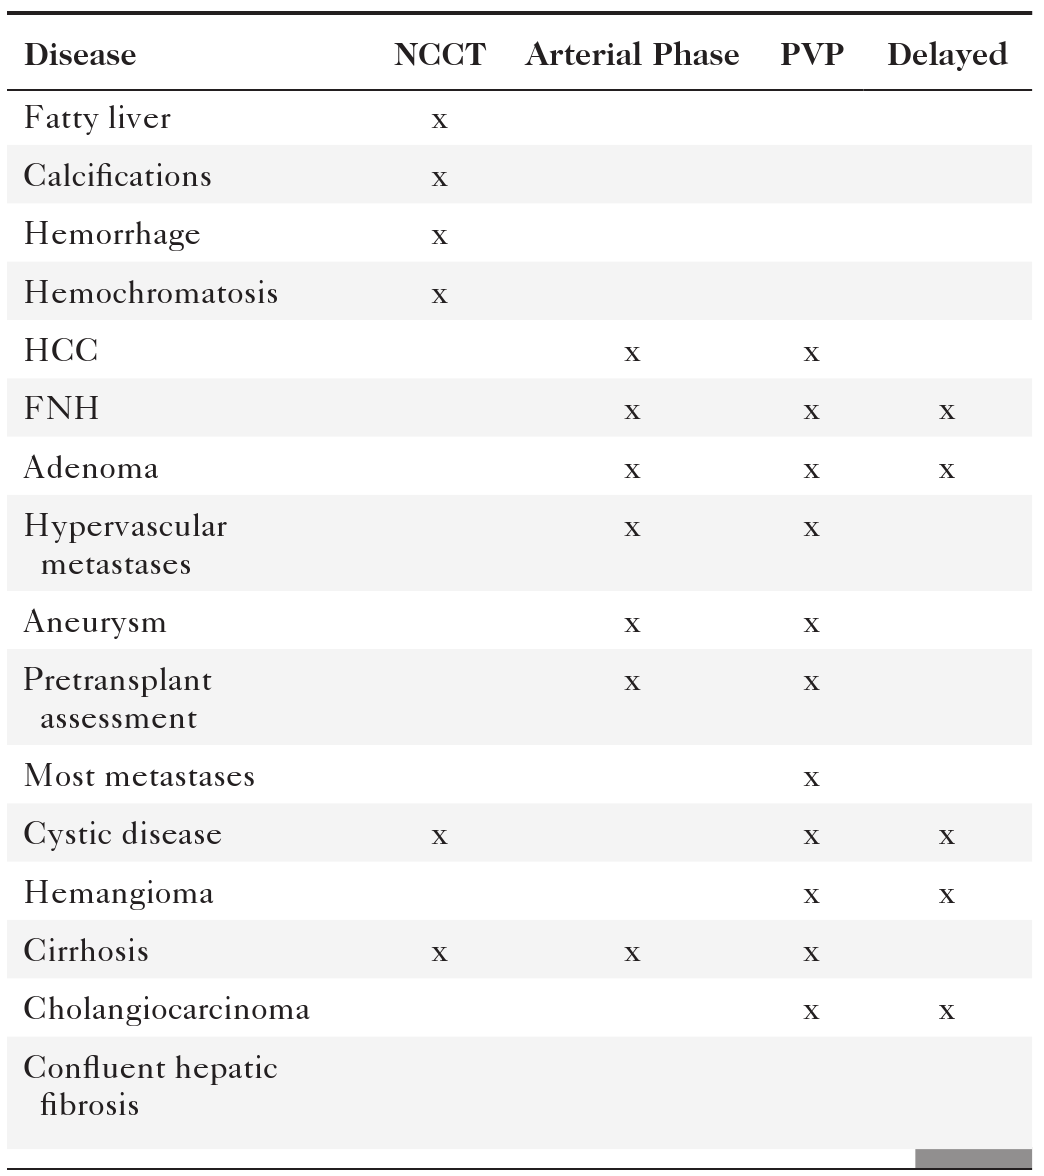
CT, Computed tomography; FNH, focal nodular hyperplasia; HCC, hepatocellular carcinoma; NCCT, noncontrast CT scan; PVP, portal venous phase.
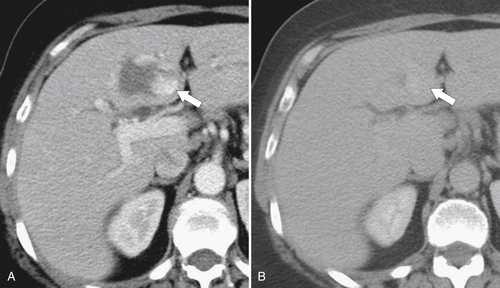
Figure 6-3 Axial contrast-enhanced CT in arterial phase (A) and PVP (B) in a 79-year-old woman with metastatic HCC (arrows). Their vascular supply is arterial, and the tumor burden is not appreciated during the PVP.
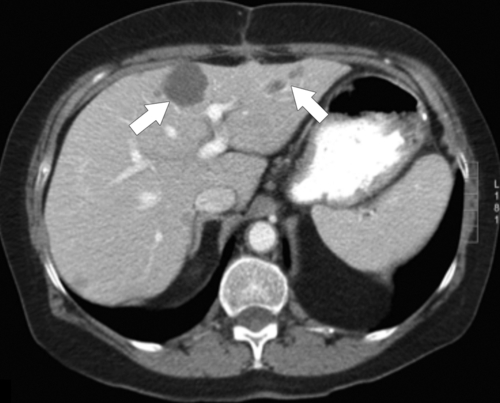
Figure 6-4 Axial contrast-enhanced CT in the PVP in a 49-year-old woman with cystic gastrointestinal stromal tumor metastases (arrows). These lesions are best visualized with the normal hepatic parenchyma opacified.
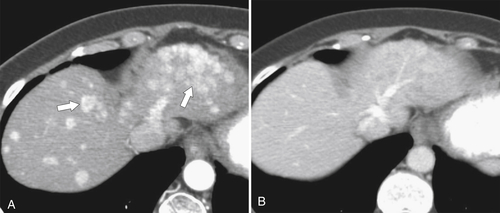
Figure 6-5 Axial PVP (A) and delayed-phase (B) contrast-enhanced CT in a 52-year-old woman with hemangioma. The lesion (arrows) demonstrates peripheral nodular enhancement that fills in on delayed imaging, characteristic of the hemangioma.
Magnetic Resonance Imaging
Magnetic resonance imaging (MRI) is the method of choice for evaluation of many hepatic abnormalities, mainly because of its superior contrast resolution, increasing availability, lack of ionizing radiation, use of innovative contrast agents, and multiplanar capability, as well as the development of many coils, new software, and postprocessing advances that can exploit differences in tissue characteristics. MRI can also provide more morphological and functional information than CT. Therefore, when US or CT identifies an incidental hepatic mass that cannot be characterized definitively, MRI is the next investigation of choice, despite its cost, because of its superior sensitivity and specificity. Many of the disadvantages described in the previous edition of this book are now mitigated because of technological developments, including faster scan times and respiratory gating, both of which minimize motion artifact and optimize scan times to provide the best possible tissue enhancement after the administration of IV contrast agents. There are more powerful gradients and body coils and three-dimensional data acquisitions, leading to enhanced image quality. Conversely, however, as the number of novel new protocols has increased, overall scan times have not necessarily decreased.
Conventional Magnetic Resonance Imaging Sequences
The physics and a detailed discussion of MRI pulse sequences (many of which have acronyms specific to the vendor) are beyond the scope of this book, but most abdominal MRI sequences use T1 (with or without fat saturation), in-phase (IP) and out-of-phase
(OOP) imaging (or other fat-suppression techniques, e.g., Dixon), T2, and postcontrast T1 (with or without fat saturation) images. Most of these sequences are now considerably faster than those of previous MRI generations. The normal liver typically demonstrates a slightly higher T1-weighted signal and slightly lower T2-weighted signal when compared with those of the spleen. Most biliary and vascular structures are of low signal on T1-weighted images, but bile, in particular, is of high signal of T2-weighted images, hence its use in magnetic resonance cholangiopancreatography (MRCP).
Fat-Suppression Techniques
Simple fat-suppression techniques (performed on both T1 and T2 sequences) are available for all MRI scanners and null out signal in voxels with high fatty content. These techniques are most useful when evaluating disease in anatomical locations with a large amount of normal fat (e.g., peritoneum) because the resulting fat signal loss increases the contrast of any abnormal tissue with inherent higher signal (e.g., inflammatory and many benign or malignant masses that demonstrate enhancement after the administration of IV contrast agents). Furthermore, they can be used to evaluate abnormalities with substantial fatty components (fatty liver, dermoid cysts, adrenal myelolipoma, and adenomas). Alternatively, fat-containing tissue can be evaluated with IP and OOP chemical shift MRI or Dixon fat-suppression techniques, and inversion recovery sequences are also available (
Fig. 6-7).
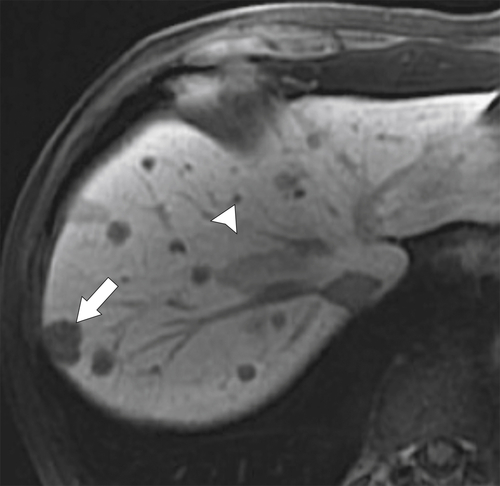
Figure 6-7 In-phase (A) and out-of-phase (B) MRI in a 54-year-old woman with focal fatty sparing. There is diffuse hepatic signal drop-off on out-of-phase imaging “unmasking” the normal “fat sparing” in the gallbladder fossa (arrow).
Magnetic Resonance Imaging Contrast Agents
The three main classes of MRI contrast agents are extracellular, hepatobiliary, and mononuclear phagocytic (formerly reticuloendothelial). Extracellular agents are the most common and include gadopentetate dimeglumine (Gd-DTPA). These agents behave similarly to iodinated contrast agents used in CT. They circulate freely in the extracellular spaces before being excreted predominantly in the kidneys. As with contrast-enhanced CT, the detection and characterization of liver lesions depend on the differential arterial or portal venous enhancement of liver lesions or lack of enhancement compared with that of normal hepatic parenchyma.
Hepatobiliary agents are specifically absorbed by hepatocytes and partially excreted in bile and the kidneys (
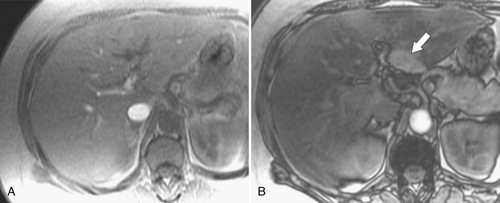
Fig. 6-8), so detection and characterization of lesions depend on whether they retain hepatocyte function (e.g., focal nodular hyperplasia [FNH], some well-differentiated hepatocellular carcinoma [HCC]) or not (hemangiomas, metastases, and cysts). These agents include manganese-based mangafodipir trisodium (Mn-DPDP) and gadolinium-based gadoxetate disodium (Gd-EOB-DTPA) and gadobenate dimeglumine (Gd-BOPTA). The latter two agents permit both dynamic imaging (similar to extracellular agents) and delayed hepatocyte-phase imaging, at which point the normal liver parenchyma enhances. The superior contrast differences between normal liver and nonhepatocytic lesions (i.e., metastases) on delayed imaging can permit the detection of very small lesions compared with conventional techniques (Fig. 6-9). However, because the concentration of gadolinium in these agents is less than is used with conventional gadolinium agents, the intensity of enhancement at dynamic imaging (i.e., arterial or PVP) may be less than that observed with extracellular agents. Subtraction imaging may therefore be useful, which simply involves the digital subtraction of the unenhanced T1-weighted image from the contrast-enhanced sequence such that any remaining signal is caused only by tissue enhancement (Fig. 6-10). Delayed imaging with hepatobiliary agents has proved particularly useful in assessing whether patients with metastatic liver disease are candidates for curative resection because lesions in both right and left lobes generally preclude surgery.
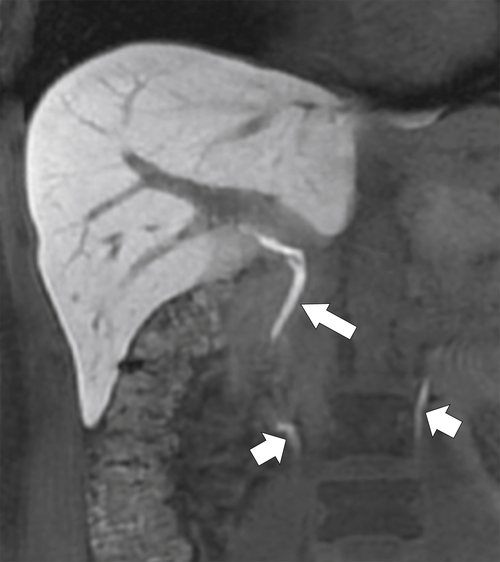
Figure 6-8 A 20-minute coronal T1-weighted fat-saturated postcontrast hepatobiliary MRI demonstrating marked hepatic parenchymal enhancement and biliary (arrow) and renal (small arrows) excretion of contrast material.
Figure 6-9 A 20-minute axial T1-weighted fat-saturated posthepatobiliary contrast MRI in a 61-year-old man with numerous liver metastases (arrow), some very small (arrowhead) and detected only with this technique.
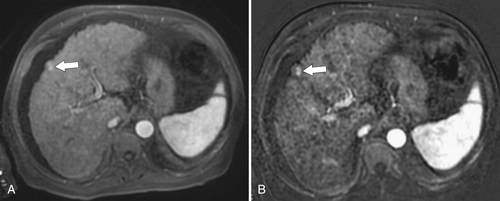
Figure 6-10 A, Axial hepatobiliary agent fat-saturated contrast-enhanced MRI and subtraction image in a 74-year-old man with cirrhosis and questionable area of enhancement in segment V (arrow). B, Subtraction images confirm enhancement in a new HCC (arrow).
The mononuclear phagocytic (reticuloendothelial) agents (or ferumoxides) contain iron and are taken up by Kupffer
∗ phagocytic cells. Delayed imaging demonstrates loss of signal in normal anatomical structures but no loss of signal in cells that do not retain the contrast agent, either because they contain no Kupffer activity or because these tissues are replaced by the disease process (i.e., metastases). These agents are less in clinical use than extracellular and hepatobiliary agents.
Diffusion-Weighted Imaging
Diffusion-weighted imaging (DWI) is a newer technique, now gaining widespread use in clinical practice, that offers the opportunity to detect more lesions when compared with conventional MRI sequences and to aid with lesion characterization, particularly the differentiation between benign and malignant disease.
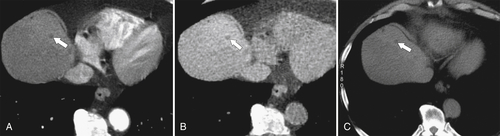
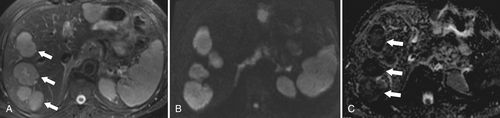
Figure 6-11 Axial T2-weighted (A), B500 (B), and ADC (C) DWI in a 73-year-old man with multiple liver metastases (arrows). The lesions are bright on T2-weighted and B500 imaging but dark on ADC maps.
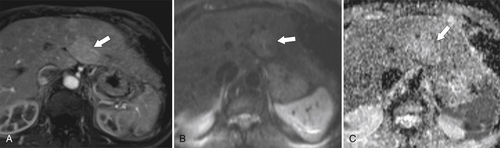
Figure 6-12 Axial arterial-phase hepatobiliary agent T1-weighted (A) MRI and B500 (B) and ADC (C) maps in a 57-year-old woman with focal nodular hyperplasia. There is mild arterial enhancement (arrows) and slight increased signal on DWI and ADC maps.
The degree of proton motion in capillaries and tissues can be measured and quantified as the apparent diffusion coefficient (ADC). A slope can be plotted that represents the ADC, which, in turn, represents each voxel’s diffusion value. Typically, the ADC is displayed pictorially as a parametric map on an axial image on which a region of interest can be placed to measure a mean ADC within the area selected. An ADC map can also reflect the signal intensities of a tissue obtained at the different b values across a range of voxels. Malignant lesions tend to demonstrate little or no signal on ADC maps (
Fig. 6-11), whereas benign lesions (less water restriction) show higher signal (
Fig. 6-12).
These findings are usually evaluated qualitatively, but threshold ADC cutoff values to separate benign from malignant lesions can be generated.Care should be taken to evaluate the diffusion-weighted b value images along with the ADC map, since some cystic lesions demonstrate no increase on ADC maps because of T2 “shine-through.” Furthermore, restricted diffusion can be observed in some benign lesions (some hepatic adenomas and FNH, abscess, and fibrosis) and, conversely, increased diffusion in some malignant lesions (cystic metastases). These pitfalls can generally be mitigated by evaluating conventional MRI (contrast- and non-contrast-enhanced) images.
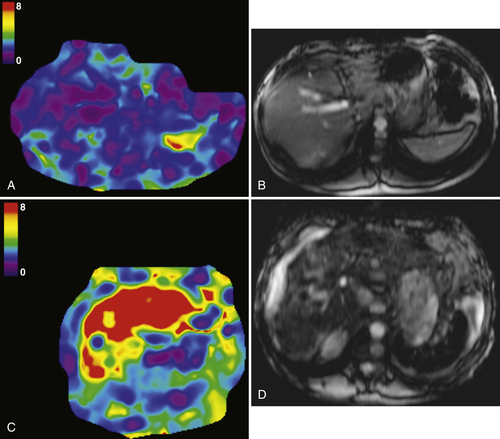
Magnetic Resonance Elastography
An evolving technique, magnetic resonance elastography has shown that the “stiffness” of the liver (typically found in cirrhosis and fibrosis) can be measured by evaluating the shear-wave transients propagated through liver parenchyma. The images can be color coded to reflect the shear wavelength or the mean shear stiffness (in kilopascals
∗) of cirrhotic livers (
Fig. 6-13).
Figure 6-13 A and B, Normal elastography in a 38-year-old man. The raw MRI T2-weighted images demonstrate a normal liver, and sound transmission meets low impedance (0-1 kPa). C and D, Elastography in a 55-year-old man with cirrhosis and a “stiff” liver as evidenced by high impedance (7-8 kPa) to sound waves (arrows).
Nuclear Medicine
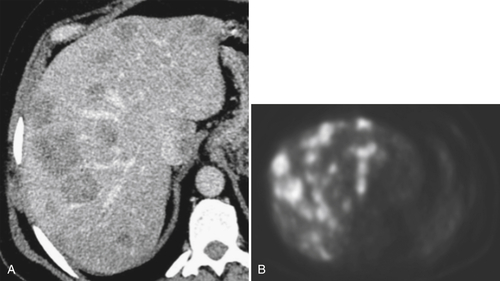
With the relatively widespread distribution of PET and PET/CT scanners, PET body imaging has now regained much of the ground it had lost to other cross-sectional imaging techniques. Although there is still a role for more conventional nuclear medicine techniques, their hepatic applications have largely been superseded by PET. PET/CT scanners offer the unique combination of morphological (CT) and functional/metabolic (PET) imaging. PET imaging exploits the requirement for most malignant lesions to metabolize glucose at a far higher rate than normal tissue or benign disease (
Fig. 6-14). Most PET applications attach the radioisotope 18F-fluorodeoxyglucose (FDG) to glucose molecules that are injected intravenously. Whole body or selected scanning is performed approximately 45 minutes later. Malignant tissues typically demonstrate increased uptake, although some benign inflammatory or neoplastic conditions in the abdomen may also show mild and occasionally avid uptake.
Figure 6-14 Axial contrast-enhanced CT (A) and PET (B) in a 50-year-old man with multiple colon metastases. More are identified at PET.
PET imaging is now routinely used to evaluate the metabolic response of a variety of solid organ body malignancies to chemotherapy, radiation, and other interventional treatment regimens, which can often document responses earlier than the morphological features seen with CT and MRI. Furthermore, some tumors (e.g., melanoma) are highly avid for 18F-FDG PET, which has increased the likelihood of detecting very small deposits, often a challenge because of surrounding muscle or peritoneum. However, PET or PET/CT is infrequently used as a front-line investigation in the liver, even to evaluate therapeutic responses, partly because of its relatively poor spatial resolution compared with MRI and also because of expense, availability, and radiation burden.
Angiography
Angiographic hepatic evaluation is confined to therapeutic procedures mainly outside the scope of this book, including treatment of arterial malformations and aneurysms, procedures to relieve portal hypertension (transjugular intrahepatic portosystemic shunting [TIPS]), and treatment of some unresectable malignancies (transarterial chemoembolization [TACE]).
[/level-membership-for-gastroenterology-and-hepatology-category][not-level-membership-for-gastroenterology-and-hepatology-category]), and determination of lesion location can be critical if surgical resection is being considered. Each segment has portal veins, hepatic arteries, and bile ducts, and each drains into individual lobar hepatic veins (Table 6-1). The middle hepatic vein divides the liver into right and left lobes. The left lobe is then further subdivided by the left hepatic vein into medial (segment IV—sometimes further subdivided into segments IVa and IVb) and lateral components (segments II and III) (Figs. 6-1 and 6-2). Segments II and III are in turn separated by the left portal vein, with segment II above and segment III below (Figs. 6-1 and 6-2). The right hepatic vein subdivides the right lobe into anterior and posterior segments with the right portal vein further dividing these into upper and lower segments (Figs. 6-1 and 6-2). Segment VIII is upper anterior, segment VII is upper posterior, segment V is lower anterior, and segment VI is lower posterior. Segment I, or the caudate lobe, is posterior.
Figure 6-1 Schematic representation of hepatic Couinaud segments.
Table 6-1
Couinaud∗ Liver Segments
| Structure |
Right Lobe |
| Middle hepatic vein |
Divides right and left lobes |
| Right hepatic vein |
Separates right lobe into anterior (segments VIII and V) and posterior (segments VII and VI) |
| Right portal vein |
Separates right lobe into superior (segments VII and VIII) and inferior (segments V and VI) |
| Left hepatic vein |
Divides left lobe into medial (segment IVa and IVb) and lateral (segments II and III) |
| Left portal vein |
Separates segment II (above) and segment III (below) |
| Caudate lobe |
Segment I (posterior) |
| Falciform ligament |
Divides medial and lateral segments of left lobe (segment IV from II and III) |
| Ligamentum venosum |
Obliterated umbilical vein: extends from falciform ligament to umbilicus |
Figure 6-2 A through D, Axial contrast-enhanced images of hepatic segments. LHV, Left hepatic vein; LPV, left portal vein; RHV, right hepatic vein; RPV, right portal vein.
The liver has a dual blood supply, with approximately 80% supplied from the portal vein and 20% from the hepatic artery, and blood freely circulates into the extravascular spaces. An understanding of this paradigm is important in planning appropriate contrast-enhanced imaging protocols because different diseases have different enhancement characteristics depending on the source of their primary blood supply.
Imaging Methods
All imaging methods, from plain radiograph to positron emission tomography (PET), have a role in hepatic imaging. However, the majority of hepatic abnormalities are not only detected, but also characterized, by means of cross-sectional imaging.
Plain Radiograph and Fluoroscopy
Although infrequently used as a primary imaging tool, the plain radiograph is still useful to assess prosthetic positioning, intrahepatic gas, and occasionally calcification and hepatomegaly. Conventional fluoroscopy is still the primary method of choice for performing most interventional hepatic therapeutic procedures.
Ultrasound
Hepatic evaluation by ultrasound (US) is now considered less optimal than CT or magnetic resonance imaging (MRI), particularly in the United States, although the use of Doppler
∗ harmonic and US contrast imaging has shown some advantages. However, these are not in wide clinical use. US still has a critical role in the evaluation of cirrhosis and infiltrative disease, some specific liver lesions, and some interventional procedures. US is highly operator dependent and requires extensive training, and perhaps for these reasons CT and MRI have often superseded it in clinical practice, at least in the United States. This should not deter the radiologist from using US in the appropriate setting, however, given that it is less expensive, relatively easily available, and quick, produces no ionizing radiation, and in the right hands, provides substantial opportunities for liver lesion characterization.
Computed Tomography
Multidetector CT (MDCT) is the workhorse for hepatic imaging because of its excellent spatial and contrast resolution, speed, ease of use, reproducibility, use of intravenous (IV) contrast agents, and ability to postprocess images into multiplanar formats (particularly with the newer higher detector arrays). Imaging can be tailored to coincide with maximal parenchymal, lesion, or vascular enhancement after administration of IV contrast agents, depending on the disease in question. CT provides excellent morphologic information about both the disease and its relationship to normal anatomy. Dual-energy hardware offers further opportunity to evaluate and quantify disease. Perhaps because CT is so ubiquitous and clinically useful, some have raised concerns about overuse, mainly because of cost and radiation dose.
Whether less expensive and more nonionizing radiation techniques will supersede the current demand for CT remains to be determined.The density of the unenhanced normal liver at CT typically ranges between 55 and 65 HU. Unenhanced CT is useful for the evaluation of depositional disease (e.g., hepatic steatosis, hemochromatosis), liver calcifications, hemorrhage, and some high-contrast embolic material used for therapeutic procedures. Most patients, however, are imaged after the administration of IV iodinated contrast medium.
Because of the dual blood supply to the liver, the liver can be imaged during multiple phases. Early imaging during the arterial phase (typically a scan delay of approximately 20 seconds from the start of IV contrast injection), when most of the hepatic normal parenchyma is not yet enhanced, visualizes the arterial structures and offers the opportunity to evaluate disease that is supplied primarily with an arterial blood supply (Table 6-2 and Fig. 6-3). Maximal opacification of the portal vein occurs at approximately 40 seconds after the initiation of IV injection, and the hepatic parenchyma is subsequently maximally enhanced during the portal or hepatic venous phase, usually at approximately 60 seconds. Most hepatic lesions are hypodense during this phase, in contrast to the relatively hyperdense liver parenchyma (Fig. 6-4). A number of lesions can be further characterized with delayed imaging (either because they retain contrast material or because they are more conspicuous against the normal liver background), usually at approximately 120 to 180 seconds after initiation of the injection (Fig. 6-5). Scan times are optimized through automatic bolus tracking techniques, which trigger scanning to coincide with the optimal arterial or portal venous phase (PVP). A fundamental understanding of these vascular dynamics is required to optimize MDCT scan protocols for the disease in question. Some diseases are best imaged with one phase, some with two phases, or some even with three phases. By the addition of a noncontrast CT, the lesions can potentially be evaluated with four phases, although because of the radiation burden this should be avoided unless clinically necessary.
Table 6-2
Phase of CT Imaging in Hepatic Disease
CT, Computed tomography; FNH, focal nodular hyperplasia; HCC, hepatocellular carcinoma; NCCT, noncontrast CT scan; PVP, portal venous phase.
Figure 6-3
Buy Membership for Gastroenterology and Hepatology Category to continue reading.
Learn more here
[/not-level-membership-for-gastroenterology-and-hepatology-category]
Gastrointestinal Imaging The Requisites