6 Laboratory data
It is usual for a reference range to be quoted for each individual test (see Tables 6.1 and 6.4). This range is based on data obtained from a sample of the general population which is assumed to be disease-free. Many test values have a normal distribution and the reference values are taken as the mean ± 2 standard deviations (SD). This includes 95% of the population. The ‘normal’ range must always be used with caution since it takes little account of an individual’s age, sex, weight, height, muscle mass or disease state, many of which variables can influence the value obtained. Although reference ranges are valuable guides, they must not be used as sole indicators of health and disease. A series of values rather than a simple test value may be required in order to ensure clinical relevance and to eliminate erroneous values caused, for example, by spoiled specimens or interference from diagnostic or therapeutic procedures. Furthermore, a disturbance of one parameter often cannot be considered in isolation without looking at the pattern of other tests within the group.
Table 6.1 Biochemical data: typical normal adult reference values measured in serum
| Laboratory test | Reference range |
|---|---|
| Urea and electrolytes | |
| Sodium | 135–145 mmol/L |
| Potassium | 3.4–5.0 mmol/L |
| Calcium (total) | 2.12–2.60 mmol/L |
| Calcium (ionised) | 1.19–1.37 mmol/L |
| Phosphate | 0.80–1.44 mmol/L |
| Magnesium | 0.7–1.00 mmol/L |
| Creatinine | 75–155 μmol/L |
| Urea3.1–7.9 mmol/L | |
| Estimated glomerular filtration rate (eGFR) | ≥ 90 ml/min/1.73m2 |
| Glucose | |
| Fasting | 3.3–6.0 mmol/L |
| Non-fasting | <11.1 mmol/L |
| Glycated haemoglobin | Non-diabetic subjects <43 mmol/mol |
| Inadequate control >58 mmol/mol | |
| Liver function tests | |
| Albumin | 34–50 g/L |
| Bilirubin (total) | <19 μmol/L |
| Enzymes | |
| Alanine transaminase | <45 U/L |
| Aspartate transaminase | <35 U/L |
| Alkaline phosphatase | 35–120 U/L |
| γ-Glutamyl transpeptidase | <70 U/L |
| Ammonia | |
| Men | 15–50 μmol/L |
| Female | 10–40 μmol/L |
| Amylase | <100 U/L |
| Cardiac markers | |
| Troponin I | (99th percentile of upper reference limit) 0.04 μcg/L |
| Other tests | |
| C-reactive protein (CRP) | 0–5 mg/L |
| Osmolality | 282–295 mOsmol/kg |
| Uric acid | 0.15–0.47 mmol/L |
| Parathyroid hormone (adult with normal calcium) | 10–65 ng/L |
| 25-Hydroxyvitamin D | >75 nmol/L (optimal) |
| >50 nmol/L (sufficient) | |
| 30–50 nmol/L (insufficient) | |
| 12–30 nmol/L (deficient) | |
| <12 nmol/L (severely deficient) | |
Table 6.4 Haematology data: typical normal adult reference values
| Haemoglobin | 11.5–16.5 g/dL |
| Red blood cell (RBC) count | 3.8–4.8 × 10¹²/L |
| Reticulocyte count | 50–100 × 109/L |
| Packed cell volume (PCV) | 0.36–0.46 L/L |
| Mean cell volume (MCV) | 83–101 fL |
| Mean cell haemoglobin (MCH) | 27–34 pg |
| Mean cell haemoglobin concentration (MCHC) | 31.5–34.5 g/dL |
| White cell count (WBC) | 4.0–11.0 × 10⁹/L |
| Differential white cell count: | |
| Neutrophils (30–75%) | 2.0–7.0 × 10⁹/L |
| Lymphocytes (5–15%) | 1.5–4.0 × 10⁹/L |
| Monocytes (2–10%) | 0.2–0.8 ×10⁹/L |
| Basophils (<1%) | <0.1 × 10⁹/L |
| Eosinophils (1–6%) | 0.04–0.4 × 10⁹/L |
| Platelets | 150–450 × 109/L |
| Erythrocyte sedimentation rate (ESR) | 1–35 mm/h |
| D-dimers | 0–230 ng/mL |
| Ferritin | 15–300 μcg/L |
| Total iron binding capacity (TIBC) | 47–70 μmol/L |
| Serum B12 | 170–700 ng/L |
| Red cell folate | 160–600 μcg/l |
| Iron | 11–29 μmol/L |
| Transferrin | 1.7–3.4 g/L |
Biochemical data
Sodium and water balance
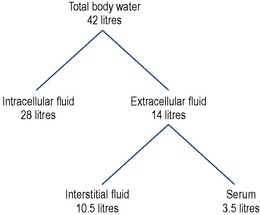
Water constitutes approximately 60% of body weight in men and 55% in women (women have a greater proportion of fat tissue which contains little water). Approximately two-thirds of body water is found in the intracellular fluid (ICF) and one-third in the extracellular fluid (ECF). Of the ECF 75% is found within interstitial fluid and 25% within serum (Fig. 6.1). Total body water is regulated by the renal action of antidiuretic hormone (ADH), the renin angiotensin–aldosterone system, noradrenaline/norepinephrine and by thirst which is stimulated by rising plasma osmolality.
The major contributor to the osmolality of the ICF is potassium.
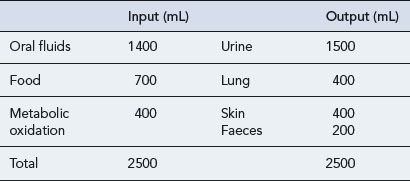
The amount of water taken in and lost by the body depends on intake, diet, activity and the environment. Over time the intake of water is normally equal to that lost (Table 6.2). The minimum daily intake necessary to maintain this balance is approximately 1100 mL. Of this, 500 mL is required for normal excretion of waste products in urine, whilst the remaining volume is lost via the skin in sweat, via the lungs in expired air, and in faeces. The kidneys regulate water balance, water being filtered, then reabsorbed in variable amounts depending primarily on the level of ADH.
Sodium depletion
Hypernatraemia
The signs and symptoms of hypernatraemia include muscle weakness and confusion.
Hypernatraemia can be caused by a number of other drugs (Box 6.1) and by a variety of mechanisms; for example, hypernatraemia secondary to sodium retention is known to occur with corticosteroids whilst the administration of sodium-containing drugs parenterally in high doses also has the potential to cause hypernatraemia.
Hyponatraemia
A fall in the serum sodium level can be the result of sodium loss, water retention in excess of sodium usually resulting from defects in free water excretion due to low ECF volume or inappropriate secretion of ADH. Increased water intake may also contribute, or a combination of both factors. A number of drugs have also been implicated as causing hyponatraemia (Box 6.2).
Potassium
Hypokalaemia
Loss from the kidneys
The most commonly used groups of drugs that can cause hypokalaemia are thiazide and loop diuretics. Both groups of drugs increase the amount of sodium delivered and available for reabsorption at the distal convoluted tubule and collecting duct. Consequently, this will increase the amount of potassium excreted from the kidneys. Some of the drugs known to cause hypokalaemia are shown in Box 6.3.
Hyperkalaemia
The majority of body potassium is intracellular. Severe tissue damage, catabolic states or impairment of the energy-dependent sodium pump, caused by hypoxia or diabetic ketoacidosis, may result in apparent hyperkalaemia due to potassium moving out of and sodium moving into cells. If serum potassium rises, insulin release is stimulated which, through increasing activity in Na/K-ATPase pumps, causes potassium to move into cells. Box 6.4 gives examples of some drugs known to cause hyperkalaemia.
Calcium
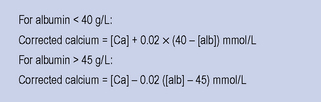
Changes in serum albumin also affect the total serum calcium concentration independently of the ionised concentration. A variety of equations are available to estimate the calcium concentration and many laboratories report total and adjusted calcium routinely. A commonly used formula is shown in Fig. 6.2. Caution must be taken when using such a formula in the presence of disturbed blood hydrogen ion concentrations.
Bicarbonate and acid–base
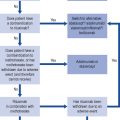
Bicarbonate acts as part of the carbonic acid–bicarbonate buffer system, which is important to maintain acid–base balance and thus the pH of the blood. pH homeostasis is accomplished through the interaction of lungs, kidneys and blood buffers. This interaction is best represented by the Henderson–Hasselbalch equation, an equation by which the pH of a buffer solution, blood plasma being one, can be determined (Fig. 6.3).
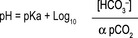
Plasma bicarbonate is controlled mainly by kidney and blood buffers. The lungs control the PaCO2.
Liver function tests (LFTs)
Enzymes
The enzymes measured in routine LFTs are listed in Table 6.1. Enzyme concentrations in the serum of healthy individuals are normally low. When cells are damaged, increased amounts of enzymes are detected as the intracellular contents are released into the blood.
Cardiac markers
Creatine kinase (CK)
CK is an enzyme which is present in relatively high concentrations in heart muscle, skeletal muscle and in brain in addition to being present in smooth muscle and other tissues. Levels are markedly increased following shock and circulatory failure, myocardial infarction and muscular dystrophies. Less marked increases have been reported following muscle injury, surgery, physical exercise, muscle cramp, an epileptic fit, intramuscular injection and hypothyroidism. The most important adverse effects associated with statins are myopathy and an increase in hepatic transaminases, both of which occur infrequently. Statin-associated myopathy represents a broad clinical spectrum of disorders, from mild muscle aches to severe pain and restriction in mobility, with grossly elevated CK levels. In rhabdomyolysis, a potentially life-threatening syndrome resulting from the breakdown of skeletal muscle fibres as a result of ischaemic crush injury, for example, large quantities of CK are measurable in the blood with the level of CK in the blood predicting the developments of acute renal failure. Medications and toxic substances that increase the risk of rhabdomyolysis are shown in Table 6.3.
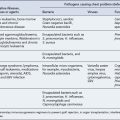
Table 6.3 Medications and toxic substances that increase the risk of rhabdomyolysis
| Direct myotoxicity | Indirect muscle damage |
|---|---|
| HMG-CoA reductase inhibitors, especially in combination with fibrate-derived lipid-lowering agents such as niacin (nicotinic acid) | Alcohol Central nervous system depressants Cocaine |
| Ciclosporin | Amphetamine |
| Itraconazole | Ecstasy (MDMA) |
| Erythromycin | LSD |
| Colchicine Zidovudine |
Neuromuscular blocking agents |
| Corticosteroids |
HMG-CoA, 3-hydroxy-3-methylglutaryl coenzyme A; LSD, lysergic acid diethylamide; MDMA, methylene dioxymethamphetamine.
Haematology data
Typical measurements reported in a haematology screen, with their normal values, are shown in Table 6.4, whilst a list of the common descriptive terms used in haematology is presented in Table 6.5.
| Anisocytosis | Abnormal variation in cell size (usually refers to RBCs), for example, red cells in iron deficiency anaemia |
| Agranulocytosis | Lack of granulocytes (principally neutrophils) |
| Aplastic | Depression of synthesis of all cell types in bone marrow (as in aplastic anaemia) |
| Basophilia | Increased number of basophils |
| Hypochromic | MCHC low, red cells appear pale microscopically |
| Leucocytosis | Increased white cell count |
| Leucopenia | Reduced white cell count |
| Macrocytic | Large cells |
| Microcytic | Small cells |
| Neutropenia | Reduced neutrophil count |
| Neutrophilia | Increased neutrophil count |
| Normochromic | MCHC normal; red cells appear normally pigmented |
| Pancytopenia | Decreased number of all cell types: it is synonymous with aplastic anaemia |
| Poikilocytosis | Abnormal variation in cell shape, for example, some red cells appear pear shaped in macrocytic anaemias |
| Thrombocytopenia | Lack of platelets |
RBC count
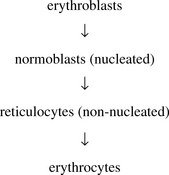
Normally, only reticulocytes and non-nucleated mature erythrocytes are seen in the peripheral blood.

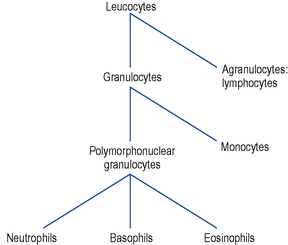
White blood cell (WBC) count
White cells (leucocytes) are of two types: the granulocytes and the agranular cells. They are made up of various types of cells (Fig. 6.4) with different functions and it is logical to consider them separately. A haematology profile often reports a total white cell count and a differential count, the latter separating the composition of white cells into the various types.
Other blood tests
Coagulation
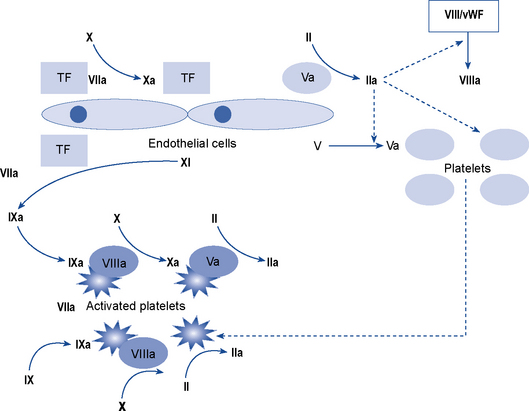
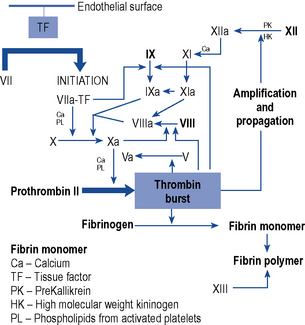
Coagulation is the process by which a platelet and fibrin plug is formed to seal a site of injury or rupture in a blood vessel. The current model of a ‘coagulation network’ differs from the previous popular cascade scheme. It proposes that blood coagulation is localised on the surfaces of activated cells in three overlapping steps: initiation, amplification and propagation. Coagulation is initiated when a tissue factor (TF) bearing cell is exposed to blood flow, following either damage of endothelium such as by perforation of a vessel wall or activation by chemicals, cytokines or the inflammatory process. The formation of a clot then involves a complex interaction between platelets and factor VIII bound to von Willebrand factor which leave the vascular space and adhere to collagen and other matrix components at the site of injury. The coagulation process is amplified when enough thrombin is generated on or near the TF bearing cells to trigger full activation of platelets and coagulation co-factors on the platelet surface. It ends with the generation of sufficient thrombin, to clot fibrinogen. To prevent inappropriate propagation of the thrombus, the process is controlled by naturally occurring anticoagulants and the fibrinolytic system, the final effector of which is plasmin which cleaves fibrin into soluble degradation products. The interaction between TF and factor VII is the most important in the initiation of coagulation and many of the coagulation reactions occur on the surface of cells (particularly platelets). The cellular model of normal haemostasis is shown in Fig. 6.5. Despite the complexity of this model, the basic coagulation tests can still be interpreted in relation to the ‘intrinsic’, ‘extrinsic’, and ‘final common pathway’ components of the traditional and previously held cascade (Fig. 6.6). The extrinsic pathway can be considered to consist of the factor VIIa/TF complex working with the factor Xa/Va complex and the intrinsic pathway to consist of factor XIa working with the complexes of factors VIIIa/IXa and factors Xa/Va. The extrinsic pathway operates on the TF bearing cell to initiate and amplify coagulation with the intrinsic pathway operating on the activated platelet surface to produce the burst of thrombin to form and stabilise the fibrin clot.
Monitoring anticoagulant therapy
Activated partial thromboplastin time (APTT)
The APTT is the most common method for monitoring unfractionated heparin therapy.
Vitamin B12 and folate
Case 6.1
| Alkaline phosphatase | 436 U/L |
| Total calcium | 2.27 mmol/L |
| Ionised calcium | 1.10 mmol/L |
| Phosphate | 0.97 mmol/L |
| Vitamin D | 6 nmol/L |
| Parathyroid hormone | 434 ng/L |
| Urea | 4.6 mmol/L |
| Creatinine | 63 μmol/L |
Answers
Case 6.2
| Haematology results: | Hb 8.8 g/dL |
| RBC 4.7 × 10¹²/L | |
| Platelets | 570 × 109/L |
| INR | 6.0 |
MCV, MCH and the rest of the blood profile are normal
Clinical biochemistry:Urea 11.6 mmol/L
Creatinine is normal and sodium and potassium concentrations are normal.
Answers
Case 6.3
| Sodium | 158 mmol/L |
| Potassium | 4.6 mmol/L |
| Urea | 44 mmol/L |
| Creatinine | 250 μmol/L |
| Random blood glucose | 38 mmol/L |
| pH | 7.39 |
| pCO2 | 5.0 kPa |
| Actual bicarbonate | 24 mmol/L |
| pO2 | 12.7 kPa |