Chapter 20 Laboratory control of anticoagulant, thrombolytic and antiplatelet therapy
Oral anticoagulant treatment using vitamin K antagonists
It has not yet proved possible to produce a therapeutic reduction in thrombotic tendency without increasing the risk of haemorrhage. The purpose of laboratory control is to maintain a level of hypocoagulability that effectively minimizes the combined risks of haemorrhage and thrombosis: the therapeutic range. Individual responses to oral anticoagulant treatment with vitamin K antagonists1 are extremely variable and so must be regularly and frequently controlled by laboratory tests to ensure that the anticoagulant effect remains within the therapeutic range.
Methods Used for the Laboratory Control of Oral Anticoagulant Treatment
Chromogenic substrate assays of factors X, VII or II have been used for the control of anticoagulant treatment and might be necessary when baseline tests are abnormal. Although it is possible to use such a single factor measurement, it must be remembered that the PT measures the effect of three vitamin K-dependent factors (factors VII, X and II) and is also affected by the presence of PIVKAs (proteins induced by vitamin K absence or antagonism), which are the acarboxy forms of vitamin K-dependent factors. It thus gives a better assessment of the situation in vivo: in addition, data on the appropriate individual factor levels corresponding to a given INR are limited.2,3
Standardization of Oral Anticoagulant Treatment
Standardization of oral anticoagulant therapy comprises the following steps:
Reference thromboplastins (rabbit and bovine) are available as World Health Organization (WHO) Reference Preparations via the National Institute for Biological Standards and Control (NIBSC) (www.nibsc.ac.uk), the Institute for Reference Materials and Measurements (IRMM) (Irc-irmm-rm-sales@ec.europa.eu) or certified reference materials from commercial suppliers (see p. 588). All the reference preparations have been calibrated, now sometimes indirectly, against a primary WHO reference of human brain thromboplastin, which was established in 1967.4,5
The following terms are used in the calibration procedure described below:
Calibration of Thromboplastins
Principle
The test thromboplastin should be calibrated against a reference thromboplastin of the same species (rabbit versus rabbit, bovine versus bovine) although reference plasmas from different species must at some stage be compared with each other.3 All reference preparations are calibrated in terms of the primary material of human origin and have an ISI, which is assigned after a collaborative trial involving many laboratories from different countries.
Reagents
Method
Carry out PT tests as described on p. 409. Allow the plasma and thromboplastin to warm up to 37°C for at least 2 min before mixing or adding CaCl2. Test each plasma in duplicate with each of the two thromboplastins in the following order with minimum delay between tests.
| Reference Thromboplastin | Test Thromboplastin | |
|---|---|---|
| Plasma 1 | Test 1 | Test 2 |
| Test 4 | Test 3 | |
| Plasma 2 | Test 5 | Test 6 |
| Test 8 | Test 7, etc. |
Calibration
Plot the PTs on log-log graph paper, with results using the reference preparation (y) on the vertical axis and results with the test thromboplastin (x) on the horizontal axis (Fig. 20.1). On arithmetic paper, it is necessary to plot the logarithms of the PTs (Fig. 20.2). The relationship between the two thromboplastins is determined by the slope of the line (b).
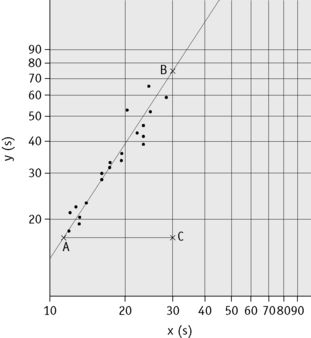
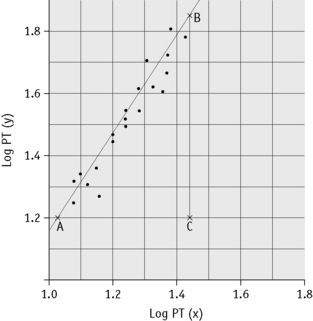
Figure 20.2 Calibration of thromboplastin. The PTs (in seconds) are converted to their logarithms, which are plotted on arithmetic graph paper. The slope is calculated as in Figure 20.1. In this example, A to C = 42 mm, B to C = 65 mm, b = 65/42 = 1.54. Therefore, ISI = 1.11 × 1.54 = 1.71.
An estimate of the slope can be obtained as shown in Figures 20.1 and 20.2; this can then be used to obtain an approximation of the ISI of the test thromboplastin.
Calculation of International Sensitivity Index
The following designations are then made:
x0 and y0 are the arithmetic means of the N values of xi and yi, respectively;
Q1 and Q2 are the sums of the squares of (xi–x0) and (yi–y0), respectively;
P is the sum of their products Σ(xi–x0)(yi–y0) E = (Q2–Q1)2 + 4P2
where b is the slope of the graph. The ISI of the preparation under test (ISIt) is then given by the following:

where IRP stands for International Reference Preparation.
Local Calibration of Thromboplastins
Although the ISI system has been very effective in standardizing anticoagulant control and improving agreement between laboratories, it is not perfect. One reason is that the ISI of a thromboplastin may vary according to the technique or coagulometer used and even with different models of the same instrument. To circumvent this, a system of local calibration has been suggested. In this system, a set of plasmas with an assigned INR are tested with the local thromboplastin–machine combination. These results are plotted on log-log paper against the assigned INR. The INR for subsequent patient samples can then be read off the graph using the locally measured PT.3,4 Thus, the PT is converted directly into an INR without the need for measurement of the ISI.
Calibration Audits
External quality-assurance surveys (e.g. UKNEQAS, see p. 594) will reflect differences regarding thromboplastin–machine combinations but not differences in blood sampling techniques (i.e. capillary and venous blood sampling). This can be a problem when capillary blood sampling is used in an outpatient setting, whereas venous samples are taken for inpatient anticoagulant monitoring. Regular audits comparing results from a range of patients whose blood has been sampled by both capillary and venous techniques will provide information not provided by NEQAS surveys.4,5
Determination of the International Normalized Ratio
Capillary Reagent
Reagents are commercially available for monitoring the INR using samples of capillary blood. These are usually a mixture of thromboplastin, calcium and adsorbed plasma so that when whole blood is added the reagent measures the overall clotting activity; it is sensitive to deficiency of factors II, VII and X. The reagents have an ISI assigned to them in the same way as individual thromboplastins and the INR is calculated from the PT ratio. These reagents are frequently used in anticoagulant clinics, when a large number of INRs need to be performed rapidly, and in point-of-care testing (see p. 471).
Therapeutic Range and Choice of Thromboplastin
Several authorities have now published recommended therapeutic ranges denoting the appropriate degree of anticoagulation in different clinical circumstances.7,8 These are largely based on controlled clinical trials but to some extent also represent a consensus on practice that has emerged over many years.
The choice of thromboplastin largely determines the accuracy with which anticoagulant control can be maintained. If the ISI of the thromboplastin is high, then a small change in PT represents a large change in the degree of anticoagulation. This affects the precision of the analysis and the coefficient of variation for the test increases with the ISI. Moreover, the target prothrombin ratio range becomes very small for any given range of INR. This is illustrated in Figure 20.3 and Table 20.1. For these reasons, it is strongly recommended that a thromboplastin with a low ISI (i.e. close to 1) is used.
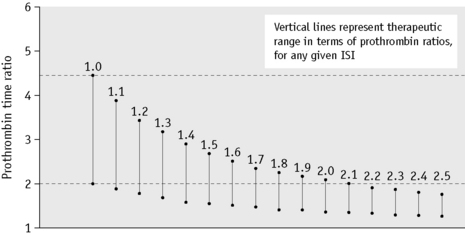
Table 20.1 Therapeutic ranges equivalent to an INR of 2.0–4.0 using different commercial thromboplastins
| Thromboplastin | ISI | Ratios equivalent to INR 2.0–4.0 |
|---|---|---|
| Thrombotest | 1.03 | 2.0–3.8 |
| Thromborel | 1.23 | 1.7–3.1 |
| Dade FS | 1.35 | 1.65–2.8 |
| Simplastin | 2.0 | 1.3–2.0 |
| Boehringer | 2.1 | 1.35–1.9 |
| Ortho | 2.3 | 1.3–1.8 |
ISI, International Sensitivity Index; INR, International Normalized Ratio.
(Modified from Poller L 1987 Oral anticoagulant therapy. In: Bloom AL, Thomas DP (eds) Haemostasis and Thrombosis, p. 870, 2nd edition. Churchill Livingstone, Edinburgh.)
Management of Overanticoagulation
The approach to management of a patient whose INR exceeds the therapeutic range with or without bleeding is shown in Table 20.2.7
Table 20.2 Recommendations for management of bleeding and excessive anticoagulation7
| 3.0<INR<6.0 (target INR 2.5) | 1. Reduce warfarin dose or stop |
| 4.0<INR<6.0 (target INR 3.5) | 2. Restart warfarin when INR <5.0 |
| 6.0<INR<8.0 No bleeding or minor bleeding |
1. Stop warfarin 2. Restart when INR <5.0 |
| INR <8.0 No bleeding or minor bleeding |
1. Stop warfarin 2. Restart warfarin when INR <5.0 3. If other risk factors for bleeding give 0.5–2.5 mg of vitamin K (oral or i.v.) |
| Major bleeding | 1. Stop warfarin 2. Give PCC 30–50 u/kg or FFP 15 ml/kg if PCC not available 3. Give 5 mg of vitamin K (i.v.) |
FFP, fresh-frozen plasma; INR, International Normalized Ratio; PCC, prothrombin complex concentrate.
Point-of-Care Testing
There are now schemes for monitoring INR at point of care outside the hospital clinic. These require selection and standardization of appropriate analysers and a quality-control programme that includes participation in an external quality assessment scheme. It is essential to have liaison with the local laboratory for training of staff and supervision of the quality-control programme. There should be an established procedure for checking any problems of instrument performance and for referring to the specialist centre patients who are difficult to control.9,10
Self-management of warfarin treatment akin to home glucose monitoring may also be an effective point-of-care procedure for selected patients. They should first attend two or more training sessions on the use and quality control of the appropriate analyser, interpretation of INR, adjustment of warfarin dosage and guidance on when it is necessary to be seen at the specialist clinic.10
Heparin treatment
Hence, low molecular weight heparins (LMWHs), which have an average molecular mass of 5000 Da, have a ratio of anti-Xa to antithrombin effect of 2–5 compared with that of unfractionated heparin (UFH), which is defined as having a ratio of 1. However, all heparin preparations are heterogeneous mixtures of molecules with different molecular weight and many do not contain the crucial pentasaccharide sequence. Heparin also produces some anticoagulant effect by promoting the release of tissue factor pathway inhibitor (TFPI) from the endothelium (see p. 399).
Selection of Patients
It is advisable to perform the first-line tests of haemostasis (as described in Chapter 18) before starting treatment. In the presence of a reduced platelet count or deranged coagulation, heparin may be contraindicated or, if used, the dose must be reduced.
Laboratory Control of Heparin Treatment
The pharmacokinetics of heparins are extremely complicated, partly because of the variation in molecule size.11,12 Large molecules are cleared by a rapid saturable cellular mechanism and bind to numerous acute-phase proteins such as von Willebrand factor and fibronectin. Smaller molecules are cleared by a non-saturable renal route and bind less to plasma proteins. As a result, therapeutic doses of UFH result in a variable degree of anticoagulation and require close monitoring (Table 20.3). The dose–response relationship is much more predictable for the LMWHs and most trials have not monitored therapy with these agents, which are simply given on a ‘units per kg’ dosing regimen. Thus the approach to monitoring heparin therapy varies according to the type of heparin used and the clinical circumstance.
Table 20.3 Tests used in the laboratory control of heparin treatment
| Test | Advantages | Disadvantages |
|---|---|---|
| Whole-blood clotting time | Simple, inexpensive, no equipment needed | Time consuming, can only be carried out at the bedside, one at a time, insensitive to <0.4 iu/ml anti-Xa and to LMW heparins |
| APTT | Simple, many tests can be carried out in parallel | Not all reagents sensitive to heparin, insensitive to <0.2 iu/ml anti-Xa and to LMW heparins, affected by variables other than heparin |
| TT | Simple, many tests can be carried out in parallel | Insensitive to <0.2 iu/ml and to LMW heparins. Steep dose–response |
| Protamine neutralization | Sensitive to all concentrations | Time consuming and insensitive to LMW heparins |
| Anti-Xa assays | Sensitive to all concentrations and to LMW heparins | Expensive if commercial kits used; time consuming if home-made reagents used. Not clear that anti-Xa is the clinically relevant measure |
APTT, activated partial thromboplastin time; LMW, low molecular weight; TT, thrombin time.
LMWHs have relatively little effect on the APTT and if monitoring is required, a specific heparin assay must be used. The result will then be reported as heparin activity in u/ml. In general, unless stated otherwise, this is measured as anti-Xa activity. International standards for UFH13 and for LMWH are now available and the assay results reported in iu/ml.14
Activated Partial Thromboplastin Time for Heparin Monitoring
Principle
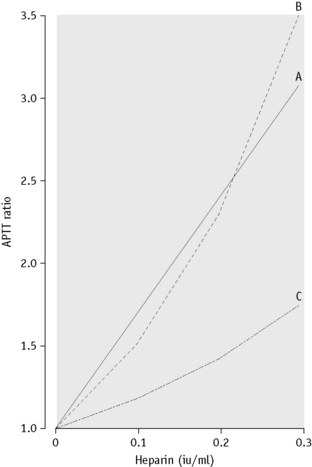
The APTT is the most widely used test for monitoring unfractionated heparin therapy. It is very sensitive to heparin but has a number of shortcomings that must be kept in mind. First, different APTT reagents have different sensitivities to heparin. It is important to establish that the reagent in use has a linear relationship between clotting times and heparin concentration in the therapeutic range (0.35–0.7 anti-Xa iu/ml). An example of different responses is shown in Figure 20.4. The result is expressed as a ratio of the time obtained with that for the normal pool containing no heparin (often called ‘the heparin ratio’).
Near-Patient Heparin Monitoring
The whole-blood activated clotting time (ACT) is routinely used to assess heparin effects during cardiac surgery. However, the ACT is not a specific assay for heparin and may be influenced by several other factors such as hypothermia, haemodilution and platelet dysfunction. For these reasons the ACT may be misleading with regard to the proper administration of heparin and protamine.15
Anti-Xa Assay for Heparin
Principle
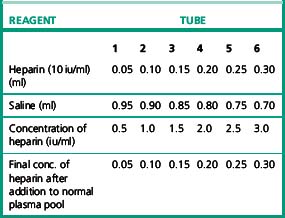
Plasma anti-Xa activity as a result of antithrombin is enhanced by the addition of heparin and either a coagulation or amidolytic (chromogenic) assay of anti-Xa activity can be adapted to measure this effect. A standard curve is constructed by adding varying amounts of heparin to a normal plasma pool, which provides the source of the antithrombin. A known amount of Xa is added and, after incubation, the amount of Xa remaining is assayed by chromogenic or coagulation-based assay. A number of commercial kits based on clotting or chromogenic substrate methods are in use but although they give linear and reproducible responses, studies have shown considerable variation between kits.16 A standard curve should be constructed that is appropriate for the level of heparin expected. Some but not all assays add an exogenous source of antithrombin to the test sample, but it is not clear how important this is in patients with low antithrombin levels.
Reagents
Protamine Neutralization Test
Reagents
Heparin-Induced Thrombocytopenia
Most patients receiving unfractionated heparin experience a small and immediate drop in their platelet count. In the past this has been referred to as type 1 heparin-induced thrombocytopenia (HIT) and is completely harmless. It is thought to arise as a result of heparin binding to platelets. The term HIT is now used more generally to describe a second more serious thrombocytopenia (type II HIT) seen in approximately 5% of patients receiving UFH and which is a result of development of antibodies against heparin-platelet factor 4 (PF4) complexes. The antigen–antibody complexes bind to and activate platelets via the FCRγII, resulting in accelerated clearance. Type II HIT develops 5–12 days after starting heparin therapy and causes a profound decrease in platelets to <50% of preheparin value and usually <50 × 109/l. The process of activation sometimes results in arterial, or more frequently venous, platelet thrombus formation particularly in patients who are ill or septic and skin necrosis has also been reported. This syndrome of heparin-induced thrombocytopenia and thrombosis (HITT) has a high mortality. Heparin must be stopped immediately and alternative immediate-acting anticoagulation must be instituted.17
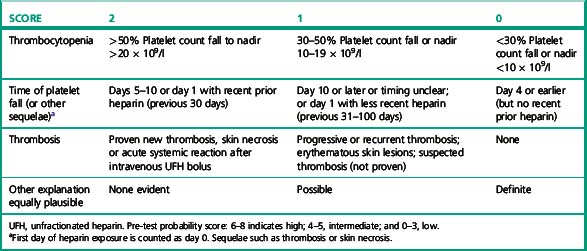
The diagnosis of HIT is primarily clinical and there is no test that can be performed with sufficient speed, sensitivity and specificity to positively guide the primary decision to stop heparin. The decision to perform laboratory tests and the interpretation of the results should always be performed after consideration of the clinical likelihood or pre-test probability.18 A simple scoring scheme (the 4 Ts system) has been devised and tested for this purpose (Table 20.5).19
However, antibody tests do have sufficient sensitivity to reliably exclude the diagnosis while lacking the specificity to positively identify it. Thus confirmatory information is useful and a number of tests can be performed to substantiate the diagnosis.20,21 These may be either functional tests in which platelet activation is detected or immunological tests in which the presence of PF4–heparin-dependent antibodies are detected. Examples of the former include what is regarded as the ‘gold standard’ test, the serotonin release assay,22 but this is too cumbersome and inconvenient for routine use. Alternatives are heparin-induced platelet aggregation and flow cytometry-based tests.23 The simplest for routine use is a modified platelet aggregation test as described in the following section.24 Although the immunological tests appear to have greater sensitivity and are more easily reproducible, they do not demonstrate the functional significance of the antibodies.
Reagents
Method
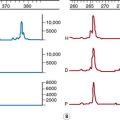
Following the scheme shown in Table 20.6, four aggregation cuvettes are set up. Add 300 μl of normal PRP to each cuvette. Then add 200 μl of the appropriate patient or control PPP, along with a magnetic stir bar. Set the 100% baselines with the normal control PPP and the 0% baselines with PRP and PPP. Set the stir rate at 1200 rpm. Observe the baselines for 1 min. Initiate aggregation by the addition of 50 μl of either heparin or saline. Observe aggregation for a minimum of 15 min (Fig. 20.5).
Table 20.6 The combinations of platelets, plasma and heparin required to test for heparin-induced thrombocytopenia
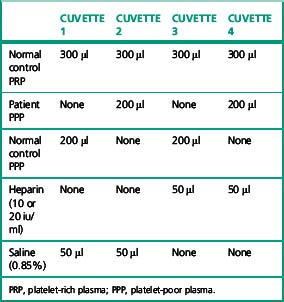
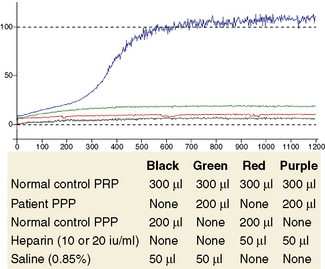
Figure 20.5 The combinations of platelets, plasma and heparin required to test for heparin-induced thrombocytopenia shown in Table 20.6. The aggregation traces show that platelet aggregation occurs only when the patient plasma is exposed to heparin (purple trace).
With experience, subjective assessment of aggregation responses is usually sufficient for clinical interpretation. A positive test result is shown in Figure 20.5. The total amount of aggregation seen may be reported.
Interpretation
See platelet aggregation (see p. 432).
Reported studies using platelet aggregation tests indicate they have a high specificity for HIT that is >90%. However, the sensitivity of the test is more variable and, although >80% on some occasions,24 it is frequently much nearer 50–60% and therefore cannot reliably exclude HIT. The literature suggests that test sensitivity can be improved by the use of the patient’s own platelets, platelets from selected donors known to be reactive in the assay or washed platelets.25 The reactivity of the donor platelets can be established by using a known positive serum. Test specificity is enhanced by including neutralization of the reaction by a high dose of heparin but this is not always observed.
Immunological Tests for Heparin–PF4 Antibodies
Several commercial kits are available for detection of antibodies directed against the heparin–platelet factor 4 complex. These include enzyme immunoassays; ‘PF4 enhanced’ (GTI Diagnostics, Waukesha, WI, USA) and ‘Zymutest HIA IgG’ (Hyphen BioMed, Neuville-Sur-Oise, France), an immunofiltration kit (Akers Biosciences, Inc, Thorofare, NJ, USA) and a particle gel immunoassay which is described below. The first two of these have reported high sensitivity (>90%) for the presence of antibodies and although they lack specificity, have reasonable utility. The test performance can be improved by using the optical density (OD) to assign a probability of a true positive result.26 The immunofiltration assay did not perform so well in one study27 but subsequent reports were more encouraging.28 These tests are performed according to the manufacturers’ instructions.
Diamed Heparin–PF4 Antibody Test
The Diamed Heparin–PF4 antibody test28 is a particle gel immunoassay consisting of red-coloured polymer particles coated with heparin–PF4 complex. When the patient’s serum is mixed with the polymer particles, specific antibodies react with the heparin–PF4 complex on the particle surface, resulting in particle agglutination. The particles are centrifuged through a gel filtration matrix, agglutinated particles are trapped on top of the gel or within the gel and non-agglutinated particles form a button at the bottom of the tube. The result can be read visually.
Hirudin
Ecarin Clotting Time
Ecarin29 is a snake venom (Echis carinatus) that directly activates prothrombin to meizothrombin. This action is not dependent on phospholipid membranes and so is not impaired by the presence of lupus anticoagulant or by inadequate prothrombin carboxylation due to warfarin therapy. The activity of meizothrombin is not inhibited by heparin-antithrombin and can be detected by a clotting or chromogenic assay.
Oral anti-IIa and anti-Xa agents
A number of orally active direct inhibitors of IIa and Xa are entering clinical use. The implications for laboratory practice are unclear because clinical trials have been carried out without monitoring of anticoagulant effect. However, it is likely that some measurement, or at least detection, of their effect will be required in some circumstances such as bleeding or renal failure. Anti-Xa activity can be measured as described for heparin but anti-IIa activity appears to be best measured using the ecarin clotting time (ECT). This test has previously been employed to measure high levels of hirudin because the ECT has a linear relationship with hirudin concentration over a greater range than the APTT.30
Thrombolytic therapy
Laboratory Control of Thrombolytic Therapy
Many laboratory tests are abnormal during thrombolytic therapy,31 but a perfect and specific procedure for monitoring is not available. In practice, thrombolytic therapy is given rapidly according to protocol, with no time or need for adjustment of dosage. During thrombolytic therapy all screening tests of coagulation are prolonged, reflecting the hyperplasminaemic state with the reduction in the fibrinogen concentration and the presence of FDP. The prolongation is most marked with streptokinase and streptokinase–plasminogen complex; it is less marked with urokinase and least with tPA. The fibrinogen concentration commonly decreases to below 0.05 g/l and the FDP concentration may increase to more than 1000 ng/l.
Plasma Fibrinogen
Depending on duration of therapy and the specific plasminogen activator used, there is a variable decrease in fibrinogen. The fibrinogen should be measured by a method dependent on clottable fibrinogen (e.g. Clauss technique, see p. 412). The PT-derived fibrinogen is likely to be unreliable. Fibrin(ogen) degradation products will be elevated, but this is unlikely to be helpful.
Antiplatelet therapy
Interest has been revived in the observation that some patients do not respond to aspirin. ‘Aspirin resistance’ is poorly defined and sometimes apparent resistance may be merely the result of a failure to take the medication. Otherwise this term may refer either to a failure to inhibit platelet function or a failure to suppress thromboxane A2 production. The first may be detected by platelet function analysers such as the PFA-100 (see p. 425) or by platelet aggregation responses; the second may be detected by serum thromboxane B2 levels or the metabolite 11-dehydro TXB2 in the urine. A similar ‘resistance’ has been identified in patients taking clopidogrel, which blocks the platelet P2Y12 receptor. The effect of clopidogrel can be detected by demonstrating a reduced response to ADP in a modification of the standard platelet light transmission aggregometry (see p. 432). In addition a number of commercial assays are available to monitor antiplatelet therapy or to detect resistance. The PFA-100 is sensitive to aspirin but not clopidogrel effect. Monitoring antiplatelet therapy has not reached routine hospital practice: first, because the clinical utility of these assessments and the appropriate responses are not established;32,33 and second, because a series of new antiplatelet agents with more reliable dose–response characteristics have been introduced.
1 Ansell J., Hirsh J., Hylek E., et al. Pharmacology and management of the vitamin K antagonists: American College of Chest Physicians Evidence-based Clinical Practice Guidelines, 8th edition. Chest. 2008;133(supp 6):160S-198S.
2 Costa I.M., Serralheiro A.I., Rodrigues M., et al. Usefulness of factor II and factor X as therapeutic markers in patients under chronic warfarin therapy. Biomed Pharmacother. 2010;64(2):130-132.
3 Lind S.E., Callas P.W., Golden E.A., et al. Plasma levels of factors II, VII and X and their relationship to the international normalized ratio during chronic warfarin therapy. Blood Coagul Fibrinolysis. 1997;8(1):48-53.
4 World Health Organization. Guidelines for thromboplastins and plasma used to control oral anticoagulant therapy. World Health Organ Tech Rep Ser. 1999;889:64-93.
5 Chantarangkul V., van den Besselaar A.M., Witteveen E., et al. International collaborative study for the calibration of a proposed international standard for thromboplastin, rabbit, plain. J Thromb Haemost. 2006;4(6):1339-1345.
6 WHO. Guidelines for thromboplastins and plasma used to control oral anticoagulant therapy. World Health Organ Tech Rep Ser. 889, 1999. Annex 3
7 Baglin T.P., Keeling D.M., Watson H.G., British Committee for Standards in Haematoogy. Guidelines on oral anticoagulation (warfarin), 3rd edition – 2005 update. Br J Haematol. 2006;132(3):277-285.
8 Hirsh J., Guyatt G., Albers G.W., et al. Executive summary: American College of Chest Physicians Evidence-based Clinical Practice Guidelines, 8th edition. Chest. 2008;133(supp 6):71S-109S. [Erratum in Chest 2008; 134(4):892]
9 ISO. Clinical laboratory testing and in vitro medical devices – requirements for in vitro monitoring systems for self testing of oral anticoagulant therapy. BS ISO. 2007:17953.
10 Briggs C., Guthrie D., Hyde K., et al. Guidelines for point-of-care testing: haematology. Br J Haematol. 2008;142(6):904-915.
11 Hirsh J., Bauer K.A., Donati M.B., et al. Parenteral anticoagulants: American College of Chest Physicians Evidence-Based Clinical Practice Guidelines, 8th edition. Chest. 2008;133(supp 6):141S-159S. [Erratum in Chest 2008; 134(2):473]
12 Baglin T., Barrowcliffe T.W., Cohen A., et al. Guidelines on the use and monitoring of heparin. Br J Haematol. 2006;133(1):19-34.
13 Gray E., Walker A.D., Mulloy B., et al. A collaborative study to establish the 5th International Standard for Unfractionated Heparin. Thromb Haemost. 2000;84(6):1017-1022.
14 Gray E., Heath A.B., Mulloy B., et al. A collaborative study of proposed European Pharmacopoeia reference preparations of low molecular mass heparin. Thromb Haemost. 1995;74(3):893-899.
15 Popma J.J., Prpic R., Lansky A.J., et al. Heparin dosing in patients undergoing coronary intervention. Am J Cardiol. 1998;82(8b):19-24.
16 Kitchen S., Iampietro R., Woolley A.M., et al. Anti Xa monitoring during treatment with low molecular weight heparin or danaparoid: inter-assay variability. Thromb Haemost. 1999;82(4):1289-1293.
17 Keeling D., Davidson S., Watson H., et al. The management of heparin-induced thrombocytopenia. Br J Haematol. 2006;133(3):259-269. [Erratum in Br J Haematol 2006;134(3):351]
18 Warkentin T.E. New approaches to the diagnosis of heparin-induced thrombocytopenia. Chest. 2005;127(supp 2):35S-45S.
19 Warkentin T.E., Heddle N.M. Laboratory diagnosis of immune heparin-induced thrombocytopenia. Curr Hematol Rep. 2003;2(2):148-157.
20 Greinacher A., Warkentin T.E. Recognition, treatment and prevention of heparin-induced thrombocytopenia: review and update. Thromb Res. 2006;118(2):165-176.
21 Warkentin T.E., Greinacher A., Koster A., et al. Treatment and prevention of heparin-induced thrombocytopenia: American College of Chest Physicians Evidence-based Clinical Practice Guidelines, 8th edition. Chest. 2008;133(supp 6):340S-380S.
22 Sheridan D., Carter C., Kelton J.G. A diagnostic test for heparin-induced thrombocytopenia. Blood. 1986;67(1):27-30.
23 Amiral J., Meyer D. Heparin-induced thrombocytopenia: diagnostic tests and biological mechanisms. Bailliéres Clin Haematol. 1998;11(2):447-460.
24 Chong B.H., Burgess J., Ismail F. The clinical usefulness of the platelet aggregation test for the diagnosis of heparin-induced thrombocytopenia. Thromb Haemost. 1993;69(4):344-350.
25 Griffiths E., Dzik W.H. Assays for heparin-induced thrombocytopenia. Transfus Med. 1997;7(1):1-11.
26 Warkentin T.E., Sheppard J.I., Moore J.C., et al. Quantitative interpretation of optical density measurements using PF4-dependent enzyme-immunoassays. J Thromb Haemost. 2008;6(8):1304-1312.
27 Warkentin T.E., Sheppard J.I., Raschke R. Performance characteristics of a rapid assay for anti-PF4/heparin antibodies: the particle immunofiltration assay. J Thromb Haemost. 2007;5(11):2308-2310.
28 Bryant A., Low J., Austin S., et al. Timely diagnosis and management of heparin-induced thrombocytopenia in a frequent request, low incidence single centre using clinical 4T’s score and particle gel immunoassay. Br J Haematol. 2008;143(5):721-726.
29 Potzsch B., Hund S., Madlener K., et al. Monitoring of recombinant hirudin: assessment of a plasma-based ecarin clotting time assay. Thromb Res. 1997;86(5):373-383.
30 Nowak G. The ecarin clotting time, a universal method to quantify direct thrombin inhibitors. Pathophysiol Haemost Thromb. 2003;33(4):173-183.
31 Ludlam C.A., Bennett B., Fox K.A., et al. Guidelines for the use of thrombolytic therapy. Haemostasis and Thrombosis Task Force of the British Committee for Standards in Haematology. Blood Coagul Fibrinolysis. 1995;6(3):273-285.
32 Patrono C. Aspirin resistance: definition, mechanisms and clinical read-outs [see Comment]. J Thromb Haemost. 2003;1(8):1710-1713.
33 Harrison P., Frelinger A.L.3rd, Furman M.I., et al. Measuring antiplatelet drug effects in the laboratory. Thromb Res. 2007;120(3):323-336.