10 Kinematics of the Aging Spine: A Review of Past Knowledge and Survey of Recent Developments, with a Focus on Patient-Management Implications for the Clinical Practitioner
KEY POINTS
The Current State of the Art: Diagnostic Efficacy of Today’s Functional Testing Method
The current clinical standard of care for performing functional testing of the spine was introduced in the 1940s1 and has since been the subject of scores of published investigations. Today’s method is beset by multiple performance problems2,3 and, although many practitioners are unaware of the fact, has been proven useless in differentiating normal from abnormal spinal function.4–7 In holding true to the tenets of evidence-based medicine it is critical that, as a starting point, practitioners understand the limitations of this method so testing results are interpreted appropriately.
Range of Motion (RoM) Measurements
Today’s method for conducting functional testing of the spine (flexion/extension and lateral bending radiographs, which are referred to in this text as the clinical standard of care) involves capturing standard radiographs of the spine as subjects bend, and then hold their spines fixed in the extremes of motion in either the sagittal (in the case of flexion/extension) or coronal (in the case of lateral bending) planes. These studies are separate to, but often used as an adjunct with, other medical imaging studies such as plain radiographs or CT scans in the diagnostic assessment of a patient’s spine. When performing these motions, each subject bends in each direction to his or her own maximum voluntary bending angle (MVBA).
These two images taken at the extremes of trunk bending within a single plane are then interpreted — either manually using a pen, ruler, and protractor or more recently, with the advent of digital imaging, an imaging workstation — to derive range of motion (RoM) measurements. RoM measurements represent the total displacement between any two vertebrae during MVBA bending, and are expressed as both angulations, as measured in degrees and referred to in this text as the intervertebral angle (IVA) in either the coronal or sagittal plane, and translations in the sagittal plane, measured in millimeters and referred to in this text as the intervertebral translation (IVT). See Figure 10-1 for a simplified diagram showing how IVA and IVT are derived from radiographic images.
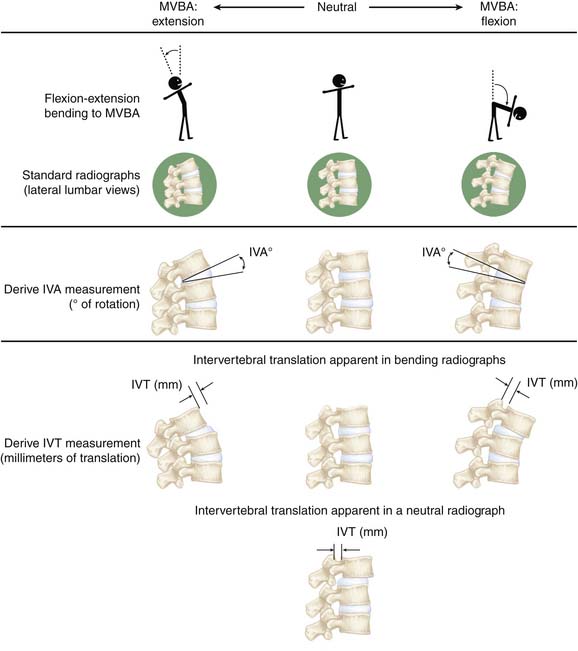
RoM is defined by the rotation of the body (IVA) and the translation of a point on the body (IVT). While the rotation is unambiguous, the translation is not. The translation is different for different points of the vertebral body and, additionally, it is subject to magnification and distortion on radiographs. This ambiguity has led to: (1) the introduction of multiple techniques for selecting points on the vertebral body and measuring IVT;2,4,8,21,22 (2) attempts to define standardized displacement thresholds for what constitutes translational instability;9 and (3) the proposal of multiple systems for scoring and classifying translational instabilities (there have been the Myerding scale,10 the Newman Scale,11 and the modified Newman scale12 for scoring translational instabilities, as well as the Wiltse13 system for classifying them).
Grade 4 is 75% to 100%; over 100% is spondyloptosis, when the vertebra completely falls off the supporting vertebra. One key advantage of the Myerding system is that it is a relative grading system, meaning that it helps to control for distortion and magnification errors that can be associated with absolute measurements of displacement (millimeters) derived from radiographic images.
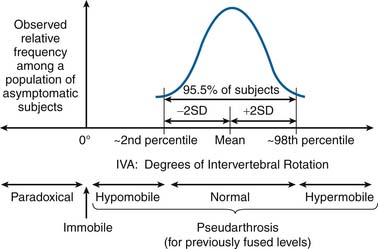
IVA is used clinically to assess intervertebral articulation in either the sagittal or coronal planes, and as such should theoretically be capable of detecting six specific types of intervertebral functional presentations (see Figure 10-2):
Measurement Variability in Range of Motion (RoM) Measurements
As with any quantitative diagnostic measurement parameter, measurement variability is the key driver of diagnostic efficacy in the application of such measurements to differentiate between the various types of patient presentations. Simply stated, measurement variability is the enemy of effective diagnosis: the higher the measurement variability, the less effective the resulting diagnosis. In the case of RoM measurements, it has been shown that measurement variability is high2,3 and diagnostic efficacy is low.4–7 The causes and effects of this measurement variability are well understood; however, the implications for the clinical practitioner have rarely been discussed in the published literature. Therefore one of the main goals of this section is to present a data-driven analysis of RoM measurement variability and how this variability should be taken into account in the interpretation of functional testing results used in the diagnosis of spine disease and management of the aging spine.
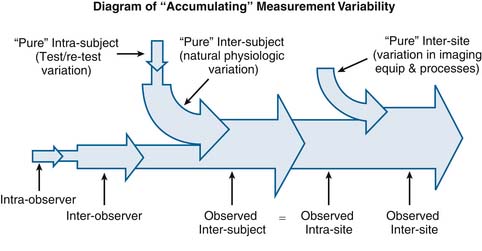
This concept of “accumulation” of variability also applies to the overall relationship between observer-related variability (interobserver and intraobserver variability) and subject-related variability (intersubject and intrasubject variability). Subject-related variation in intervertebral motion exists as an inherent property of the physiology of the spine. In other words, there is a certain amount of variation that is inherent to the way the spines of different people move, or in the way a given person’s spine moves at different points in time. For this discussion, we will refer to this inherent variation as the “pure” intrasubject and intersubject variability. However it is impossible to measure this “pure” intrasubject and intersubject variability without constructing an observational system to take measurements, and any observational system constructed to take measurements is also subject to both intraobserver and interobserver variability. Therefore any measurement of intersubject variability, for this discussion called “observed intersubject variability,” necessarily “accumulates” the combined effects of both observer-related variability and subject-related variability.
See Figure 10-3 for a simplified conceptual diagram of how selected types of RoM measurement variability interrelate through the accumulation of measurement variability.
Using Normative IVA Data to Detect Normal Motion, Hypomobility, and Hypermobility
As previously discussed, it is theoretically possible to use normative IVA data from a population of asymptomatic subjects to differentiate normal from hypomobile and hypermobile intervertebral motion (see Figure 10-2). However, with the current standard of care for conducting spinal functional testing, only hypermobility and pseudarthrosis can be detected with an acceptable level of statistical confidence. This fact, although not widely discussed, has very significant implications in terms of patient management, which are discussed later in this section. However as a starting point to this discussion, it is necessary to first re-examine the conventional wisdom regarding what is currently considered “normal healthy” intervertebral rotation.
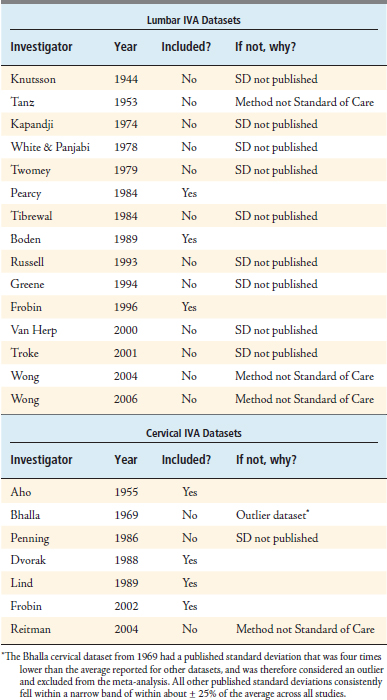
In conducting this meta-analysis, a total of 22 published IVA datasets were identified (15 lumbar and 7 cervical). Each dataset was carefully examined and screened to ensure that: (1) the method for measuring IVA was consistent with the current clinical standard of care, and (2) the variability (standard deviation, or SD) among observed IVA values was published along with the mean. After applying this screen, three lumbar datasets and four cervical datasets qualified for this meta-analysis. See Table 10-1 for a list of all 22 datasets that were considered.
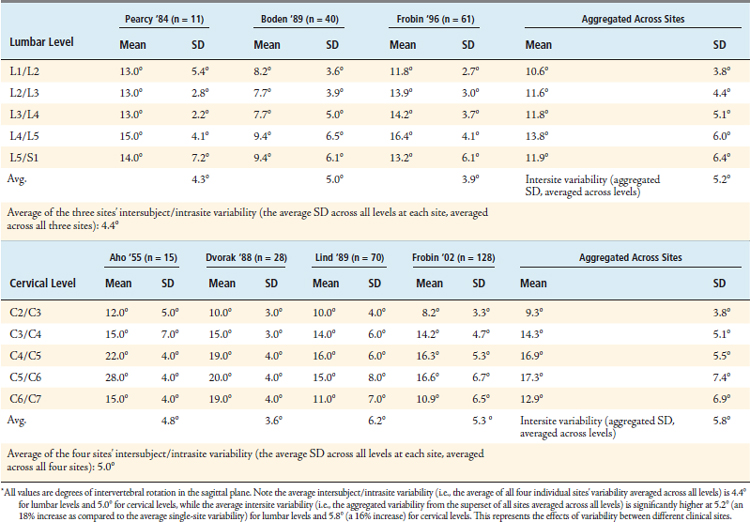
After including all qualifying datasets, the following values were tabulated for the mean and standard deviation of observed IVA values taken from multiple populations of asymptomatic subjects across multiple sites (Table 10-2). The standard deviation values in the “Aggregated Across Sites” column at the far right of each table represent the standard deviation of the superset created by combining the observed values from all sites, and represents the observed intersite variability associated with the current standard of care for measuring IVA at each level, while the standard deviation values for each investigator represent that investigator’s site’s observed intersubject/intrasite variability.
TABLE 10-2 Normative IVA Data That Account for the Effects of Intersite Variability, Thereby Allowing for a More Representative Account of Mean IVA Values Than Has Ever Been Published in Any Single-Site Study
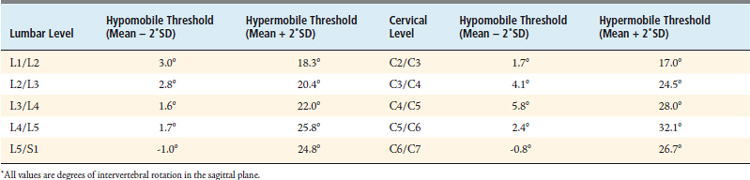
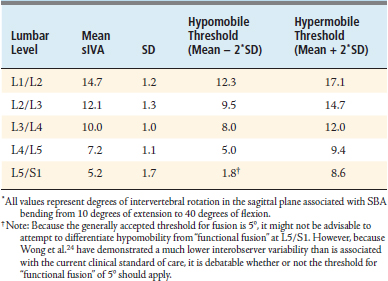
Using these normative values that account for the effects of intersite variability, it is possible to produce threshold IVA values that represent hypomobility and hypermobility, as given in Table 10-3.
Effects of IVA Measurement Variability on the Diagnostic Efficacy of Functional Testing of the Spine
To quantitatively assess the diagnostic efficacy of using IVA to detect different functional presentation (hypomobility, hypermobility, normal motion, etc.), it would be necessary to have a gold standard method for identifying true positives and true negatives for each type of functional presentation. If such a gold standard method existed, it would then be possible to quantitatively assess diagnostic efficacy with the traditional diagnostic efficacy parameters of sensitivity (Sn), Specificity (Sp), and the positive/negative likelihood ratios (+LR and −LR). however, the authors are unaware of that any such gold standard exists∗ and it is therefore impossible to measure these traditionally used diagnostic efficacy parameters. Therefore in this discussion of diagnostic efficacy associated with IVA measurements, these efficacy parameters will be described qualitatively in lieu of being able to quantitatively measure them.
As reflected in the hypomobility and hypermobility thresholds given in Table 10-3, the current standard of care for measuring IVA involves a high degree of measurement variability. This high degree of measurement variability, in turn, has disastrous consequences on the diagnostic efficacy of using IVA to detect intervertebral motion dysfunction. The first problem lies with the very low thresholds for detecting intervertebral hypomobility. Vertebral levels with IVA measurements of less than 2° to 5° are generally considered to be fused.14,15 As previously discussed, the FDA considers any IVA of up to 5° as effectively immobile for the purpose of evaluating arthrodesis status following a fusion. Therefore, because the hypomobility thresholds are all below the FDA’s 5° threshold for what is considered a fused FSU (except at C4/C5; Table 10-3), it is impossible to use IVA to differentiate hypomobile motion from a fusion, effectively rendering hypomobility an undetectable condition. A second consequence of this overlap between what is considered normal and hypomobile motion with what is considered a fused FSU is that one is guaranteed reduced specificity in detecting immobility as well as reduced sensitivity in detecting normal motion (because a “true normal” with an observed IVA of less than 5° is both a false negative in the detection of normal motion as well as a false positive in the detection of immobility).
The second problem lies with the thresholds for detecting both intervertebral hypermobility and hypomobility. The thresholds for hypermobility are so high because IVA measurement variability is so large. Having such a high threshold for hypermobility (the average threshold for lumbar levels is 22° and for cervical levels is 26°, from Table 10-3) ensures that only the grossest of rotational hypermobilities will register as being definitively hypermobile; thus subtle hypermobilities remain undetected and register as “normal.” Similarly, with hypomobility, high IVA variability makes the hypomobility thresholds so low that only the grossest of hypomobilities could register as being definitively hypomobile. As a consequence, the sensitivity of using IVA to detect hyper/hypomobility as well as the specificity of using IVA to detect normal motion are both reduced (those patients who register as normal but who have a subtle hyper/hypomobility are a false positive in the detection of normal motion as well as a false negative in the detection of hyper/hypomobility).
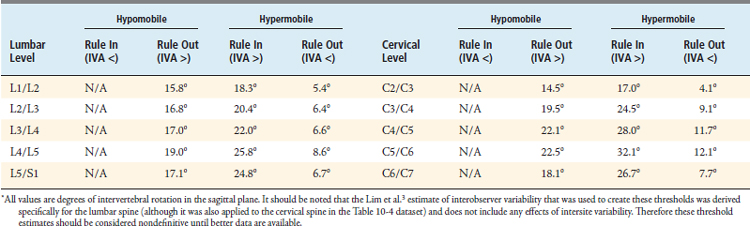
A third problem arises when one tries to use IVA to rule out hypomobility or hypermobility. It is theoretically possible to rule out hypomobility if observed IVA is sufficiently high. For example, if IVA is confirmed to be above the mean for any level, then it would be possible to rule out hypomobility (even the subtle hypomobilities described in the previous paragraph). It is similarly possible to rule out hypermobility if observed IVA is sufficiently low. However, one must consider the effects of interobserver variability in IVA measurements to be sure that a measurement is above or below the mean in producing threshold values to rule out hypomobility and hypermobility. In quantifying the interobserver variability at one investigational site, Lim et al.3 reported that the 95% confidence interval for the interobserver variability in lumbar IVA measurements is ±5.2°. However, as this study took place at only one site, it almost certainly underestimates the actual interobserver variability that exists across different clinical sites. Nonetheless, if one uses the Lim estimate and assumes that an IVA measurement must be 5.2 ° above/below the mean to be 95% confident that the observed IVA is actually above/below the mean, and if one further assumes that any IVA measurement above/below the mean rules out hypo/hyper-mobility, then one can produce the “rule-out” thresholds for hypomobility and hypermobility given in Table 10-4. However, there are some limitations associated with the data used to create these threshold values (as described in the caption for Table 10-4), so therefore they should be considered nondefinitive until these limitations are addressed and new thresholds can be produced.
Conclusions: Implications for the Practitioner Regarding the Clinical Application of RoM Measurements
Technological Advances that Improve the Diagnostic Efficacy of Spinal Functional Testing
As stated throughout this text, the current standard of care for measuring IVA includes a high degree of both observer-related and subject-related variability. Technological developments in recent years have been effective at reducing both of these types of variability, and are discussed in this section. However, this section only includes those methods which could feasibly be adopted by the clinical practitioner and thus it does not discuss techniques which are purely investigational or are otherwise infeasible for immediate adoption (such as Roentgen Stereophotogrammatric Analysis,19 external skin-marker−based motion measurement techniques,20 as well as a variety of in vitro measurement methods).
Reducing IVA Observer-Related Variability by Improving the Reliability of Image Analysis Techniques
With respect to observer-related variability, previous studies have confirmed widely variable IVA results from measurements of the same images taken by different observers. Lim et al. demonstrated that a difference of 9.6 degrees must exist between the IVA measurements from two observations in order to be 95% confident that there really is a difference in IVA.3 This high degree of interobserver variability is a major contributor to overall observed measurement variability. However, recent advances have successfully reduced this interobserver variability through several novel techniques.
There have been improvements over the years with respect to the methods for landmarking the radiographic images and deriving IVA and IVT measurements from these images. Variability in IVA and IVT measurements can be introduced through distortion errors inherent to all radiographic images. Further, if patients move out of plane or have any significant axial rotation in their spines during imaging, the resulting IVA and IVT measurements can become more variable. A group led by W. Frobin found that interobserver variability in IVA and IVT measurements could be reduced simply by using a more sophisticated method of landmarking radiographic images.21,22 This technique was found to significantly reduce the variability in IVA and IVT measurements associated with radiographic image distortion and with out-of-plane positioning of the subject during imaging.
There have been multiple groups who have successfully developed software-based image analysis tools that have been shown to reduce this interobserver variability. For example, one of the authors of this chapter, Kris Wong, recently developed a software algorithm for automatically deriving IVA measurements from bending images. Wong et al. published two datasets of normative values, one dataset that was derived manually,23 and a second dataset that was derived using automated software image processing algorithms.24 Both datasets were measured from active flexion-extension bending of the lumbar spine. The average standard deviation across the lumbar levels measured in this study (a measurement of the observed intersubject/intrasite variability) decreased over 50%, from 2.8° to 1.3°, as a result of using automated software-driven image analysis versus manual image analysis. Other groups have been able to demonstrate similar results using commercially available image analysis software. Using an automated image analysis software program operated as a core lab service (QMA software operated by Medical Medtrics, Inc., Houston, Texas) instead of a manual image analysis process, Reitman et al. published a cervical IVA dataset25 of 155 asymptomatic subjects and Hipp & Wharton published a lumbar IVA dataset26 of 67 asymptomatic subjects. The Reitman study reported an average standard deviation across cervical levels of 4.0°, while the Hipp & Wharton study published an average standard deviation across all lumbar levels of 3.6. While these are the lowest published standard deviation among different cervical or lumbar IVA datasets, these do represent a 20% (cervical) and 18% (lumbar) reduction relative to the average value for intersubject/intrasite variability (i.e., the average of all individual sites’ average standard deviation) from the datasets listed in Table 10-2 (5.0° cervical and 4.4° lumbar). From the Wong, Hipp & Wharton, and Reitman datasets it can be shown that using automated software image analysis methods as opposed to manual methods for measuring IVA can reduce interobserver variability and thus also reduce observed intersite variability.
Collecting Dynamic Images “During the Bend” through the Diagnostic Use of Fluoroscopy for Functional Testing of the Spine
With the current standard of care for conducting functional testing of the spine, only static images are collected while subjects hold static posture in their MVBAs; no dynamic images are collected, and no images are collected during the bend. There have been several research groups who have addressed this potential shortcoming by collecting dynamic images at points throughout spine bending by using fluoroscopy.27–33 The principal advantage of using fluoroscopy instead of standard radiographs is that if a functional problem is only present dynamically, or if it is only visible at positions other than MVBA, it would never be detectable using the current standard of care. However, although arguably superior to the current standard of care, this method of functional imaging has never become widely used in the United States, because most major American payer organizations have refused to reimburse practitioners for such a use of diagnostic fluoroscopy.
Reducing the Subject-Related IVA Variability Introduced through Uncontrolled Bending During Imaging
Subject-related variability is perhaps the largest contributor to overall IVA measurement variability. A large amount of subject-related variability is introduced as a result of the way patients bend during imaging. According to the current clinical standard of care, patients are instructed to bend their spines to their MVBA in both flexion and extension, and then hold those postures static while standard radiographs are captured. However, MVBA bending is highly variable, as subjects have different bending abilities and therefore bend to highly variable MVBAs. Further, the willingness of the subject to bend consistently to the same MVBA from test to test is also dependent upon the patient’s perception of or fear of pain, which can be highly variable and unpredictable. One study examined the intrasubject variability in MVBA bending of the lumbar spine, and found that for the average patient, total gross lumbar spine bending varies about 26% from morning to evening.34 Because gross spinal motion can be devolved into the sum of the individual motions at each intervertebral level, it stands to reason that any variability in overall gross spine bending will be reflected in intervertebral motion.
In addition to the diurnal variation that any given patient exhibits in spine bending MVBAs, there is also a high degree of variability in MVBA from subject to subject. This variability can be expected to be considerable, given the range of sensitivity or stoicism of subjects, their level of pain, and their fear or resilience in the face of it. In the cervical spine, there is a wide range of MVBA observed in normal asymptomatic subjects. The 95% confidence interval on observed sagittal plane cervical spine MVBA was measured to range from 34° to 82° of total gross motion — a very large range. The authors of that study, which measured both total gross cervical spine motion and cervical intervertebral motion (IVA), observed that “… this variation in gross motion between individuals had a highly significant effect on all measures of IVM [intervertebral motion].”25 Variation in MVBA has also been measured in the lumbar spine among sufferers of chronic back pain.34 The 95% confidence interval on observed sagittal plane lumbar MVBA was reported to range from 25° to 93° of total gross motion, an even larger range than was observed in the cervical spine among asymptomatics.
One means of addressing for the variability in MVBA bending is to normalize IVA measurements against the measurements of total range of motion between an entire spinal region. For example, in the lumbar spine the IVA from any given level can be divided by the total bending that occurs between L1 and S1 to express IVA as a percentage of total lumbar range of motion. By doing this, it is possible to reduce the effects of the variability introduced by MVBA bending. In the case of the lumbar spine, this method has been shown to be an effective means of addressing the variability inherent in MVBA bending.29,30 This method has also been shown to be successful in studies involving the cervical spine.25
Another means of addressing IVA measurement variability caused by MVBA bending is through the use of passive rather than active spine bending. Dvorak and Panjabi (one of the authors of this chapter) published a study in 1991 in which they used a passive bending technique to decrease the variability in MVBA.8 In this study, an assistant applied a pulling force to subjects as they bent into flexion. The assistants attempted to pull the patients into passive flexion with as constant a force as possible, and in so doing provided a level of standardization in the bending angles of the patients. In this study of 41 patients, the authors reported an average standard deviation of 2.8° in the IVA measurements across the lumbar levels from passive lumbar bending, which represents a 36% reduction to the observed intersubject/intrasite variability as compared to the mean value of 4.4° for the average standard deviation across lumbar levels from the MVBA datasets listed in Table 10-2.
Another means of addressing the IVA variability caused by MVBA bending is to take IVA measurements from standardized bending angles (SBA). For the remainder of this text, IVA measurements taken from SBA will be referred to as sIVA, while IVA measurements taken from MVBA will be referred to as IVA. Wong (an author of this chapter) et al. developed a novel method of measuring sIVA that involved the use of an electrogoniometer connected to a fluoroscope, such that the electrogoniometer could trigger the capturing of images of the lumbar spine at every 10° of lumbar bending.23,24,31 Once images were collected, automated image analysis software was utilized to derive sIVA measurements from the fluoroscopic images. In that study, the authors reported an average standard deviation of 1.3° in the measurements of sIVA across the lumbar levels, which represents a 72% reduction to the observed intersubject/intrasite variability as compared to the mean value of 4.4° for the average standard deviation across lumbar levels from the IVA datasets listed in Table 10-2.
Motion Control Technology Used in Combination with Digital Videofluoroscopy and Automated Image Analysis Software
Breen et al. have integrated other recent technological developments — namely the use of digital videofluoroscopy plus the development of automated image analysis software to track vertebral bodies in sequential fluoroscopic images — together with these patient handling devices to produce a new system for conducting functional testing of the spine. Breen et al. have called this the OSMIA system, which stands for Objective Spinal Motion Imaging Assessment. Various components of this system have been discussed in a string of publications starting in 1988.32,35–39 Performance and validation testing of the passive recumbent integrated system was published in 2006.40 The results from this performance and validation testing suggest that the OSMIA system provides several important technical performance advantages relative to the current clinical standard of care.
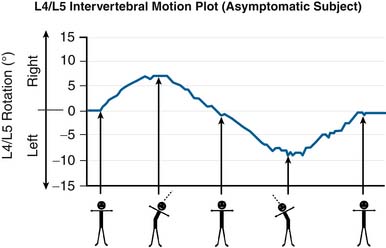
See Figure 10-4 for an example of how the OSMIA system plots sIVA against the gross lumbar bending angle (the angle between the thorax and the pelvis). The OSMIA system has been tested on a normative cohort of 30 asymptomatic subjects, and among these subjects, motion patterns were generally similar to that depicted in Figure 10-4.
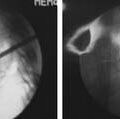
In addition to the asymptomatic subjects tested with the OSMIA system, symptomatic patients have been tested prior to surgical fusion or dynamic stabilization procedures. Among this patient cohort, there is case evidence that many of the “theoretically detectable” functional presentations depicted in Figure 10-2 are detectable with the OSMIA system. See Figure 10-5 for case evidence of patients presenting with paradoxical motion, immobility, and intervertebral hypomobility.
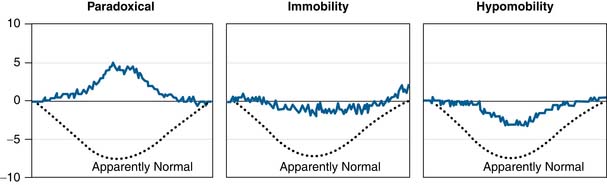
FIGURE 10-5 Case evidence of patients with lumbar degenerative disc disease presenting with apparent paradoxical motion, immobility, and apparent hypomobility. These plots depict motion at the index level as measured directly presurgical to a fusion or dynamic stabilization procedure. These motion plots represent sIVA measurements from passive recumbent side bending. In contrast to the motion plot depicted in Figure 10-4, which includes both the left and right phases of lateral lumbar spine bending, these motion plots represent intervertebral motion from only right lateral bending (to 40° of right lateral bending). The dashed “Normal” line on each graph is representative of the motion plots that were observed among the asymptomatic cohort.
New Insights into the Biomechanics of the Aging Spine
Physiologic Variation in sIVA among Normal Subjects Is Very Low
By producing such a dramatic reduction to the observed measurement variability, the Wong et al. data yield two profound discoveries. First, it is clear that there is actually very little physiologic variation in the sIVA measurements among asymptomatic subjects. This fact has remained obscured by the high variability inherent in today’s standard of care for functional testing of the spine. In fact, there is such little physiologic variation that it becomes possible to define very tight ranges for the 95% confidence interval of observed sIVA values. These ranges are narrow enough that it is possible to dramatically outperform the current clinical standard of care by: (1) being able to differentiate hypomobility from immobility, (2) differentiating hypomobility from normal motion, (3) detecting hypo/hypermobility with much tighter thresholds, which improves both the sensitivity of hypomobility/hypermobility detection as well as the specificity of the detection of normal motion. See Table 10-5 for the ranges for the detection of flexion-extension hypomobility and hypermobility for the measurement system devised by Wong et al.
Rethinking the Conventional Wisdom Regarding Intervertebral Hypomobility and Age
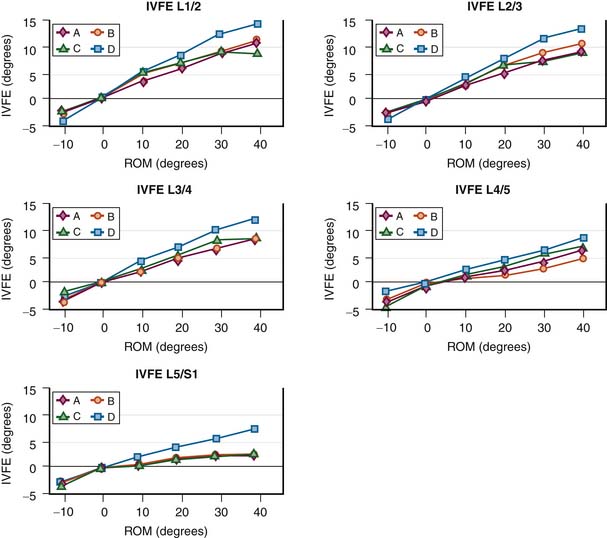
A second profound finding of Wong et al. is that when sIVA is examined, vertebral levels in normal subjects became less hypomobile as normal subjects experience healthy aging, not more hypomobile, as has been the conventional wisdom. See Figure 10-6 for these results as reported by Wong et al. This has very significant implications for the management of the aging spine. While it has been shown that a patient’s MVBA decreases with progressing age,41–43 Wong et al. have proved that this is not due to a decreased motion response of lumbar FSUs to gross lumbar bending. Therefore, intervertebral hypomobility as observed with sIVA should be considered to be the result of a pathological change, rather than a result of the normal aging process. Because intervertebral hypomobility is often associated with older patients with compromised disc height, it is important for practitioners to recognize intervertebral hypomobility observed with sIVA as being pathological, and not assume that intervertebral hypomobility in older patients is to be expected as part of the normal aging process.
Age-Related Differences in the Functional Presentations of Degenerative Spondylolisthesis Patients
After conducting a study of sIVA in normal asymptomatic subjects, Wong et al. used this new measurement system to examine sIVA in 91 degenerative spondylolisthesis sufferers. Among these 91 patients, Wong et al. found the following spinal segmental mobility patterns:44
A multiple regression analysis was then conducted to compare the predictive power of gender, age, grade of slippage, and disc height (as measured in the anatomical starting position) in predicting the mobility patterns that were observed among this population of degenerative spondylolisthesis sufferers. This analysis revealed that grade of slippage, followed by age, was a significant predictor of the observed mobility patterns. Specifically, younger patients with grade 1 L4/5 degenerative spondylolisthesis predicted hypermobility, whereas elder patients with grade 2 or above predicted a hypomobility pattern. These findings are consistent with the findings of Takayanagi et al,33 who found that IVT and IVA in bending radiographs are both reduced in degenerative spondylolisthesis patients as compared to asymptomatic controls, and that both IVT and IVA decrease as the grade of slippage increases.
Suggestions for the Clinical Use of Functional Testing Methods
Suggestions Regarding the Clinical Use of the Current Standard of Care
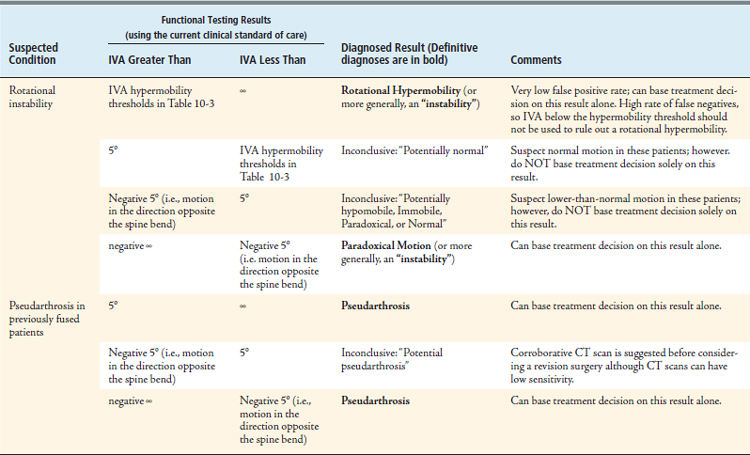
The current standard of care for conducting functional testing of the spine using standard radiographs and MVBA spine bending is the only method that is widely available to all practitioners, and will remain so until improved methods become commercially available. Therefore the authors put forward the suggestions given in Table 10-6 regarding the use of the current clinical standard of care for conducting functional diagnostics of the spine.
Suggestions Regarding the Clinical Use of Recently Developed Methods for Conducting Functional Testing of the Spine
The authors have already put forward the improvements to diagnostic efficacy that are potentially attainable through the adoption of these improved methods. However, if any of these newer methods is to be adopted, it is critical that all issues affecting patient safety are fully explored. The authors have put the key considerations regarding patient safety associated with the adoption of these new methods for functional testing in Table 10-7.
TABLE 10-7 The Authors’ Suggestions Regarding the Key Patient-Safety–Related Issues Related to the Adoption of Any of the Newer Methods for Conducting Functional Testing of the Spine
| Change to Functional Testing Method | Key Patient-Safety Issues and Authors’ Suggestions |
|---|---|
| The use of automated image analysis software instead of manual landmarking techniques |
1. Knutsson F. The instability associated with disc degeneration in the lumbar spine. Acta. Radiol.. 1944;25:593-608.
2. Panjabi M., Chang D., Dvorak J. An analysis of errors in kinematic parameters associated with in vivo functional radiographs. Spine. 1992;17:200-205.
3. Lim M.R., Loder R.T., Huang R.C., Lyman S., et al. Measurement error of lumbar total disc replacement range of motion. Spine. 2006;31(10):E291-E297.
4. Dvorak J., Panjabi M.M., Noventoy J.E., Chang D.G., Grob D. Clinical validation of functional flexion-extension roentgenograms of the lumbar spine. Spine. 1991;16(8):943-950.
5. Boden S.D., Wiesel S.W. Lumbosacral segmental motion in normal individuals. Have we been measuring instability properly? Spine. 1990;15(6):571-576.
6. Penning L., Wilmink J.T., van Woerden H.H. Inability to prove instability: a critical appraisal of clinical-radiological flexion-extension studies in lumbar disc degeneration. Diagn. Imaging Clin. Med.. 1984;53(4):186-192.
7. Shaffer W.O., Spratt K.F., Weinstein J., Lehmann T.R., Goel V. 1990 Volvo award in clinical sciences. The consistency and accuracy of roentgenograms for measuring sagittal translation in the lumbar vertebral motion segment: an experimental model. Spine. 1990;15(8):741-750.
8. Dvorak J., Panjabi M.M., Chang D.G., Theiler R., Grob D. Functional radiographic diagnosis of the lumbar spine: flexion-extension and lateral bending. Spine. 1991;16:562-571.
9. White A.A.III, Johnson R.M., Panjabi M.M., Southwick W.O. Biomechanical analysis of clinical stability in the cervical spine. Clin. Orthop.. 1975;109:85-96.
10. Myerding H.W. Spondylolisthesis. Surg. Gynecol. Obstet.. 1932;54:371-377.
11. Newman P.H. The etiology of spondylolisthesis. J. Bone Joint Surg. [Br]. 1963;45:39-59.
12. DeWald R.C. Spondylolisthesis. In Birdwell K.H., DeWald R.C., editors: The textbook of spinal surgery, second ed, Philadelphia: Lippincott-Raven, 1997.
13. Wiltse L.L. The etiology of spondylolisthesis. J. Bone Joint Surg. Am.. 1962;44-A:539-560.
14. McAfee P.C., Boden S.D., Brantigan J.W., Fraser R.D., et al. Symposium: a critical discrepancy–a criteria of successful arthrodesis following interbody spinal fusions. Spine. 2001;26(3):320-334.
15. Hipp J.A., Reitman C.A., Wharton N. Defining pseudoarthrosis in the cervical spine with differing motion thresholds. Spine. 2005;30(2):209-210.
16. Resnick D.K., Choudhri T.F., Dailey A.T., Groff M.W., et al. Guidelines for the performance of fusion procedures for degenerative disease of the lumbar spine. Part 4: radiographic assessment of fusion. J. Neurosurg. Spine. 2005;2:653-657.
17. Kirkaldy-Willis W.H: Instability of the lumbar spine, Clin. Orthop. Relat. Res., 165:1982, 110-123.
18. Park S.A., Ordway N., Fayyazi A., Fredrickson B., Yuan H.A. Measurement of paradoxical and coupled motions following lumbar total disc replacement. SAS Journal. 2008;2:137-139.
19. Selvik G. Roentgen stereophotogrammetry: a method for the study of the kinematics of the skeletal system. Acta Orthopaedica. Scandinavica.. 1989;232((Suppl. 60):1-51.
20. Zhang X., Xiong J. Model-guided derivation of lumbar vertebral kinematics in vivo reveals the difference between external marker-defined and internal segmental rotations. J. Biomech.. 2003;36:9-17.
21. Frobin W., Brinckmann P., Leivseth G., Biggemann M., Reikerås O. Precision measurement of segmental motion from flexion-extension radiographs of the lumbar spine. Clin. Biomech. (Bristol, Avon). 1996;11(8):457-465.
22. Frobin W., Brinckmann P., Biggemann M., Tillotson M., Burton K. “Precision measurement of disc height, vertebral height and sagittal plane displacement from lateral radiographic views of the lumbar spine.”. Clin. Biomech. (Bristol, Avon). 1997;12(Suppl. 1):S22-S30.
23. Wong K.W.M., Leong J.C., Chan M.K., Luk K.D., Lu W.W. The flexion/extension profile of 100 healthy volunteers. Spine. 2004;29(15):1636-1641.
24. Wong K.W.M., Luk K.D., Leong J.C., Wong S.F., Wong K.K. Continuous dynamic spinal motion analysis. Spine. 2006;31(4):414-419.
25. Reitman C.A., Mauro K.M., Nguyen L., Ziegler J.M., Hipp J.A. Intervertebral motion between flexion and extension in asymptomatic individuals. Spine. 2004;29(24):2832-2843.
26. J.A. Hipp, N.D. Wharton, Quantitative motion analysis (QMA) of motion-preserving and fusion technologies for the spine, In Yue JJ et al (eds). Motion Preservation Surgery of the Spine: Advanced Techniques and Controversies. Saunders, Philadelphia, 2008
27. H. Hino, K. Abumi, M. Kanayama, K. Kaneda, Dynamic motion analysis of normal and unstable cervical spines using cineradiography: an in vivo study, Spine. 15 24 (2) (1999) 163-8
28. Okawa A., Shinomiya K., Komori H., Muneta T., Arai Y., Nakai O. Dynamic motion study of the whole lumbar spine by videofluoroscopy. Spine. 1999;23(16):1743-1749.
29. Teyhen D.S., Flynn T.W., Childs J.D., et al. Fluoroscopic video to identify aberrant lumbar motion. Spine. 2007;32(7):E220-E229.
30. Harada, et al. Cineradiographic motion analysis of normal lumbar spine during forward and backward flexion. Spine. 2000;25(15):1932-1937.
31. Lee S.-W., Wong K.W.N., Chan M.-K., Yeung H.-M., Chiu J.L.F., Leong J.C.Y. Development and validation of a new technique for assessing lumbar spine motion. Spine. 2002;27:E215-E220.
32. Breen A.C., Allen R., Morris A. Spine kinematics: a digital videofluoroscopic technique. J. Biomed. Eng.. 1989;11:224.
33. Takayanagi K., Takahashi K., Yamagata M., Moriya H., Kitahara H., Tamaki T. Using cineradiography for continuous dynamic-motion analysis of the lumbar spine. Spine. 2001;26(17):1858-1865.
34. Ensink F.B., et al. Lumbar range of motion: influence of time of day and individual factors on measurements. Spine. 1996;21(11):1339-1343.
35 Breen A.C., et al. An image processing method for spine kinematics—preliminary studies. Clin. Biomech.. 1988;3:5-10.
36 Breen A.C., et al. A digital videofluoroscopic technique for spine kinematics. J. Med. Eng. Technol.. 1989;13(1-2):109-113.
37. Humphreys K., Breen A., Saxton D. Incremental lumbar spine motion in the coronal plane: an observer variation study using digital videofluoroscopy. Eur. J. Chiropractic.. 1990;38:56-62.
38. Breen A.C. Integrated spinal motion: a study of two cases. JCCA. 1991;35(1):25-30.
39. Muggleton J.M., et al. Automatic location of vertebrae in digitized videofluoroscopic images of the lumbar spine. Med. Eng. Phys.. 1997;19:77-89.
40. Breen A.C., et al. An objective spinal motion image assessment (OSMIA): reliability, accuracy, and exposure data. BMC Musculoskel.. 2006;7:1.
41. Fitzgerald G.K., et al. Objective assessment with establishment of normal values for lumbar spinal range of motion. Phys. Ther.. 1983;63:1776-1781.
42. Dvorak J., et al. Normal motion of the lumbar spine as related to age and gender. Eur. Spine J.. 1995;4:18-23.
43. Sullivan M.S., Dickinson C.E., Troup J.D. The influence of age and gender on lumbar spine sagittal plane range of motion: a study of 1126 healthy subjects. Spine. 1994;19:682-686.
44. K.W.N. Wong, et al: Different lumbar segmental motion patterns in patients with degenerative spondylolisthesis were detected with digital videofluoroscopic videos and distortion compensated roentgen analysis system. Presented at ISSLS 2007.
∗ In engineering terms, stiffness is measured in Newton-meters per degree (N m/°) while hypomobility is measured in degrees (°). However if one views the motion response of the FSU to a spine bend as an indicator of the mechanical stiffness of the FSU, then hypomobility can be viewed as a proxy measurement of stiffness.
∗ This is true for immobility, hypomobility, normal motion, and hypermobility. However, there is a “gold standard” available for the detection of pseudarthrosis, which involves the intraoperative examination of a previously fused level during a revision surgery. Using this “gold standard,” Sn, Sp, −LR and +LR for the use of IVA in detecting pseudarthrosis have been measured and reported.
∗ Standard axial CT scanning cannot adequately reveal the hairline defect which frequently characterizes a pseudarthrosis after posterior fusion, especially in the frequent presence of metal fixation, or when the graft is irregular in shape and thickness. However, there is evidence that thin-section helical CT is currently the most successful method of proving fusion or pseudarthrosis in interbody fusions with carbon cages. (See: Hutter CG: Posterior intervertebral body fusion: a 25-year study, Clin Orthop 179:86–96, 1983. Also see: Lang P, Genant HK, Chafetz N, Steiger P, Morris JM: Three-dimensional computed tomography and multiplanar reformations in the assessment of pseudarthrosis in posterior lumbar fusion patients, Spine 13:69–75, 1988.)