[level-membership-for-hematology-oncology-and-palliative-medicine-category]
Chapter 9 Iron deficiency anaemia and iron overload
Iron metabolism
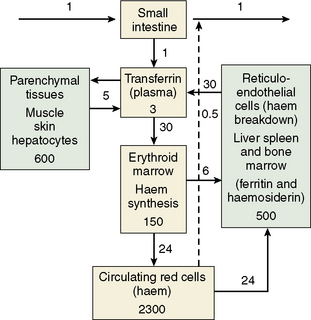
The iron content of the body and its distribution among the various proteins is summarized in Table 9.1. Most of the iron is present in the oxygen-carrying protein of the red blood cell, haemoglobin, the synthesis and breakdown of which dominates iron turnover. Haem of haemoglobin is synthesized in nucleated red cells in the bone marrow by a pathway ending with the incorporation of iron into protoporphyrin IX by ferrochelatase. Haem breakdown from haemoglobin takes place mainly in phagocytic cells, largely those in the spleen, liver and bone marrow. Iron is released from haem by haem oxygenase and is largely reused for haem synthesis. Every day about 30 mg iron is used to make new haemoglobin and most of this is obtained from the breakdown of old red cells.
| Protein | Location | Iron content (mg) |
|---|---|---|
| Haemoglobin | Red blood cells | 3000 |
| Myoglobin | Muscle | 400 |
| Cytochromes and iron sulphur proteins | All tissues | 50 |
| Transferrin | Plasma and extravascular fluid | 5 |
| Ferritin and haemosiderin | Liver, spleen and bone marrow | 100–1000 |
a The numbers are different for women.
The iron-binding protein transferrin is responsible for extracellular transport. Each molecule of transferrin can bind up to two molecules of ferric iron. Most cells obtain iron from diferric transferrin which binds to transferrin receptors (TfR) on the cell surface. This is followed by internalization into vesicles, release of iron, transport of iron into the cytoplasm and recycling of the apotransferrin (the protein without iron) into the plasma (Fig. 9.1).
Dietary Iron Absorption
Iron absorption1 depends on the amount of iron in the diet, its bioavailability and the body’s need for iron. A normal Western diet provides approximately 15 mg iron daily. Of that iron, digestion within the gut lumen releases about half in a soluble form, from which only about 1 mg (5–10% of dietary iron) is transferred to the portal blood in a healthy adult male.
Regulation of Iron Absorption
Iron absorption may be regulated both at the stage of mucosal uptake and at the stage of transfer to the blood. Recent studies show that in mice HIF-2α, a mediator of cellular adaptation to hypoxia, regulates DMT1 transcription and thus mucosal uptake of iron.2 As the epithelial cells develop in the crypts of Lieberkuhn, their iron status reflects that of the plasma (transferrin saturation) and this programmes the cells to absorb iron appropriately as they differentiate along the villus. Transfer to the plasma depends on the requirements of the erythron for iron and the level of iron stores. This regulation is mediated directly by hepcidin, a peptide synthesized in the liver in response to iron and inflammation.3
Cellular Iron Uptake and Release
Diferric transferrin binds with high affinity to the transferrin receptor (TfR1) on the membrane of the cell to form a complex which initiates clathrin-dependent endocytosis of the local membrane. The resulting endosome contains the holotransferrin–transferrin receptor complex.4 The pH of the endosome is reduced by a proton pump and a conformational change in holotransferrin is induced causing iron release. Iron is then reduced by a membrane-bound ferrireductase (six transmembrane epithelial antigen of the prostate 3, STEAP3 in erythroid cells5) and transported into the cytoplasm by DMT1. This iron is then either stored as ferritin or used within the cell. Iron destined for haem and mitochondrial iron sulphur (Fe-S) clusters is transported into mitochondria by mitoferrin for incorporation into protoporphyrin by ferrochelatase6 and for Fe-S cluster assembly on the scaffold protein ISCU.7 Export by ABCB7 of an as-yet unknown component to the cytoplasm stimulates Fe-S cluster protein assembly there, essential for cellular iron homeostasis.7 Apotransferrin and the transferrin receptor of the endosome return rapidly to the cell surface where they dissociate at neutral pH so that the cycle can start again.7a
Hepcidin synthesis in the hepatocyte is controlled at the transcriptional level through the alteration of levels within the nucleus of different transcription factors able to bind to the gene. Interaction of diferric transferrin, bone morphogenetic proteins (BMPs), interleukin (IL)-6 and other inflammatory cytokines with cell surface receptors TfR1, TfR2, hemojuvelin (HJV) and IL-6 receptor lead to upregulation of the hepcidin gene through different and sometimes interacting signalling pathways. TMPRSS6, a plasma membrane serine protease, inhibits the HJV-BMP-SMAD signaling pathway by cleaving HJV from the surface of the cell, thus preventing overproduction of hepcidin and maintaining iron homeostasis.8,9 A soluble form of HJV (sHJV) produced within the cell by the enzyme furin and released into the plasma antagonizes and also inhibits this pathway.10
The mechanism of action of the HFE protein is less clear. HFE binds to both TfR1 and TfR2, decreasing the affinity of each for transferrin. Stabilization and endocytosis of TfR2 stimulates hepcidin production and there is evidence that diferric transferrin displaces the protein HFE from TfR1, leaving it free to interact with TfR2, thus stimulating hepcidin production in response to plasma iron levels.11–13
Increased erythropoiesis causes decreased hepcidin, increased iron absorption and increased iron availability for haemoglobin production. So far, two plasma antagonists of the BMP-HJV-SMAD pathway, GDF15 and TWSG1, produced by erythroid cells and associated with expanded ineffective erythropoiesis, have been found.14,15 Alteration of the function of key regulators leads to body iron overload or iron deficiency (see later). The extent and the manner in which these regulatory pathways vary between different tissues await further investigation.
Iron Storage
All cells require iron for the synthesis of proteins but have the ability also to store excess iron. There are two forms of storage iron: a soluble form, known as ferritin and insoluble haemosiderin.16 Ferritin consists of a spherical protein (molecular mass 480 000) enclosing a core of ferric-hydroxy-phosphate, which may contain up to 4000 atoms of iron. Haemosiderin is a denatured form of ferritin in which the protein shells have partly degraded, allowing the iron cores to aggregate. Haemosiderin deposits are readily visualized with the aid of the light microscope as areas of Prussian-blue positivity after staining of tissue sections with potassium ferrocyanide in acid (see Chapter 4). Ferritin is found in all cells and in the highest concentration in liver, spleen and bone marrow.
Regulation of Iron Metabolism
The expression of a number of iron proteins involved in both transport and storage is largely controlled posttranscriptionally by iron regulatory proteins (IRP1 and 2).4 The conformation of IRP1 required for binding to mRNA iron-responsive elements (IREs) and the turnover of IRP2 are directly affected by the amount of iron within a cell. Depending on where the target IRE elements are found these proteins may inhibit or enhance translation of many proteins involved in iron metabolism.
Plasma Iron Transport
Almost all the iron in plasma is tightly bound to transferrin, which is usually less than 50% saturated with iron. Transferrin, when incompletely saturated with iron, exists in four forms: apo, monoferric (iron bound at the ‘A’ site), monoferric (B) and diferric. The distribution may be determined by urea-polyacrylamide electrophoresis.17 Delivery to cells requires specific binding to transferrin receptors. The plasma iron pool (transferrin-bound iron) is about 3 mg, although the daily turnover is more than 10 times his amount. In addition, smaller amounts of iron are carried in the plasma by other proteins.
Haptoglobin is a serum glycoprotein that avidly binds haemoglobin αβ dimers released into the bloodstream by haemolysis. The haemoglobin–haptoglobin complex is rapidly removed from the plasma by a specific receptor, CD163, highly expressed on tissue macrophages.18
Hemopexin19 is a plasma glycoprotein of molecular mass approximately 60 kDa that binds haem and transports the haem to cells by a process that involves receptor-mediated endocytosis and recycling of the intact protein.
Low concentrations of ferritin are found in the plasma and ferritin concentrations in healthy subjects reflect body iron stores. Much of this ferritin appears to be glycosylated and has a relatively low iron content.20 Such ferritin has a half life (T½) of approximately 30 h. Ferritin is also released into the circulation as a result of tissue damage (most strikingly after necrosis of the liver). Tissue ferritin is cleared rapidly from the circulation (T½ in approximately 10 min) by the liver.
Non-transferrin-bound iron describes a form of iron that is not bound to transferrin, is of low molecular mass and can be bound by specific iron chelators.21 Several assays have been described that have demonstrated such a fraction in plasma from patients with iron overload. The chemical form of this iron is unknown, but it is probably rapidly removed from the circulation by the liver. Recent studies implicate the involvement of the zinc transporter ZIP14 in this process.22
Iron status
Normal iron status implies a level of erythropoiesis that is not limited by the supply of iron and the presence of a small reserve of ‘storage iron’ to cope with normal physiological needs. The ability to survive the acute loss of blood (iron) that may result from injury is also an advantage. The limits of normality are difficult to define and some argue that physiological normality is the presence of only a minimal amount of storage iron23 but the extremes (i.e. iron deficiency anaemia and haemochromatosis) are well understood.23a
Apart from too little or too much iron in the body, there is also the possibility of a maldistribution (Fig. 9.2). An example is anaemia associated with inflammation or infection where there is a partial failure of erythropoiesis and of iron release from the phagocytic cells in liver, spleen and bone marrow, which results in accumulation of iron as ferritin and haemosiderin in these cells. Determination of iron status requires an estimate of the amount of haemoglobin iron (usually by measuring the haemoglobin concentration (Hb) in the blood; see Chapter 3) and the level of storage iron (measuring serum ferritin concentration). Iron deficiency should be suspected in hypochromic, microcytic anaemia, but in the early stages of iron deficiency red cells may be normocytic and normochromic. Another feature of iron deficiency is an increased concentration of protoporphyrin in the red cells; normally, there is a small amount present, but defective haem synthesis caused by lack of iron results in the accumulation of zinc protoporphyrin and occasionally free protoporphyrin may be increased as well.24
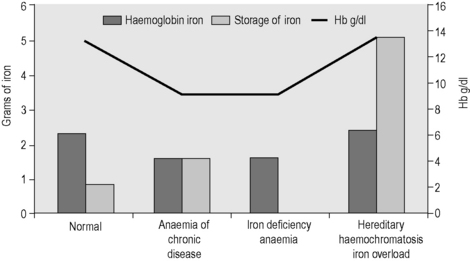
Figure 9.2 Body iron content and distribution in different conditions. Additional assays are sometimes required. In genetic haemochromatosis, early iron accumulation is indicated by increased transferrin saturation alone. The serum ferritin concentration increases only later as the level of stored iron increases. In the anaemia of chronic disease, patients often have normal serum ferritin concentrations even when storage iron in the bone marrow is absent (see p. 336). In this situation, the assay of serum transferrin receptor may help detect tissue iron deficiency.
Disorders of iron metabolism
Clinical aspects of iron metabolism have been reviewed25–27 and are summarized in Table 9.2. A guideline on the management of genetic haemochromatosis is available.28
| Iron deficiency |
| Deficient iron intake |
| Diet of low bioavailability |
| Increased physiological requirements due to rapid growth in early childhood and in adolescence |
| Blood loss: physiological (e.g. menstruation) or pathological (e.g. gastrointestinal) |
| Malabsorption of iron intake |
| Reduced gastric acid secretion (e.g. after partial gastrectomy) |
| Reduced duodenal absorptive area (e.g. in coeliac disease) |
| Rare, inherited iron-refractory iron deficiency anaemia |
| TMPRSS6 deficiency |
| Redistribution of iron |
| Macrophage iron accumulation |
| Inflammatory, infectious or malignant diseases (‘anaemia of chronic disease’) |
| Iron overload |
| Due to increased iron absorption |
| e.g. Hereditary haemochromatosis – commonly homozygosity for HFE C282Y but sometimes involving other genes (HAMP,HJV,TFR2,SLC40A1) Substantial ineffective erythropoiesis (e.g. β thalassaemia syndromes of intermediate and major severity, some types of sideroblastic anaemia, congenital dyserythropoietic anaemia) Sub-Saharan iron overload (‘Bantu siderosis’) – only in combination with increased dietary iron Other rare inherited disorders (e.g. congenital atransferrinaemia, DMT1 deficiency) Inappropriate iron therapy (rare) |
| Due to multiple blood transfusions in refractory anaemias |
| e.g. Thalassaemia major |
| Aplastic anaemia |
| Myelodysplastic syndromes |
Methods for assessing iron status
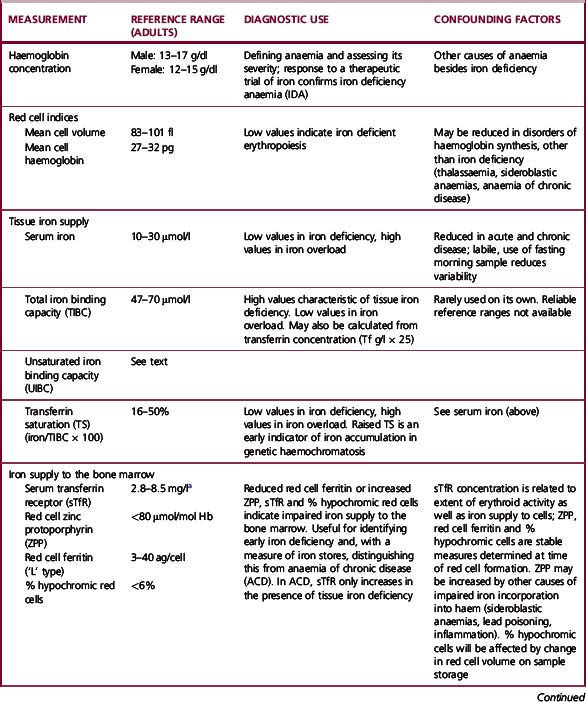
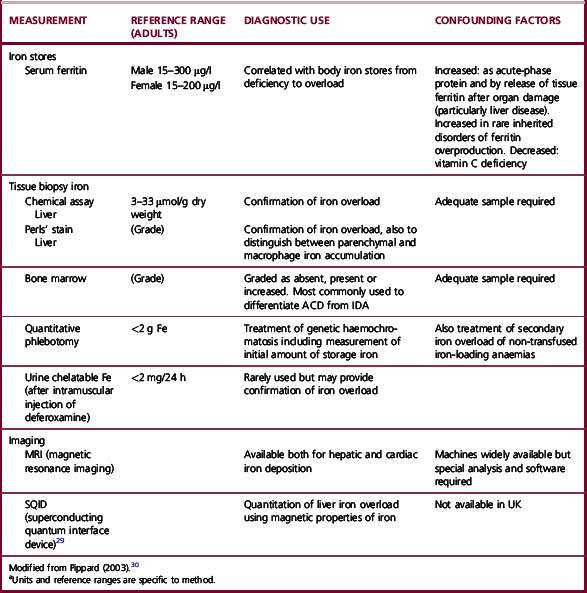
The methods used to assess iron status are summarized in Table 9.3. Some are not generally applicable but have value in the standardization of indirect methods. The determinations of Hb and red cell indices are described in Chapter 3.
Serum Ferritin Assay
With the recognition that the small quantity of ferritin in human serum (15–300 μg/l in healthy men) reflects body iron stores, measurement of serum ferritin has been widely adopted as a test for iron deficiency and iron overload. The first reliable method to be introduced was an immunoradiometric assay in which excess radiolabelled antibody was reacted with ferritin and antibody not bound to ferritin was removed with an immunoadsorbent.31 This assay was supplanted by the two-site immunoradiometric assay, which is sensitive and convenient. Since then the principle of this assay has been extended to non-radioactive labelling, including enzymes (enzyme-linked immunosorbent assay or ELISA). Most current laboratory immunoassay systems for clinical laboratories include ferritin in the assay repertoire. Factors to be considered when selecting an immunoassay system are discussed later. The method described in the next section is an ELISA. The most sophisticated equipment required is a microtitre plate reader.
Immunoassay for Ferritin
Preparation and Storage of Ferritin
Ferritin may be prepared from iron-loaded human liver or spleen obtained at operation (spleen) or postmortem. The informed consent of the patient or the patient’s relatives should be obtained for use in preparation of ferritin. Tissue should be obtained as soon as possible after death and may be stored at −20°C for 1 year. The usual precautions must be taken to avoid the risk of infection when handling tissues and extracts. Ferritin is purified by methods that exploit its stability at 75°C. Further purification is obtained by precipitation from cadmium sulphate solution and gel-filtration chromatography.32 Purity should be assessed by polyacrylamide gel electrophoresis,33 and the protein content determined by the method of Lowry and colleagues, as described by Worwood.33 Buffered solutions of human ferritin may be stored at 4°C, at concentrations of 1–4 mg protein/ml, in the presence of sodium azide as a preservative, for up to 3 years. Such solutions should not be frozen. Ferritin, from human liver or spleen, may be obtained from several suppliers of laboratory reagents. This should be used as an assay standard only after calibration against the international standard (see p. 183).
Antibodies to Human Ferritin
High-affinity antibodies to human liver or spleen ferritin are suitable. Polyclonal antibodies may be raised in rabbits or sheep by conventional methods,34 and the titre checked by precipitation with human ferritin.33 An immunoglobulin G (IgG)-enriched fraction of antiserum is required for labelling with enzyme in the assay. The simplest method is to precipitate IgG with ammonium sulphate.35 Monoclonal antibodies that are specific for ‘L’ subunit-rich ferritin (liver or spleen ferritin) are also suitable. A mouse monoclonal antibody and a horseradish peroxidase (HRP)-labelled antibody are available from NIBSC (www.nibsc.ac.uk; codes 87/654 and 87/662). Suitable antibodies are available from commercial suppliers.
Conjugation of Antiferritin IgG Preparation to Horseradish Peroxidase36
Preparation and Storage of a Standard Ferritin Solution
Dilute a solution of human ferritin to approximately 200 μg/ml in water. Measure the protein concentration by the method of Lowry after diluting further to 20–50 μg/ml. Then dilute the ferritin solution (approx. 200 μg/ml) accurately to a concentration of 10 μg/ml in 0.05 mol/l sodium barbitone solution containing 0.1 mol/l NaCl, 0.02% NaN3 and BSA (5 g/l) and adjusted to pH 8.0 with HCl. Deliver 200 μl into 200 small polypropylene tubes, cap tightly and store at 4°C for up to 1 year. For use, dilute in Buffer B to 1000 ng/ml, then prepare a range of standard solutions between 0.2 and 25 ng/ml. Calibrate this working standard against the World Health Organization (WHO) standard for the assay of serum ferritin 94/572, recombinant human L type ferritin. (Information available at: www.nibsc.ac.uk.)
Selecting an Assay Method
Interpretation
The use of serum ferritin for the assessment of iron stores has become well-established.31 In most normal adults, serum ferritin concentrations lie within the range of 15–300 μg/l. During the first months of life, mean serum ferritin concentrations change considerably, reflecting changes in storage iron concentration. Concentrations are lower in children (<15 years) than in adults and from puberty to middle life are higher in men than in women. In adults, concentrations <15 μg/l indicate an absence of storage iron. Reference ranges quoted by kit manufacturers vary and this is partly a result of the selection of ‘normal’ subjects. Sometimes subjects with iron deficiency are included and sometimes they are excluded. The interpretation of serum concentration in many pathological conditions is less straightforward, but concentrations <15 μg/l indicate depletion of storage iron. In children, mean levels of storage iron are lower and a 12 μg/l threshold has been found to be appropriate for detecting iron deficiency.39
In patients with acute or chronic disease, interpretation of serum ferritin concentrations is less straightforward and patients may have serum ferritin concentrations up to 100 μg/l despite an absence of stainable iron in the bone marrow. Ferritin synthesis is enhanced by interleukin-1 – the primary mediator of the acute-phase response.40 In patients with chronic disease, the following approach should be adopted: low serum ferritin concentrations indicate absent iron stores, values within the normal range indicate either low or normal levels and high values indicate either normal or high levels. In terms of adequacy of iron stores for replenishing haemoglobin in patients with anaemia, the degree of anaemia must also be considered. Thus a patient with Hb 10 g/dl may benefit from iron therapy if the serum ferritin concentration is <100 μg/l because below this level there is unlikely to be sufficient iron available for full regeneration. Here, measurement of serum transferrin receptor concentration may be of value (see p. 190).
Immunologically, plasma ferritin resembles the ‘L-rich’ ferritins of liver and spleen and only low concentrations are detected with antibodies to heart or HeLa cell ferritin, ferritins rich in ‘H’ subunits. The heterogeneity of serum ferritin on isoelectric focusing is largely the result of glycosylation and the presence of variable numbers of sialic acid residues and not variation in the ratio of H to L subunits.41 Attempts to assay for ‘acidic’ (or ‘H’-rich) isoferritins in serum as tumour markers have not been successful.41 The iron content of serum ferritin is low41 and measurement of this iron has no diagnostic use.42
Estimation of serum iron concentration
Iron is carried in the plasma bound to the protein transferrin (molecular mass 78 000). This molecule binds two atoms of iron as Fe3+ and delivers iron to cells by interaction with membrane transferrin receptors. The following method is a modification of that recommended by the International Council for Standardization in Haematology (ICSH) and is based on the development of a coloured complex when ferrous iron released by serum protein denaturation in the presence of reducing agent is treated with a chromogen solution.43
Alternative procedure: serum iron without protein precipitation
This is a microtitre plate method developed from the assay of Persijn et al.45
Reagents and Materials
Iron Standards 80 μmol/l and 40 μmol/l
Dilute with an equal volume of water to make the 40 μmol/l standard.
Method
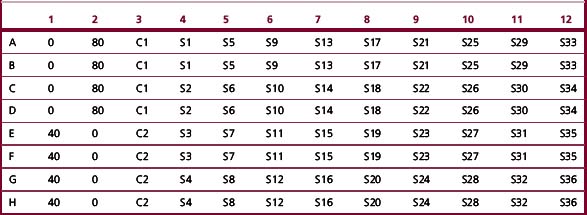
Add 80 μl deionized water (‘O’), standard solution (40, 80 μmol/l), controls (C1, C2) and samples (S1, S2, etc.) to the microtitre plate (see plate map, Table 9.4).
Automated Methods for Serum Iron
Procedures for measuring serum iron are available for most clinical chemistry analysers. A non-precipitation method similar to that described above is available from Randox Ltd (www.randox.com). The performance of several methods was reviewed by Tietz et al.46 who found differences between the various methods, particularly at low values of serum iron concentration. More recently, Blanck et al.47 carried out an interlaboratory comparison and found no significant differences in results generated by methods currently in use. Variability across laboratories and across methods was low. Serum iron concentrations may be measured by atomic absorption spectroscopy, but this has the disadvantage of measuring any haem iron present as a result of haemolysis and is not used for diagnostic purposes.
Serum iron concentrations in health and disease
Jacobs et al.48 measured serum iron concentrations in a random sample of 517 women and 499 men in the general population of Wales. Serum iron concentrations44 approximated to a normal distribution. The mean (±SD) of 16.1 ± 7.4 μmol/l in women was slightly lower than for men (18.0 ± 6.3 μmol/l). These figures do not refer to ‘iron replete’ subjects because subjects with absent iron stores or with frank anaemia were included. Using the microtitre plate method described earlier, Jackson and co-workers49 determined serum iron concentrations in 10 500 blood donors from South Wales. For 1502 ‘first time’ donors, mean age of 28 years, the mean (±SD) was 16.7 ± 6.0 μmol/l for men and 14.4 ± 6.7 μmol/l for women. Again subjects included potential donors who failed the screening test for anaemia and were not permitted to give blood on that occasion. In the first month of life mean concentration of serum iron is higher (22 μmol/l) than in adults, falls to about 12 μmol/l by the age of 1 year and remains at that level throughout childhood.50,51
Measurement of the serum iron concentration alone provides little useful clinical information because, although methodological variation is low, there is considerable variation from hour to hour and day to day in normal individuals (see p. 193). Low concentrations are found in patients with iron deficiency anaemia; in chronic disease (including inflammation, infection and cancer); and during the acute-phase response, including after surgery. Therefore, low serum iron concentrations do not necessarily indicate an absence of storage iron. High concentrations are found in liver disease, hypoplastic anaemias, ineffective erythropoiesis and iron overload.
Iron-binding capacity, serum transferrin and transferrin saturation
Estimation of Total Iron-Binding Capacity
Iron-binding capacity is usually measured by adding an excess of iron and measuring the iron retained in solution after the addition of a suitable reagent such as ‘light’ magnesium carbonate or an ion-exchange resin that removes excess iron. All methods are empiric and none is completely satisfactory. The method described as follows was developed by the ICSH.52
Reagents
Basic magnesium carbonate, MgCO3, ‘light grade’.
Saturating solution (100 μmol Fe/l).
Add 17.7 ml deionized water to a universal container (by weight is most convenient). Add 100 μl of 1 mol/l HCl. Add 100 μl commercial iron standard solution (see p. 185. Mix and store for up to 2 months at room temperature. The ‘saturating iron solution’ contains 5.6 μg Fe/ml (100 μmol Fe/l).
Method
Place 0.5 ml serum (EDTA-plasma should not be used) in a 1.5 ml polypropylene microcentrifuge tube and add 0.5 ml saturating iron solution. Mix carefully by hand and leave at room temperature for 15 min. Use a plastic scoop or tube to add 100 mg (± 15 mg) light magnesium carbonate and cap the tube. Shake vigorously and allow to stand for 30 min with occasional mixing. Centrifuge at 13 000 g for 4 min in a microcentrifuge. If the supernatant contains traces of magnesium carbonate, remove the supernatant and re-centrifuge. Carefully remove 0.5 ml supernatant and treat as serum for the iron estimation described earlier (p. 185). Multiply the final result by 2.
Determination of unsaturated iron-binding capacity
The UIBC may be determined by methods that detect iron remaining and able to bind to chromogen, after adding a standard and excess amount of iron to the serum.45 The UIBC is the difference between the amount added and the amount binding to the chromogen.
Reagents and Materials
Saturating Solution
2000 μmol iron/l. Add 7.95 ml deionized water to a universal container (by weight is most convenient). Add 1.0 ml Commercial Iron Standard Solution (1000 μg Fe/ml; see p. 185). Mix. Store for up to 2 months at room temperature.
Method
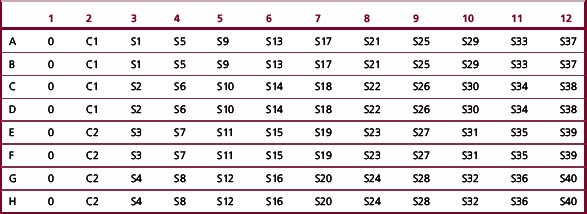
Add 80 μl deionized water (‘O’), control (C1, C2) and sample (S1, S2, etc.) to the microtitre plate (Table 9.5). Add 160 μl Tris–ascorbate–iron buffer to each well, using a multichannel pipette. Tap the tray to mix. Leave the tray for 20 min. During this time, take an initial reading (Ainitial) of the A560–570 nm. Add 40 μl of chromogen solution to each sample and tap the tray to mix; cover with a film or lid. Incubate for 40 min at 37°C. Take a final absorbance reading (Afinal).
Calculations
Once As has been calculated, it is used in the following equation:
For controls 1 and 2 and samples:

Determination of total iron-binding capacity from UIBC:

Fully Automated Methods
A number of methods to determine the TIBC using clinical chemistry analysers require a pretreatment step. Direct (fully automated procedures) have been developed.53 A non-precipitation method (UIBC) similar to that described above is available from Randox Ltd (Cat. No. S1250; www.randox.com).
Serum transferrin
An alternative approach is to measure transferrin directly by an immunological assay. This avoids some of the spuriously high values of TIBC found when the transferrin is saturated and non-transferrin iron is measured.43 Rate immunonephelometric methods are rapid and precise. There is generally a good correlation between the chemical and immunological TIBC,54,55 although when TIBC was calculated as the sFe + UIBC, values were lower than the direct TIBC.53 Transferrin concentrations (g/l) may be converted to TIBC (μmol/l) by multiplying by 25.
Normal Ranges of Transferrin and Total Iron-Binding Capacity
In health, the serum transferrin is 2.0–3.0 g/l and 1 mg of transferrin binds 1.4 μg of iron. The normal serum TIBC (mean ± SD) was 68.0 ± 12.6 μmol/l in a random sample of 517 women and 63.2 ± 9.1 μmol/l for 499 men.48 For 890 first-time, female blood donors of mean age 27 years the mean TIBC (determined by the UIBC method described earlier) was 56.7 ± 12.1 μmol/l. In 612 first-time, male blood donors of mean age 28 years the mean was 54.2 ± 10 μmol/l (mean ± SD).49 In both surveys, the sample included some individuals with iron deficiency. Note the comment earlier about lower values given by the colorimetric UIBC method. The TIBC is increased in iron deficiency anaemia and in pregnancy; it is lower than normal in infections, malignant disease and renal disease. In pathological iron overload, the TIBC of the serum is reduced.
Diagnostically, although a raised TIBC is characteristic of iron deficiency anaemia, the TIBC is usually used to calculate the transferrin saturation. The UIBC has attracted little diagnostic use, but is being evaluated as a screening test for iron overload in genetic haemochromatosis. In genetic haemochromatosis (subjects homozygous for HFE C282Y), a UIBC (determined as described earlier) of <20 μmol Fe/l was found in most men and in about 50% of women.49 UIBC and transferrin saturation were equally sensitive and specific. For UIBC methods, optimum thresholds for detecting subjects with genetic haemochromatosis have varied. Murtagh and co-workers56 determined the optimum threshold to be 25.6 μmol/l (sensitivity 0.91 and specificity 0.95). In this case, fasting blood samples were taken. UIBC was as reliable as transferrin saturation in detecting HFE haemochromatosis in both reports.
Transferrin saturation
The transferrin saturation is the ratio of the serum iron concentration and the TIBC expressed as a percentage. If transferrin is measured immunologically, then the corresponding TIBC (μmol/l) may be calculated by multiplying the transferrin concentration (g/l) by 25. In a sample of the Welsh population, the mean transferrin saturation in 499 men was 29.1 ± 11.0%; in 517 women it was 24.6 ± 11.8%.48 For first-time blood donors from South Wales the mean transferrin saturation was 31.1 ± 10.9% for 612 men and 25.5 ± 12.9% for 890 women.49 A transferrin saturation of <16% is usually considered to indicate an inadequate iron supply for erythropoiesis.57 The most valuable use of transferrin saturation is for the detection of genetic haemochromatosis. Even in the early stages of the development of iron overload,49,58 an elevated transferrin saturation is indicative of the disorder (suggested thresholds vary but >55% for men and >50% for women are an appropriate compromise),28 although a more recent guideline suggests >50% for men and >45% for women.23a
Transferrin Index
Beilby and co-workers59 have recommended that the transferrin saturation is replaced by the ‘transferrin index’. This is the serum iron concentration (μmol/l) divided by the transferrin concentration (determined immunologically and expressed as μmol/l). They claimed that the transferrin index had better precision that the transferrin saturation and showed greater specificity for detecting iron overload than the transferrin saturation. However, the transferrin index has attracted little use.
Serum transferrin receptor
Almost all cells in the body obtain iron from the plasma protein transferrin, but transferrin has a very high affinity for iron at neutral pH and iron release takes place through a specific membrane receptor. There are two types of transferrin receptors – TfR1 and TfR2 – encoded by different genes. TfR1 is essential for tissue iron delivery and is a homodimer consisting of two identical protein subunits of molecular mass 95 kDa. Transferrin binds to TfR1, the complex is internalized and iron is released when the pH of the internal vesicles is reduced to about 5.5. After iron release, apotransferrin remains bound to the receptor until exposed to an alkaline pH at the cell surface, returns to the circulation and can undertake further cycles of iron uptake and delivery.60 The cells that require most iron are the nucleated red cells in the bone marrow which synthesize haemoglobin and have the greatest number of transferrin receptors. TfR1 synthesis is also controlled by iron supply. The mechanism involves five IREs (see p. 178) at the 3′ untranslated region of the receptor mRNA. In the absence of iron, an IRP binds to each RNA IRE, thus stabilizing it and permitting synthesis of the protein chain. In the presence of adequate iron concentrations, binding of iron by the IRP changes the conformation of the protein and prevents its binding to the mRNA. The mRNA is rapidly broken down and synthesis of transferrin receptors is reduced. The second receptor, TFR2, also binds transferrin, but it is not required for iron delivery to cells and its synthesis is not regulated by IRPs.61
In 1986, Kohgo and co-workers62 reported that transferrin receptors were detectable in the plasma by immunoassay. Since then, there has been much investigation of the physiological and diagnostic significance of circulating transferrin receptors.63 The protein is derived by proteolysis at the cell membrane and circulates bound to transferrin. Plasma concentrations reflect the number of cellular receptors and, in patients with adequate iron stores, the number of nucleated red cells in the bone marrow. Because the number of cellular transferrin receptors per cell increases in iron deficiency, concentrations also increase when erythropoiesis becomes iron limited. Table 9.6 summarizes the conditions associated with reduced or elevated levels of circulating transferrin receptor.
Table 9.6 Serum transferrin receptor (sTfR) concentrations in human disease
| sTfR concentration | Condition | |
|---|---|---|
| Increased | Increased erythroid proliferation: | |
| Autoimmune haemolytic anaemia | ||
| Hereditary spherocytosis | ||
| β Thalassaemia intermedia or major | ||
| β Thalassaemia/HbE | ||
| Haemoglobin H disease | ||
| Sickle cell anaemia | ||
| Polycythaemia vera | ||
| Decreased tissue iron stores: | ||
| Iron deficiency anaemia | ||
| Normal to increased | Idiopathic myelofibrosis | |
| Myelodysplastic syndrome | ||
| Chronic lymphocytic leukaemia | ||
| Normal | Haemochromatosis (but see text) | |
| Acute and chronic myeloid leukaemia | ||
| Most lymphoid malignancies | ||
| Solid tumours | ||
| Anaemia of chronic disease | ||
| Decreased | Chronic renal failure | |
| Aplastic anaemia | ||
| After bone marrow transplantation | ||
Modified from Feelders et al (1999).60
Assays for the Serum Transferrin Receptor
There has been no agreement about the source of transferrin receptor as standard or as an antigen for the raising of antibodies. Transferrin receptors have been purified from placenta and from serum. The receptor may or may not be bound to transferrin as a standard or to raise antibodies. No ‘reference’ method is therefore described here. Three enzyme immunoassay kits (Orion; Ramco; R&D) for the determination of serum transferrin receptor concentrations have been evaluated for the Medical Devices Agency.64 All have been approved for diagnostic purposes in the USA by the Food and Drug Administration. Assays for fully automated, diagnostic, immunoassay systems are now being introduced and offer improved sensitivity, reproducibility and speed.
The different reference ranges in the available commercial assays reflect the differences in preparations of transferrin receptor used to raise antibodies and as a standard in the various assays. For the Orion, Ramco and R&D kits Akesson et al.65 and Worwood et al.64 noted some assay drift but found acceptable intra-assay coefficient of variance (CV) values. The determined sensitivity was adequate for clinical purposes for the three assay systems. Four different units (nmol/l, μg/ml, mg/l and ku/l) and different normal ranges are in use.66 At the present time, serum transferrin receptor (sTfR) is not included in the national external quality control schemes for the UK (NEQAS) and the Welsh External Quality Assessment Scheme (WEQAS). A WHO reference reagent for the serum transferrin receptor has now been established and an international collaborative study showed that using this reagent as a standard markedly improved agreement between methods. Currently available commercial assays are listed in this report.67
Reference Ranges
sTfR concentrations are high in neonates and decline until adult concentrations are reached at 17 years. Concentrations are similar in normal men and non-pregnant women. During pregnancy sTfR levels increase, returning to non-pregnant values 12 weeks after delivery.68 sTfR concentrations obtained with different assay systems cannot be directly compared because reference ranges differ.
Samples
The information provided by the manufacturers shows good recovery of standard and linearity but some problems with interference.64 Although serum is the preferred matrix, the R&D and Ramco assays give the same results with EDTA, heparin and citrate plasma. Orion states that EDTA-plasma is not acceptable. It is recommended that sera are stored for no more than 2 days at room temperature, 7 days at 2–8°C, 6 months at –20°C and 1 year at –70°C. Repeated freezing and thawing are not advisable. Moderate haemolysis is not a problem.
Transferrin Receptor Concentrations in Diagnosis
Erythropoiesis
The function of the TfR1 in delivering iron to the immature red cell immediately suggested an application in the clinical laboratory for the assay of circulating TfR. The use of the assay to monitor changes in the rate of erythropoiesis has been explored by several authors.69 When iron supply is not limiting, the assay can provide a replacement for ferrokinetic investigations that required the injection of radioactive iron.
Iron Deficiency
The major application of the serum transferrin receptor assay has been to detect patients with an absence of stored iron (ferritin and haemosiderin in cells). In infants (age 8–15 months) sTfR concentration increases with increased severity of iron deficiency.70 When normal subjects undergo quantitative phlebotomy, serum ferritin concentrations decrease steadily as iron stores are depleted, but there is little change in sTfR concentration. As iron stores become exhausted (serum ferritin <15 μg/l), sTfR levels increase and continue increasing as haemoglobin concentrations decrease.71 In this study the increased rate of erythropoiesis during phlebotomy had little effect on sTfR levels as long as iron stores were adequate so that most of the increase in sTfR level was the result of iron deficiency rather than increased erythropoiesis. However, the rate of phlebotomy was only 250 ml per week (about 500 ml per week is usually removed during treatment of haemochromatosis) and higher rates might cause an immediate increase in sTfR levels during phlebotomy. The log[sTfR/serum ferritin] gives a linear relationship with storage iron that has considerable potential for assessing iron stores in epidemiological studies.72
Circulating transferrin receptor levels increase, not only in patients with simple iron deficiency but also in patients with the anaemia of chronic disease who lack stainable iron in the bone marrow.73 Identifying a lack of storage iron in patients with the anaemia of chronic disease is difficult without this measurement because serum iron concentrations are low regardless of iron stores and serum ferritin concentrations are higher than in patients not suffering from chronic disease who have similar levels of stainable iron in the bone marrow (see p. 336). Unfortunately, the sTFR has not proved to be superior to serum ferritin for detecting iron deficiency in all studies (Table 9.7).
Table 9.7 Overall variability (%) of assays for iron status (within subject, day-to-day coefficient of variation for healthy subjects)
In both iron deficiency anaemia and the anaemia of chronic disease, sTfR levels are also influenced by changes in the rate of erythropoiesis. Ineffective erythropoiesis – an increase in the proportion of immature red cells destroyed within the bone marrow – increases in iron deficiency anaemia.86 In the anaemia of chronic disease, erythropoiesis is normal or depressed87; nevertheless, iron deficiency increases the number of receptors.
Although it has been claimed that sTfR measurements provide a sensitive indicator of iron deficiency in pregnancy,88 questions remain about the decreased erythropoiesis in early pregnancy because this may mask iron deficiency at this time89 and increases in sTfR in later pregnancy appear to relate to increased erythropoiesis rather than iron depletion.68 Measurement of sTfR did not enhance the sensitivity and specificity for the detection of iron deficiency anaemia in pregnant women from Malawi, where anaemia and chronic disease are both common.90
Iron Overload
Normal concentrations of sTfR have been reported for patients with genetic haemochromatosis (although some had been venesected) and also for patients with African iron overload.91 In contrast, lower mean values of sTfR were found in subjects with a raised transferrin saturation.92,93 However, there is considerable overlap with the normal range of sTfR concentration and measurement of sTfR in iron overload is unlikely to be of diagnostic value.
Erythrocyte protoporphyrin
Protoporphyrin IX is the immediate precursor to haem. The enzyme ferrochelatase is able to insert ferrous iron to produce haem or zinc cation to form zinc protoporphyrin (ZPP). When iron supply to ferrochelatase is limiting, ZPP increases. When ferrochelatase is limiting, free protoporphyrin accumulates. Different assays differ in the extent to which they measure and/or discriminate between these two forms of erythrocyte protoporphyrin (EP). Assay of EP94 has been performed for many years as a screening test for lead poisoning. More recently, there has been considerable interest in its use in evaluating the iron supply to the bone marrow. The protoporphyrin concentration of red blood cells increases in iron deficiency. Usually, more than 95% is present as ZPP. The original method converts zinc to free protoporphyrin, requires a chemical extraction and use of a fluorescence spectrometer.94 This has now been largely replaced for detection of iron deficiency by the direct measurement of the fluorescence of ZPP (μmol/mol haem) in an instrument called a haematofluorometer.24
Analysers
Two dedicated analysers are available: the Proto Fluor Z from Helena Laboratories, Beaumont, Texas (www.helena.com) and the ZPP 206D from Aviv Biomedical, Inc (www.avivbiomedical.com). These should be operated exactly as described by the manufacturer. The small sample size (about 20 μl of venous or skin-puncture blood), simplicity, rapidity and reproducibility within a laboratory are advantages. Furthermore, the test has an interesting retrospective application. Because it takes weeks for a significant proportion of the circulating red blood cells to be replaced with new cells, it is possible to make a diagnosis of iron deficiency anaemia some time after iron therapy has commenced. Chronic diseases that reduce serum iron concentration, but do not reduce iron stores, also increase protoporphyrin levels.95
Diagnostic Applications
The measurement of EP levels as an indicator of iron deficiency has particular advantages in paediatric haematology and in large-scale surveys in which the small sample size and simplicity of the test are important. The normal range in adults is less than 70 μmol/mol haem. Mean values in normal women are slightly higher than in men.96 One potential confounder is the contribution of other fluorescent compounds (including drugs) in the plasma and concentrations are lower if washed red cells are assayed.84 However, washing is a tedious process and is rarely undertaken. Paediatric reference ranges have been determined in 6478 subjects (ages 0–17 years).97 Mean ZPP values were higher in females than males and declined slightly with age. A diurnal variation was noted, with ZPP concentrations being higher between 18.00 h and midnight. No explanation was offered.
The WHO39 has recommended levels for the detection of iron deficiency. For children younger than age 5 years, levels should be >61 μmol/mol haem; for all other subjects, levels should be >70 μmol/mol haem. These are higher than the 97.5 percentile established from surveys of healthy children97 and are based on the sensitivity and specificity for detecting the absence of storage iron.
Units
Infection and inflammation, lead poisoning and haemolytic anaemia all cause significant elevation of ZPP. Measurement of ZPP is most useful when iron deficiency is common and the other conditions are rare. In the general clinical laboratory, therefore, ZPP provides less information about iron storage levels in patients with anaemia than does the serum ferritin assay.98
Hepcidin
Reliable assays for serum hepcidin have now been developed but their role in the differential diagnosis of both iron deficiency and iron overload is not yet clear although a number of useful diagnostic applications are being investigated.99 An international survey of urinary and plasma hepcidin assays demonstrated that absolute concentrations vary widely. However, analytical variation was generally low and similar for the six methods included in the study.100
Methodological and biological variability of assays
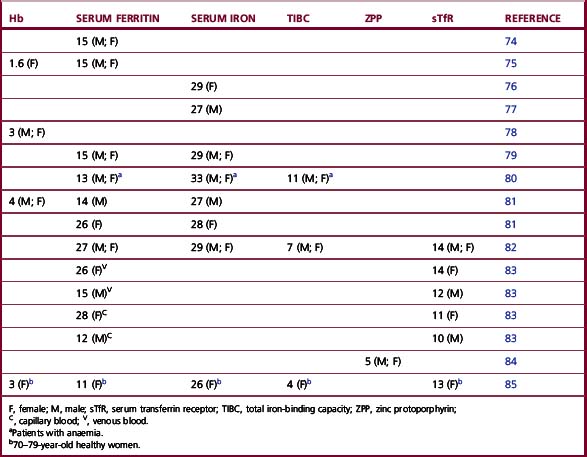
The blood assays vary greatly in both methodological and biological stability. Haemoglobin concentrations are stable and a simple and well-standardized method ensures relatively low day-to-day variation in individuals (Table 9.7). Automated cell counters analyse at least 10 000 cells and thus increase precision. ZPP values also appear to be relatively stable. The more complicated procedures involved in immunoassays result in higher methodological variation for serum ferritin assays (CV of about 5%) and this, coupled with some physiological variation, gives an overall CV for serum ferritin for an individual over a period of weeks of the order of 15%. There is, however, little evidence of any significant diurnal variation in serum ferritin concentration.74 On the other hand, the serum iron determination has a reasonably low methodological variation coupled with extreme physiological variability, giving an overall ‘within subject’ CV of approximately 30% when venous samples are taken at the same time of day. A diurnal rhythm has been reported with higher values in the morning than in late afternoon, when the concentration may fall to 50% of the morning value.44 However, variations are not consistently diurnal.101 The circadian fluctuation is largely the result of variation in the release of iron from the reticuloendothelial system to the plasma. It should be noted that for the studies summarized in Table 9.7 the type of blood sample, length of study period and statistical analysis vary. The somewhat higher variability for Hb and ferritin reported by Borel et al.81 may be a result of their use of capillary blood and plasma. Pootrakul et al.102 have demonstrated that mean plasma ferritin concentration is slightly higher in capillary specimens than venous specimens and that within- and between-sample variation was approximately three-fold greater. Variability was less for capillary serum than plasma but still greater than for venous serum. However, the increased variability of capillary samples may be related to sampling technique, because Cooper and Zlotkin83 found little difference in variability between venous and capillary samples.
The effect of menstruation on iron-status indicators was examined in 1712 women aged 18–44 years after adjusting for potential confounders.103 Adjusted mean values of Hb, transferrin saturation and serum ferritin were lowest for women whose blood was drawn during menses and highest for women examined in luteal or late luteal phase of the menstrual cycle (Hb, 13.0 versus 13.3 g/dl; transferrin saturation, 21.2% versus 24.8%, p<0.01 for both; serum ferritin, 17.2 versus 24.0 μg/l, p<0.05). The prevalence estimate of impaired iron status was significantly higher for women whose blood was drawn during the menstrual phase than for women whose blood was drawn during the luteal and late luteal phases. The authors concluded that cyclic variations in indicators of iron status are a potential source of error when iron status is assessed in large population surveys that include women of reproductive age.103
Starvation, or even fasting for a short period, can cause elevation of the serum ferritin concentration,104 and vitamin C deficiency can reduce ferritin concentration.105 Moderate exercise has little effect on serum ferritin concentration,106 although exhausting exercise leads to increases in serum ferritin concentration as a result of muscle damage and inflammatory reactions.107,108 Seasonal changes in red cell parameters have been reported109 and Maes et al.82 found statistically significant seasonal patterns for serum iron, transferrin, serum ferritin and sTfR. The peak–trough difference in the yearly variation, expressed as a percentage of the mean, was greatest for serum ferritin (39%) and least for sTfR and transferrin (12%).
These results have clear implications for the use of these assays in population studies. For accurate diagnosis, either a multiparameter analysis is required or several samples should be assayed. For haemoglobin, one sample was required for 95% confidence and 20% accuracy;110 for sTfR, one sample was required,83,111 but for ferritin one to three samples were required.83,110
Predictive value of blood tests for iron deficiency
The major diagnostic use of the various measures of iron status is in the differential diagnosis of hypochromic anaemia. The large amount of iron present as haemoglobin means that the degree of any anaemia must always be considered in assessing iron status. There is an overall reduction in body iron in iron deficiency anaemia. No single measurement of iron status is ideal for all clinical circumstances because all are affected by confounding factors (Table 9.3). The anaemia of chronic disorders is associated with normal or increased iron stores (normal or increased serum ferritin), accompanied by a reduced tissue iron supply (low serum iron and low to normal TIBC). Although the serum ferritin is an acute-phase reactant, values below 50 μg/l are usually associated with absent iron stores in rheumatoid arthritis, renal disease and inflammatory bowel disease. Serum transferrin receptor levels may also provide valuable diagnostic information on iron deficiency in chronic disease.
Despite years of investigations, there is little definitive evidence of how different measurements compare in their ability to diagnose iron deficiency. The main reason for this is the difficulty of distinguishing between the presence and absence of storage iron. Most investigators have used the grade of storage iron in the bone marrow as a ‘gold standard’. This is an invasive procedure and therefore limits drastically the number of patients investigated. It is often difficult to justify bone marrow aspiration to determine a patient’s iron status and even more difficult in the case of normal volunteers. Furthermore, bone marrow aspiration followed by staining for iron is not a reproducible procedure. Observer error,112 inadequate specimens and lack of correlation with response to iron therapy113 have been described. Demonstrating a response in Hb to oral iron therapy has been the method of choice to diagnose iron deficiency retrospectively in paediatric practice.
Iron Deficiency Anaemia in Adults
Almost all measures show a high sensitivity and specificity for distinguishing between subjects with iron deficiency and those with iron stores and normal haemoglobin levels in the absence of any other disease process. Guyatt et al.114 conducted a systematic review of the diagnostic value of the various laboratory tests for iron deficiency. They concluded that serum ferritin was the most powerful test for simple iron deficiency and also for iron deficiency in hospital patients. However, this analysis did not include measurements of sTfR.
Detection of Iron Deficiency in Acute or Chronic Disease
Table 9.8 summarizes a number of studies in which bone marrow iron was assessed and the sensitivity and specificity of various assays was compared. Despite very different results between studies, some general points may be made.
Table 9.8 Sensitivity/specificity of methods for diagnosis of iron deficiency in the presence of chronic disease
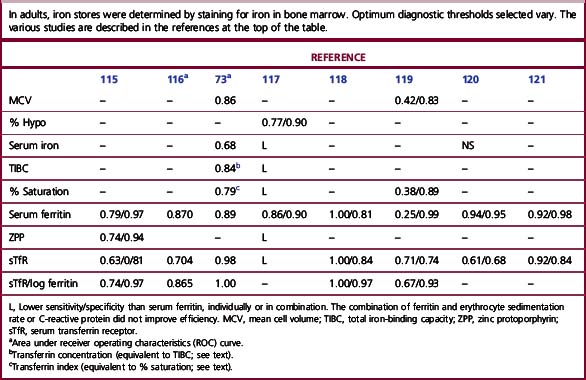
Combinations of serum ferritin, erythrocyte sedimentation rate (ESR) or C-reactive protein (CRP) either in a discriminant analysis111 or logistic regression122 provide only marginal improvement in the ability to detect a lack of storage iron.
The serum transferrin receptor level discriminates between the presence and absence of storage iron, although there is disagreement as to whether the assay is superior to serum ferritin. Several studies show that the sTfR/log10 ferritin ratio provides superior discrimination to either test on its own. The use of log ferritin decreases the influence of serum ferritin (and thus the acute-phase response) on the overall ratio. Although the log[sTfR/ferritin] is an excellent measure of iron stores in healthy subjects,72 this transformation (i.e. after calculating the ratio of sTfR/ferritin) may not provide the best discrimination for clinical applications. When the assay of sTfR is readily available on high-throughput immunoanalysers the sTfR/log ferritin ratio may provide the best discriminator for identifying the coexistence of iron deficiency in chronic disease. However, this will also require standardization of units and ranges for the various sTfR assays if the use of the ratio is to gain wide acceptance.
Functional Iron Deficiency
Functional iron deficiency is the situation in which iron stores are apparently adequate but iron supply for erythropoiesis remains inadequate. This often occurs during the treatment of patients with anaemia and renal failure with erythropoietin. The diagnostic question is to identify those patients with a functional iron deficiency who will require parenteral iron therapy to respond to erythropoietin with an acceptable increase in Hb. The percentage hypochromic erythrocytes is a good predictor of response.123 Fishbane and colleagues124 concluded that reticulocyte haemoglobin content (CHr) was a markedly more stable analyte than serum ferritin or transferrin saturation and it predicted functional iron deficiency more efficiently. They did not include percentage hypochromic cells in their analysis. Fernandez-Rodriguez and colleagues125 assessed the sensitivity and specificity of ferritin, TIBC, transferrin saturation index, red blood cell ferritin and sTfR in 63 patients with anaemia and chronic renal failure undergoing dialysis, who were not being treated with erythropoietin. Storage iron was assessed by bone marrow iron staining. For serum ferritin, a cut-off value of 121 μg/l gave a sensitivity and specificity of 75%. Efficiency was lower for sTfR and RBC ferritin. MCV, transferrin saturation index and TIBC showed the lowest values for sensitivity and specificity.
Iron Deficiency in Infancy and Childhood
In infants, thresholds for the diagnosis of iron deficiency and iron deficiency anaemia are not universally agreed. There are rapid changes in iron status in the first year of life as fetal haemoglobin is replaced by adult haemoglobin. The serum ferritin concentration is a less useful guide to iron deficiency than in adults partly because of the rapid decline in concentration in the first 6 months and the low concentrations generally found in children older than 6 months of age. Domellof et al.126 have suggested revised cut-offs for iron deficiency, including serum ferritin and sTfR, for infants up to age 1 year.
In children, the reason for detecting iron deficiency is to identify those who will respond to iron therapy. Margolis et al.127 found that the best predictor of response was the initial Hb, although sensitivity was only 66% and specificity was 60%. Serum ferritin, transferrin saturation and erythrocyte protoporphyrin (EP) had even lower efficiencies and combination of the various measures made little improvement. Hershko et al.128 studied children in villages from the Golan Heights (Israel) and concluded that EP was a more reliable index of iron deficiency than serum ferritin. They suggested that a significant incidence of chronic disease affected both ferritin and iron values. ZPP provides a useful indicator of iron-deficient erythropoiesis, although high values may indicate lead poisoning rather than iron deficiency. The small sample volume for ZPP determination is also an advantage in paediatric practice.
A report published in 2003 confirms the effect of low-level infection on measures of iron status. Abraham et al.129 studied 101 healthy, 11-month-old infants. On the morning of blood sampling, slight clinical signs of airway infection were observed for 42 infants. Extensive blood analyses were done, including a high sensitivity one for C-reactive protein (CRP). CRP measured by the routine methods gave values of <6 mg/l for all infants, but with the high sensitivity assay values were higher for many infants with symptoms of airway infection. Serum iron concentration was depressed in these children and correlated significantly with CRP level. When a further blood sample was taken, serum ferritin concentration was higher for the children with the higher CRP level, serum iron was reduced, but sTfR and transferrin levels were unaffected.
Pregnancy
In early pregnancy serum ferritin concentrations usually provide a reliable indication of iron deficiency. Haemodilution in the 2nd and 3rd trimesters of pregnancy reduces the concentrations of all measures of iron status and this means that the threshold values for iron deficiency established in non-pregnant women are not appropriate. In principle, determination of values as ratios (ZPP μmol/mol haem, transferrin saturation and sTfR/ferritin) should be more reliable. In healthy women who were not anaemic and who were supplemented with iron,68 serum iron, transferrin saturation and serum ferritin fell from the 1st to the 3rd trimester and increased after delivery; TIBC increased during pregnancy and fell after delivery. sTfR concentrations showed a substantial increase (approximately two-fold) during pregnancy and this probably reflects increased erythropoiesis.68 In contrast, Carriaga et al.88 had reported that the mean sTfR concentration of pregnant women in the 3rd trimester did not differ from that in non-pregnant women and that sTfR concentration was not influenced by pregnancy per se. Choi et al.68 suggest that different assays and different ages in the control groups may explain this discrepancy.
1 Miret S., Simpson R.J., McKie A.T. Physiology and molecular biology of dietary iron absorption. Annu Rev Nutr. 2003;23:283-301.
2 Mastrogiannaki M., Matak P., Keith B., et al. HIF-2 alpha, but not HIF-1 alpha, promotes iron absorption in mice. J Clin Invest. 2009;119:1159-1166.
3 Ganz T. Hepcidin: a key regulator of iron metabolism and mediator of anemia of inflammation. Blood. 2003;102:783-788.
4 Hentze M.W., Muckenthaler M.U., Andrews N.C. Balancing acts: molecular control of mammalian iron metabolism. Cell. 2004;117:285-297.
5 Ohgami R.S., Camagna D.R., Greer E.L., et al. Identification of a ferrireductase required for efficient transferrin-dependent iron uptake in erythroid cells. Nat Genet. 2005;37:1264-1269.
6 Paradkar P.N., Zumbrennen K.B., Paw B.H., et al. Regulation of mitochondrial iron import through differential turnover of mitoferrin 1 and mitoferrin 2. Mol Cell Biol. 2009;29:1007-1016.
7 Lill R. Function and biogenesis of iron-sulphur proteins. Nature. 2009;460:831-838.
7a Anderson G.J., Vulpe C.D. Mammalian iron transport. Cell Mol Life Sci. 2009;66:3241-3261.
8 Silvestri L., Pagani A., Nai I., et al. The serine protease matriptase-2 (TMPRSS6) inhibits hepcidin activation by cleaving membrane hemojuvelin. Cell Metab. 2008;8:502-511.
9 Finberg K.E., Whittlesey R.L., Fleming M.D., et al. Downregulation of Bmp/Smad signaling by Tmprss6 is required for maintenance of systemic iron homeostasis. Blood. 2010. Epub Mar 03
10 Lin L., Goldberg Y.P., Ganz T. Competitive regulation of hepcidin mRNA by soluble and cell-associated hemojuvelin. Blood. 2005;106:2884-2889.
11 Andriopoulos B.Jr, Corradini E., Xia Y., et al. BMP6 is a key endogenous regulator of hepcidin expression and iron metabolism. Nat Genet. 2009;41:482-487.
12 Johnson B., Chen J., Murchison N., et al. Transferrin receptor 2: evidence for ligand-induced stabilization and redirection to a recycling pathway. Mol Biol Cell. 2007;18:743-754.
13 Ramey G., Deschemin J.-C., Vaulont S. Cross-talk between the mitogen activated protein kinase and bone morphogenetic/hemojuvelin pathways is required for the induction of hepcidin by holotransferrin in primary mouse hepatocytes. Haematologica. 2009;94:765-772.
14 Tanno T., Bhanu N.V., Oneal P.A., et al. High levels of GDF15 in thalassaemia suppress expression of the iron regulatory protein hepcidin. Nat Med. 2007;13:1096-1101.
15 Tanno T., Parayette P., Sripichai O., et al. Identification of TWSG1 as a second novel erythroid regulator of hepcidin expression in murine and human cells. Blood. 2009;114:181-186.
16 Harrison P.M., Arosio P. The ferritins: molecular properties, iron storage function and cellular regulation. Biochim Biophys Acta. 1996;1275:161-203.
17 Leibman A., Aisen P. Distribution of iron between the binding sites of transferrin in serum: methods and results in normal human subjects. Blood. 1979;53:1058-1065.
18 Kristiansen M., Graversen J.H., Jacobsen C., et al. Identification of the haemoglobin scavenger receptor. Nature. 2001;409:198-201.
19 Tolosano E., Altruda F. Hemopexin: structure, function and regulation. DNA Cell Biol. 2002;21:297-306.
20 Worwood M. Ferritin. Blood Rev. 1990;4:259-269.
21 Hider R.C. Nature of nontransferrin-bound iron. Eur J Clin Invest. 2002;32:50-54.
22 Liuzzi J.P., Aydemir F., Nam H., et al. Zip14 (Slc39a14) mediates non-transferrin-bound iron uptake into cells. Proc Natl Acad Sci U S A. 2006;103:13612-13617.
23 Sullivan J.L. Iron and the sex difference in heart disease risk. Lancet. 1981;1:1293-1294.
23a EASL clinical practice guidelines for HFE hemochromatosis. J Hepatol. 2010;53:3-22.
24 Labbe R.F., Vreman H.J., Stevenson D.K. Zinc protoporphyrin: a metabolite with a mission. Clin Chem. 1999;45:2060-2072.
25 Hoffbrand A.V., Worwood M. Iron overload. In: Hoffband A.V., Tuddenham E., Catovsky D., editors. Postgraduate Haematology. Oxford: Blackwell, 2005.
26 Worwood M., Hoffband A.V. Iron metabolism and iron deficiency. In: Hoffband A.V., Tuddenham E., Catovsky D., editors. Postgraduate Haematology. Oxford: Blackwell, 2005.
27 Finberg K.E. Iron-refractory iron deficiency anemia. Semin Hematol. 2009;46:378-386.
28 Dooley J., Worwood M. Guidelines on diagnosis and therapy: genetic haemochromatosis. British Committee for Standards in Haematology; 2000. Available at: www.bcshguidelines.com
29 Brittenham G.M. Noninvasive methods for the early detection of hereditary hemochromatosis. [Review]. Ann N Y Acad Sci. 1988;526:199-208.
30 Pippard M.J. Iron-deficiency anemia, anemia of chronic disorders and iron overload. In: Wickramasinghe S.L., McCullough J., editors. Blood and Bone Marrow Pathology. London: Churchill Livingstone; 2003:203-228.
31 Worwood M. Ferritin in human tissues and serum. Clin Haematol. 1982;11:275-307.
32 ICSH (Expert Panel on Iron). Proposed international standard of human ferritin for the serum ferritin assay. Br J Haematol. 1985;61:61-63.
33 Worwood M. Serum ferritin. In: Cook J.D., editor. Iron. New York: Churchill Livingstone; 1980:59-89.
34 Dresser D.W. Immunization of experimental animals. In: Weir D.M., editor. Handbook of Experimental Immunology. Oxford: Blackwell Science; 1986:8.1-8.21.
35 Johnson G.D., Holborow E.J. Preparation and use of fluorochrome conjugates. In: Weir D.M., editor. Handbook of Experimental Immunology. Oxford: Blackwell Science; 1986:28.1-28.21.
36 Wilson M.B., Nakane P.K. Recent developments in the periodate method of conjugating horseradish peroxidase (HRPO) to antibodies. In: Knapp W., Houlbar K., editors. Immunofluorescence and Related Staining Techniques. Amsterdam: Elsevier/North-Holland; 1978:215-224.
37 Boscato L.M., Stuart M.C. Heterophilic antibodies: a problem for all immunoassays. Clin Chem. 1988;34:27-33.
38 Zweig M.H., Csako G., Benson C.C., et al. Interference by anti-immunoglobulin G antibodies in immunoradiometric assays of thyrotropin involving mouse monoclonal antibodies. Clin Chem. 1987;33:840-844.
39 World Health Organization. Iron deficiency anemia. Assessment, prevention and control. A guide for programme managers, 2001. Available at: www.who.int/nut/documents/ida_assessment_prevention_control
40 Rogers J.T., Bridges K.R., Durmowicz G.P., et al. Translational control during the acute phase response. Ferritin synthesis in response to interleukin-1. J Biol Chem. 1990;265:14572-14578.
41 Worwood M. Serum ferritin. Clin Sci. 1986;70:215-220.
42 Nielsen P., Gunther U., Durken M., et al. Serum ferritin iron in iron overload and liver damage: correlation to body iron stores and diagnostic relevance. J Lab Clin Med. 2000;135:413-418.
43 ICSH. Revised recommendations for the measurement of serum iron in human blood. Br J Haematol. 1990;75:615-616.
44 Bothwell T.H., Charlton R.W., Cook J.D., et al. Iron Metabolism in Man. Oxford: Blackwell Scientific; 1979.
45 Persijn J.-P., van der Slik W., Riethorst A. Determination of serum iron and latent iron- binding capacity (LIBC). Clinica Chimica Acta. 1971;35:91-98.
46 Tietz N.W., Rinker A.D., Morrison S.R. When is a serum iron really a serum iron? A follow-up study on the status of iron measurements in serum. Clin Chem. 1996;42:109-111.
47 Blanck H.M., Pfeiffer C.M., Caudill S.P., et al. Serum iron and iron-binding capacity: a round-robin interlaboratory comparison study. Clin Chem. 2003;49:1672-1675.
48 Jacobs A., Waters W.E., Campbell H., et al. A random sample from Wales III. Serum iron, iron binding capacity and transferrin saturation. Br J Haematol. 1969;17:581-587.
49 Jackson H.A., Carter K., Darke C., et al. HFE mutations, iron deficiency and overload in 10 500 blood donors. Br J Haematol. 2001;114:474-484.
50 Koerper M.A., Dallman P.R. Serum iron concentration and transferrin saturation in the diagnosis of iron deficiency in children: normal developmental changes. J Pediatr. 1977;91:870-874.
51 Saarinen U.M., Siimes M.A. Developmental changes in serum iron, total iron binding capacity and transferrin saturation in infancy. J Pediatr. 1977;91:877.
52 International Committee for Standardization in Haematology. The measurement of total and unsaturated iron binding capacity in serum. Br J Haematol. 1978;38:281-290.
53 Siek G., Lawlor J., Pelczar D., et al. Direct serum total iron-binding capacity assay suitable for automated analyzers. Clin Chem. 2002;48:161-166.
54 Yamanishi H., Iyama S., Yamaguchi Y., et al. Total iron-binding capacity calculated from serum transferrin concentration or serum iron concentration and unsaturated iron-binding capacity. Clin Chem. 2003;49:175-178.
55 Gambino R., Desvarieux E., Orth M., et al. The relation between chemically measured total iron-binding capacity concentrations and immunologically measured transferrin concentrations in human serum. Clin Chem. 1997;43:2408-2412.
56 Murtagh L.J., Whiley M., Wilson S., et al. Unsaturated iron binding capacity and transferrin saturation are equally reliable in detection of HFE hemochromatosis. Am J Gastroenterol. 2002;97:2093-2099.
57 Bainton D.F., Finch C.A. The diagnosis of iron deficiency anemia. Am J Med. 1964;37:62-70.
58 Edwards C.Q., Kushner J.P. Screening for hemochromatosis. N Engl J Med. 1993;328:1616-1620.
59 Beilby J., Olynyk J., Ching S., et al. Transferrin index: an alternative method for calculating the iron saturation of transferrin. Clin Chem. 1992;38:2078-2081.
60 Feelders R.A., Kuiperkramer E.P.A., Vaneijk H.G. Structure, function and clinical significance of transferrin receptors. Clin Chem Lab Med. 1999;37:1-10.
61 Trinder D., Baker E. Transferrin receptor 2: a new molecule in iron metabolism. Int J Biochem Cell Biol. 2003;35:292-296.
62 Kohgo Y., Nishisato T., Kondo H., et al. Circulating transferrin receptor in human serum. Br J Haematol. 1986;64:277-281.
63 Cook J.D. The measurement of serum transferrin receptor. Am J Med Sci. 1999;318:269-276.
64 Worwood M., Ellis R.D., Bain B.J. Three Serum Transferrin Receptor ELISAs. Norwich: HMSO; 2000. MDA/2000/09
65 Akesson A., Bjellerup P., Vahter M. Evaluation of kits for measurement of the soluble transferrin receptor. Scand J Clin Lab Invest. 1999;59:77-81.
66 Kuiperkramer E.P.A., Huisman C.M.S., Vanraan J., et al. Analytical and clinical implications of soluble transferrin receptors in serum. Eur J Clin Chem Clin Biochem. 1996;34:645-649.
67 Thorpe S.J., Heath A., Sharp G., et al. A WHO Reference reagent for the Serum Transferrin Receptor (sTfR): international collaborative study to evaluate a recombinant soluble transferrin receptor preparation. Clin Chem Lab Med. 2010;48:815-820.
68 Choi J.W., Im M.W., Pai S.H. Serum transferrin receptor concentrations during normal pregnancy. Clin Chem. 2000;46:725-727.
69 Beguin Y., Clemons G.K., Pootrakul P., et al. Quantitative assessment of erythropoiesis and functional classification of anemia based on measurements of serum transferrin receptor and erythropoietin. Blood. 1993;81:1067-1076.
70 Olivares M., Walter T., Cook J.D., et al. Usefulness of serum transferrin receptor and serum ferritin in diagnosis of iron deficiency in infancy. Am J Clin Nutr. 2000;72:1191-1195.
71 Skikne B., Flowers C.H., Cook J.D. Serum transferrin receptor: a quantitative measure of tissue iron deficiency. Blood. 1990;75:1870-1876.
72 Cook J.D., Flowers C.H., Skikne B.S. The quantitative assessment of body iron. Blood. 2003;101:3359-3364.
73 Punnonen K., Irjala K., Rajamaki A. Serum transferrin receptor and its ratio to serum ferritin in the diagnosis of iron deficiency. Blood. 1997;89:1052-1057.
74 Dawkins S., Cavill I., Ricketts C., et al. Variability of serum ferritin concentration in normal subjects. Clin Lab Haematol. 1979;1:41-46.
75 Gallagher S.K., Johnson L.K., Milne D.B. Short-term and long-term variability of indexes related to nutritional-status. I. Ca, Cu, Fe, Mg and Zn. Clin Chem. 1989;35:369-373.
76 Statland B.E., Winkel P. Relationship of day-to-day variation of serum iron concentration to iron-binding capacity in healthy young women. Am J Clin Pathol. 1977;67:84-90.
77 Statland B.E., Winkel P., Bokieland H. Variation of serum iron concentration in healthy young men: within day and day-to-day changes. Clin Biochem. 1976;9:26-29.
78 Statland B.E., Winn R.K., Harris S.C. Evaluation of biologic sources of variation of leucocyte counts and other hematologic quantities using very precise automated analysers. Am J Clin Pathol. 1977;69:48-54.
79 Pilon V.A., Howantitz P.J., Howanitz J.H., et al. Day-to-day variation in serum ferritin concentration in healthy subjects. Clin Chem. 1981;27:78-82.
80 Romslo I., Talstad I. Day-to-day variations in serum iron, serum iron binding capacity, serum ferritin and erythrocyte protoporphyrin concentrations in anaemic subjects. Eur J Haematol. 1988;40:79-82.
81 Borel M.J., Smith S.M., Derr J., et al. Day-to-day variation in iron-status indices in healthy men and women. Am J Clin Nutr. 1991;54:729-735.
82 Maes M., Bosmans E., Scharpe S., et al. Components of biological variation in serum soluble transferrin receptor: relationships to serum iron, transferrin and ferritin concentrations and immune and haematological variables. Scand J Clin Lab Invest. 1997;57:31-41.
83 Cooper M.J., Zlotkin S.H. Day-to-day variation of transferrin receptor and ferritin in healthy men and women. Am J Clin Nutr. 1996;64:738-742.
84 Hastka J., Lasserre J.J., Schwarzbeck A., et al. Washing erythrocytes to remove interferents in measurements of zinc protoporphyrin by front-face hematofluorometry. Clin Chem. 1992;38:2184-2189.
85 Ahluwalia N. Diagnostic utility of serum transferrin receptors measurement in assessing iron status. Nutr Rev. 1998;56:133-141.
86 Kuiperkramer P.A., Huisman C.M.S., Vandermolensinke J., et al. The expression of transferrin receptors on erythroblasts in anaemia of chronic disease, myelodysplastic syndromes and iron deficiency. Acta Haematol. 1997;97:127-131.
87 Fitzsimons E.J., Houston T., Munro R., et al. Erythroblast iron metabolism and serum soluble transferrin receptor values in the anemia of rheumatoid arthritis. Arthritis Rheum. 2002;47:166-171.
88 Carriaga M.T., Skikne B.S., Finley B., et al. Serum transferrin receptor for the detection of iron deficiency in pregnancy. Am J Clin Nutr. 1991;54:1077-1081.
89 Akesson A., Bjellerup P., Berglund M., et al. Serum transferrin receptor: a specific marker of iron deficiency in pregnancy. Am J Clin Nutr. 1998;68:1241-1246.
90 Van den Broek N.R., Letsky E.A., White S.A., et al. Iron status in pregnant women: which measurements are valid? Br J Haematol. 1998;103:817-824.
91 Baynes R.D., Cook J.D., Bothwell T.H., et al. Serum transferrin receptor in hereditary hemochromatosis and African siderosis. Am J Hematol. 1994;45:288-292.
92 Khumalo H., Gomo Z.A.R., Moyo V.M., et al. Serum transferrin receptors are decreased in the presence of iron overload. Clin Chem. 1998;44:40-44.
93 Looker A.C., Loyevsky M., Gordeuk V.R. Increased serum transferrin saturation is associated with lower serum transferrin receptor concentration. Clin Chem. 1999;45:2191-2199.
94 Piomelli S. The diagnostic utility of measurements of erythrocyte porphyrins. Hematol Oncol Clin North Am. 1987;1:419-430.
95 Hastka J., Lasserre J.J., Schwarzbeck A., et al. Zinc protoporphyrin in anemia of chronic disorders. Blood. 1993;81:1200-1204.
96 Yip R. Changes in iron metabolism with age. In: Brock J.H., Halliday J.W., Pippard M.J., et al, editors. Iron Metabolism in Health and Disease. London: WB Saunders; 1994:427-448.
97 Soldin O.P., Miller M., Soldin S.J. Pediatric reference ranges for zinc protoporphyrin. Clin Biochem. 2003;36:21-25.
98 Zanella A., Gridelli L., Berzuini A., et al. Sensitivity and predictive value of serum ferritin and free erythrocyte protoporphyrin for iron deficiency. J Lab Clin Med. 1989;113:73-78.
99 Bergamaschi G., Villani L. Serum hepcidin: a novel diagnostic tool in disorders of iron metabolism. Haematologica. 2009;94:1631-1633.
100 Kroot J.J.C., Hendriks J.C.M., Laarakkers C.M.M., et al. (Pre)analytical imprecision, between-subject variability and daily variations in serum and urine hepcidin: Implications for clinical studies. Anal Biochem. 2009;389:124-129.
101 Dale J.C., Burritt M.F., Zinsmeister A.R. Diurnal variation of serum iron, iron-binding capacity, transferrin saturation and ferritin levels. Am J Clin Pathol. 2002;117:802-808.
102 Pootrakul P., Skikne B.S., Cook J.D. The use of capillary blood for measurements of circulating ferritin. Am J Clin Nutr. 1983;37:307-310.
103 Kim I., Yetley E.A., Calvo M.S. Variations in iron-status measures during the menstrual cycle. Am J Clin Nutr. 1993;58:705-709.
104 Lundberg P.A., Lindstedt G, Andersson T., et al. Increase in serum ferritin concentration induced by fasting. Clin Chem. 1984;30:161-163.
105 Chapman R.W., Gorman A., Laulicht M., et al. Binding of serum ferritin to concanavalin A in patients with iron overload and with chronic liver disease. J Clin Pathol. 1982;35:481-486.
106 Nikolaidis M.G., Michailidis Y., Mougios V. Variation of soluble transferrin receptor and ferritin concentrations in human serum during recovery from exercise. Eur J Appl Physiol. 2003;89:500-502.
107 Fallon K.E. The acute phase response and exercise: the ultramarathon as prototype exercise. Clin J Sport Med. 2001;11:38-43.
108 Stupnicki R., Malczewska J., Milde K., et al. Day to day variability in the transferrin receptor/ferritin index in female athletes. Br J Sports Med. 2003;37:267-269.
109 Kristalboneh E., Froom P., Harari G., et al. Seasonal changes in red-blood-cell parameters. Br J Haematol. 1993;85:603-607.
110 Lammikeefe C.J., Lickteig E.S., Ahluwalia N., et al. Day-to-day variation in iron status indexes is similar for most measures in elderly women with and without rheumatoid arthritis. J Am Diet Assoc. 1996;96:247-251.
111 Ahluwalia N., Lammikeefe C.J., Bendel R.B., et al. Iron-deficiency and anemia of chronic disease in elderly women: a discriminant–analysis approach for differentiation. Am J Clin Nutr. 1995;61:590-596.
112 Bentley D.P., Williams P. Serum ferritin concentration as an index of storage iron in rheumatoid arthritis. J Clin Pathol. 1974;27:786-1738.
113 Tessitore N., Solero G.P., Lippi G., et al. The role of iron status markers in predicting response to intravenous iron in haemodialysis patients on maintenance erythropoietin. Nephrol Dial Transplant. 2001;16:1416-1423.
114 Guyatt G., Oxman A.D., Ali M., et al. Laboratory diagnosis of iron-deficiency anemia – an overview. J Gen Intern Med. 1992;7:145-153.
115 van Tellingen A., Kuenen J.C., de Kieviet W., et al. Iron deficiency anaemia in hospitalized patients: value of various laboratory parameters. Differentiation between IDA and ACD. Neth J Med. 2001;59:270-279.
116 Lee E.J., Oh E.J., Park Y.J., et al. Soluble transferrin receptor (sTfR), ferritin and sTfR/log ferritin index in anemic patients with nonhematologic malignancy and chronic inflammation. Clin Chem. 2002;48:1118-1121.
117 Kurer S.B., Seifert B., Michel B., et al. Prediction of iron deficiency in chronic inflammatory rheumatic disease anaemia. Br J Haematol. 1995;91:820-826.
118 Bultink I.E.M., Lems W.F., de Stadt R.J.V., et al. Ferritin and serum transferrin receptor predict iron deficiency in anemic patients with rheumatoid arthritis. Arthritis Rheum. 2001;44:979-981.
119 Means R.T., Allen J., Sears D.A., et al. Serum soluble transferrin receptor and the prediction of marrow iron results in a heterogeneous group of patients. Clin Lab Haematol. 1999;21:161-167.
120 Joosten E., Van Loon R., Billen J., et al. Serum transferrin receptor in the evaluation of the iron status in elderly hospitalized patients with anemia. Am J Hematol. 2002;69:1-6.
121 Mast A.E., Blinder M.A., Gronowski A.M., et al. Clinical utility of the soluble transferrin receptor and comparison with serum ferritin in several populations. Clin Chem. 1998;44:45-51.
122 Kotru M., Rusia U., Sikka M., et al. Evaluation of serum ferritin in screening for iron deficiency in tuberculosis. Ann Hematol. 2004;83:95-100.
123 Macdougall I.C., Cavill I., Hulme B., et al. Detection of functional iron-deficiency during erythropoietin treatment: a new approach. Br Med J. 1992;304:225-226.
124 Fishbane S., Shapiro W., Dutka P., et al. A randomized trial of iron deficiency testing strategies in hemodialysis patients. Kidney Int. 2001;60:2406-2411.
125 Fernandez-Rodriguez A.M., Guindeo-Casasus M.C., Molero-Labarta T., et al. Diagnosis of iron deficiency in chronic renal failure. Am J Kidney Dis. 1999;34:508-513.
126 Domellof M., Dewey K.G., Lonnerdal B., et al. The diagnostic criteria for iron deficiency in infants should be reevaluated. J Nutr. 2002;132:3680-3686.
127 Margolis H.S., Huntley H.H., Bender T.R., et al. Iron deficiency in children: the relationship between pretreatment laboratory tests and subsequent hemoglobin response to iron therapy. Am J Clin Nutr. 1981;34:2158-2168.
128 Hershko C., Baror D., Gaziel Y., et al. Diagnosis of iron-deficiency anemia in a rural-population of children: relative usefulness of serum ferritin, red-cell protoporphyrin, red-cell indexes and transferrin saturation determinations. Am J Clin Nutr. 1981;34:1600-1610.
129 Abraham K., Muller C., Gruters A., et al. Minimal inflammation, acute phase response and avoidance of misclassification of vitamin A and iron status in infants: importance of a high-sensitivity C-reactive protein (CRP) assay. Int J Vitam Nutr Res. 2003;73:423-430.
[/level-membership-for-hematology-oncology-and-palliative-medicine-category][not-level-membership-for-hematology-oncology-and-palliative-medicine-category]
Chapter 9 Iron deficiency anaemia and iron overload
Iron metabolism
The iron content of the body and its distribution among the various proteins is summarized in Table 9.1. Most of the iron is present in the oxygen-carrying protein of the red blood cell, haemoglobin, the synthesis and breakdown of which dominates iron turnover. Haem of haemoglobin is synthesized in nucleated red cells in the bone marrow by a pathway ending with the incorporation of iron into protoporphyrin IX by ferrochelatase. Haem breakdown from haemoglobin takes place mainly in phagocytic cells, largely those in the spleen, liver and bone marrow. Iron is released from haem by haem oxygenase and is largely reused for haem synthesis. Every day about 30 mg iron is used to make new haemoglobin and most of this is obtained from the breakdown of old red cells.
| Protein | Location | Iron content (mg) |
|---|---|---|
| Haemoglobin | Red blood cells | 3000 |
| Myoglobin | Muscle | 400 |
| Cytochromes and iron sulphur proteins | All tissues | 50 |
| Transferrin | Plasma and extravascular fluid | 5 |
| Ferritin and haemosiderin | Liver, spleen and bone marrow | 100–1000 |
a The numbers are different for women.
The iron-binding protein transferrin is responsible for extracellular transport. Each molecule of transferrin can bind up to two molecules of ferric iron. Most cells obtain iron from diferric transferrin which binds to transferrin receptors (TfR) on the cell surface. This is followed by internalization into vesicles, release of iron, transport of iron into the cytoplasm and recycling of the apotransferrin (the protein without iron) into the plasma (Fig. 9.1).
Dietary Iron Absorption
Iron absorption1 depends on the amount of iron in the diet, its bioavailability and the body’s need for iron. A normal Western diet provides approximately 15 mg iron daily. Of that iron, digestion within the gut lumen releases about half in a soluble form, from which only about 1 mg (5–10% of dietary iron) is transferred to the portal blood in a healthy adult male.
Regulation of Iron Absorption
Iron absorption may be regulated both at the stage of mucosal uptake and at the stage of transfer to the blood. Recent studies show that in mice HIF-2α, a mediator of cellular adaptation to hypoxia, regulates DMT1 transcription and thus mucosal uptake of iron.2 As the epithelial cells develop in the crypts of Lieberkuhn, their iron status reflects that of the plasma (transferrin saturation) and this programmes the cells to absorb iron appropriately as they differentiate along the villus. Transfer to the plasma depends on the requirements of the erythron for iron and the level of iron stores. This regulation is mediated directly by hepcidin, a peptide synthesized in the liver in response to iron and inflammation.3
Cellular Iron Uptake and Release
Diferric transferrin binds with high affinity to the transferrin receptor (TfR1) on the membrane of the cell to form a complex which initiates clathrin-dependent endocytosis of the local membrane. The resulting endosome contains the holotransferrin–transferrin receptor complex.4 The pH of the endosome is reduced by a proton pump and a conformational change in holotransferrin is induced causing iron release. Iron is then reduced by a membrane-bound ferrireductase (six transmembrane epithelial antigen of the prostate 3, STEAP3 in erythroid cells5) and transported into the cytoplasm by DMT1. This iron is then either stored as ferritin or used within the cell. Iron destined for haem and mitochondrial iron sulphur (Fe-S) clusters is transported into mitochondria by mitoferrin for incorporation into protoporphyrin by ferrochelatase6 and for Fe-S cluster assembly on the scaffold protein ISCU.7 Export by ABCB7 of an as-yet unknown component to the cytoplasm stimulates Fe-S cluster protein assembly there, essential for cellular iron homeostasis.7 Apotransferrin and the transferrin receptor of the endosome return rapidly to the cell surface where they dissociate at neutral pH so that the cycle can start again.7a
Hepcidin synthesis in the hepatocyte is controlled at the transcriptional level through the alteration of levels within the nucleus of different transcription factors able to bind to the gene. Interaction of diferric transferrin, bone morphogenetic proteins (BMPs), interleukin (IL)-6 and other inflammatory cytokines with cell surface receptors TfR1, TfR2, hemojuvelin (HJV) and IL-6 receptor lead to upregulation of the hepcidin gene through different and sometimes interacting signalling pathways. TMPRSS6, a plasma membrane serine protease, inhibits the HJV-BMP-SMAD signaling pathway by cleaving HJV from the surface of the cell, thus preventing overproduction of hepcidin and maintaining iron homeostasis.8,9 A soluble form of HJV (sHJV) produced within the cell by the enzyme furin and released into the plasma antagonizes and also inhibits this pathway.10
The mechanism of action of the HFE protein is less clear. HFE binds to both TfR1 and TfR2, decreasing the affinity of each for transferrin. Stabilization and endocytosis of TfR2 stimulates hepcidin production and there is evidence that diferric transferrin displaces the protein HFE from TfR1, leaving it free to interact with TfR2, thus stimulating hepcidin production in response to plasma iron levels.11–13
Increased erythropoiesis causes decreased hepcidin, increased iron absorption and increased iron availability for haemoglobin production. So far, two plasma antagonists of the BMP-HJV-SMAD pathway, GDF15 and TWSG1, produced by erythroid cells and associated with expanded ineffective erythropoiesis, have been found.14,15 Alteration of the function of key regulators leads to body iron overload or iron deficiency (see later). The extent and the manner in which these regulatory pathways vary between different tissues await further investigation.
Iron Storage
All cells require iron for the synthesis of proteins but have the ability also to store excess iron. There are two forms of storage iron: a soluble form, known as ferritin and insoluble haemosiderin.16 Ferritin consists of a spherical protein (molecular mass 480 000) enclosing a core of ferric-hydroxy-phosphate, which may contain up to 4000 atoms of iron. Haemosiderin is a denatured form of ferritin in which the protein shells have partly degraded, allowing the iron cores to aggregate. Haemosiderin deposits are readily visualized with the aid of the light microscope as areas of Prussian-blue positivity after staining of tissue sections with potassium ferrocyanide in acid (see Chapter 4). Ferritin is found in all cells and in the highest concentration in liver, spleen and bone marrow.
Regulation of Iron Metabolism
The expression of a number of iron proteins involved in both transport and storage is largely controlled posttranscriptionally by iron regulatory proteins (IRP1 and 2).4 The conformation of IRP1 required for binding to mRNA iron-responsive elements (IREs) and the turnover of IRP2 are directly affected by the amount of iron within a cell. Depending on where the target IRE elements are found these proteins may inhibit or enhance translation of many proteins involved in iron metabolism.
Plasma Iron Transport
Almost all the iron in plasma is tightly bound to transferrin, which is usually less than 50% saturated with iron. Transferrin, when incompletely saturated with iron, exists in four forms: apo, monoferric (iron bound at the ‘A’ site), monoferric (B) and diferric. The distribution may be determined by urea-polyacrylamide electrophoresis.17 Delivery to cells requires specific binding to transferrin receptors. The plasma iron pool (transferrin-bound iron) is about 3 mg, although the daily turnover is more than 10 times his amount. In addition, smaller amounts of iron are carried in the plasma by other proteins.
Haptoglobin is a serum glycoprotein that avidly binds haemoglobin αβ dimers released into the bloodstream by haemolysis. The haemoglobin–haptoglobin complex is rapidly removed from the plasma by a specific receptor, CD163, highly expressed on tissue macrophages.18
Hemopexin19 is a plasma glycoprotein of molecular mass approximately 60 kDa that binds haem and transports the haem to cells by a process that involves receptor-mediated endocytosis and recycling of the intact protein.
Low concentrations of ferritin are found in the plasma and ferritin concentrations in healthy subjects reflect body iron stores. Much of this ferritin appears to be glycosylated and has a relatively low iron content.20 Such ferritin has a half life (T½) of approximately 30 h. Ferritin is also released into the circulation as a result of tissue damage (most strikingly after necrosis of the liver). Tissue ferritin is cleared rapidly from the circulation (T½ in approximately 10 min) by the liver.
Non-transferrin-bound iron describes a form of iron that is not bound to transferrin, is of low molecular mass and can be bound by specific iron chelators.21 Several assays have been described that have demonstrated such a fraction in plasma from patients with iron overload. The chemical form of this iron is unknown, but it is probably rapidly removed from the circulation by the liver. Recent studies implicate the involvement of the zinc transporter ZIP14 in this process.22
Iron status
Normal iron status implies a level of erythropoiesis that is not limited by the supply of iron and the presence of a small reserve of ‘storage iron’ to cope with normal physiological needs. The ability to survive the acute loss of blood (iron) that may result from injury is also an advantage. The limits of normality are difficult to define and some argue that physiological normality is the presence of only a minimal amount of storage iron23 but the extremes (i.e. iron deficiency anaemia and haemochromatosis) are well understood.23a
Apart from too little or too much iron in the body, there is also the possibility of a maldistribution (Fig. 9.2). An example is anaemia associated with inflammation or infection where there is a partial failure of erythropoiesis and of iron release from the phagocytic cells in liver, spleen and bone marrow, which results in accumulation of iron as ferritin and haemosiderin in these cells. Determination of iron status requires an estimate of the amount of haemoglobin iron (usually by measuring the haemoglobin concentration (Hb) in the blood; see Chapter 3) and the level of storage iron (measuring serum ferritin concentration). Iron deficiency should be suspected in hypochromic, microcytic anaemia, but in the early stages of iron deficiency red cells may be normocytic and normochromic. Another feature of iron deficiency is an increased concentration of protoporphyrin in the red cells; normally, there is a small amount present, but defective haem synthesis caused by lack of iron results in the accumulation of zinc protoporphyrin and occasionally free protoporphyrin may be increased as well.24
Figure 9.2 Body iron content and distribution in different conditions. Additional assays are sometimes required. In genetic haemochromatosis, early iron accumulation is indicated by increased transferrin saturation alone. The serum ferritin concentration increases only later as the level of stored iron increases. In the anaemia of chronic disease, patients often have normal serum ferritin concentrations even when storage iron in the bone marrow is absent (see p. 336). In this situation, the assay of serum transferrin receptor may help detect tissue iron deficiency.
Disorders of iron metabolism
Clinical aspects of iron metabolism have been reviewed25–27 and are summarized in Table 9.2. A guideline on the management of genetic haemochromatosis is available.28
| Iron deficiency |
| Deficient iron intake |
| Diet of low bioavailability |
| Increased physiological requirements due to rapid growth in early childhood and in adolescence |
| Blood loss: physiological (e.g. menstruation) or pathological (e.g. gastrointestinal) |
| Malabsorption of iron intake |
| Reduced gastric acid secretion (e.g. after partial gastrectomy) |
| Reduced duodenal absorptive area (e.g. in coeliac disease) |
| Rare, inherited iron-refractory iron deficiency anaemia |
| TMPRSS6 deficiency |
| Redistribution of iron |
| Macrophage iron accumulation |
| Inflammatory, infectious or malignant diseases (‘anaemia of chronic disease’) |
| Iron overload |
| Due to increased iron absorption |
| e.g. Hereditary haemochromatosis – commonly homozygosity for HFE C282Y but sometimes involving other genes (HAMP,HJV,TFR2,SLC40A1) Substantial ineffective erythropoiesis (e.g. β thalassaemia syndromes of intermediate and major severity, some types of sideroblastic anaemia, congenital dyserythropoietic anaemia) Sub-Saharan iron overload (‘Bantu siderosis’) – only in combination with increased dietary iron Other rare inherited disorders (e.g. congenital atransferrinaemia, DMT1 deficiency) Inappropriate iron therapy (rare) |
| Due to multiple blood transfusions in refractory anaemias |
| e.g. Thalassaemia major |
| Aplastic anaemia |
| Myelodysplastic syndromes |
Methods for assessing iron status
The methods used to assess iron status are summarized in Table 9.3. Some are not generally applicable but have value in the standardization of indirect methods. The determinations of Hb and red cell indices are described in Chapter 3.
Serum Ferritin Assay
With the recognition that the small quantity of ferritin in human serum (15–300 μg/l in healthy men) reflects body iron stores, measurement of serum ferritin has been widely adopted as a test for iron deficiency and iron overload. The first reliable method to be introduced was an immunoradiometric assay in which excess radiolabelled antibody was reacted with ferritin and antibody not bound to ferritin was removed with an immunoadsorbent.31 This assay was supplanted by the two-site immunoradiometric assay, which is sensitive and convenient. Since then the principle of this assay has been extended to non-radioactive labelling, including enzymes (enzyme-linked immunosorbent assay or ELISA). Most current laboratory immunoassay systems for clinical laboratories include ferritin in the assay repertoire. Factors to be considered when selecting an immunoassay system are discussed later. The method described in the next section is an ELISA. The most sophisticated equipment required is a microtitre plate reader.
Immunoassay for Ferritin
Preparation and Storage of Ferritin
Ferritin may be prepared from iron-loaded human liver or spleen obtained at operation (spleen) or postmortem. The informed consent of the patient or the patient’s relatives should be obtained for use in preparation of ferritin. Tissue should be obtained as soon as possible after death and may be stored at −20°C for 1 year. The usual precautions must be taken to avoid the risk of infection when handling tissues and extracts. Ferritin is purified by methods that exploit its stability at 75°C. Further purification is obtained by precipitation from cadmium sulphate solution and gel-filtration chromatography.32 Purity should be assessed by polyacrylamide gel electrophoresis,33 and the protein content determined by the method of Lowry and colleagues, as described by Worwood.33 Buffered solutions of human ferritin may be stored at 4°C, at concentrations of 1–4 mg protein/ml, in the presence of sodium azide as a preservative, for up to 3 years. Such solutions should not be frozen. Ferritin, from human liver or spleen, may be obtained from several suppliers of laboratory reagents. This should be used as an assay standard only after calibration against the international standard (see p. 183).
Antibodies to Human Ferritin
High-affinity antibodies to human liver or spleen ferritin are suitable. Polyclonal antibodies may be raised in rabbits or sheep by conventional methods,34 and the titre checked by precipitation with human ferritin.33 An immunoglobulin G (IgG)-enriched fraction of antiserum is required for labelling with enzyme in the assay. The simplest method is to precipitate IgG with ammonium sulphate.35 Monoclonal antibodies that are specific for ‘L’ subunit-rich ferritin (liver or spleen ferritin) are also suitable. A mouse monoclonal antibody and a horseradish peroxidase (HRP)-labelled antibody are available from NIBSC (www.nibsc.ac.uk; codes 87/654 and 87/662). Suitable antibodies are available from commercial suppliers.
Conjugation of Antiferritin IgG Preparation to Horseradish Peroxidase36
Preparation and Storage of a Standard Ferritin Solution
Dilute a solution of human ferritin to approximately 200 μg/ml in water. Measure the protein concentration by the method of Lowry after diluting further to 20–50 μg/ml. Then dilute the ferritin solution (approx. 200 μg/ml) accurately to a concentration of 10 μg/ml in 0.05 mol/l sodium barbitone solution containing 0.1 mol/l NaCl, 0.02% NaN3 and BSA (5 g/l) and adjusted to pH 8.0 with HCl. Deliver 200 μl into 200 small polypropylene tubes, cap tightly and store at 4°C for up to 1 year. For use, dilute in Buffer B to 1000 ng/ml, then prepare a range of standard solutions between 0.2 and 25 ng/ml. Calibrate this working standard against the World Health Organization (WHO) standard for the assay of serum ferritin 94/572, recombinant human L type ferritin. (Information available at: www.nibsc.ac.uk.)
