[level-membership-for-pulmolory-and-respiratory-category]
Intrapulmonary Shunting and Deadspace
I Spectrum of Ventilation/Perfusion ( /
/ ) Abnormalities (Figure 8-1)
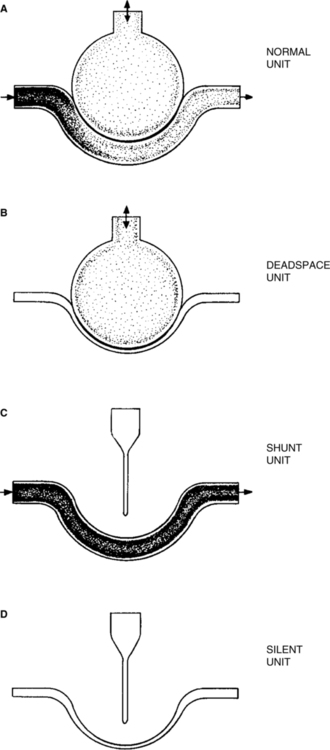
A Ideal alveolar-capillary unit: An alveolar-capillary unit in which perfusion and ventilation are normal; theoretically, a unit with a  /
/ ratio of 1.0.
B Deadspace unit: An alveolar-capillary unit in which ventilation is normal but perfusion is diminished or absent; a unit with a  /
/ ratio >1.0.
C Shunt unit: An alveolar-capillary unit in which perfusion is normal but ventilation is diminished or absent; a unit with a  /
/ ratio <1.0.
D Silent unit: An alveolar-capillary unit without perfusion or ventilation and therefore a  /
/ ratio of 0.0.
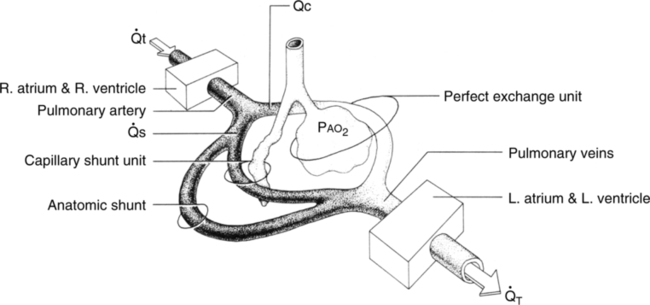
A A pathophysiologic process in which blood enters the left side of the heart without having been oxygenated by the lungs. The mixing of venous blood with oxygenated blood from the pulmonary capillaries to form arterial blood.
B The total quantity of shunted blood is the physiologic shunt, which is composed of three subdivisions (Figure 8-2).
 t is cardiac output per unit time;
  c is the portion of the cardiac output that exchanges perfectly with alveolar air;
  s is the portion of the cardiac output that does not exchange with alveolar air; and P
1. Anatomic shunt: The portion of the total cardiac output that bypasses the pulmonary capillary bed.
a. Normally approximately 2% to 5% of the cardiac output bypasses the pulmonary capillaries because the following veins empty into the left side of the heart:
2. Capillary shunt: The portion of the total cardiac output that perfuses nonventilated alveoli (Figure 8-3).
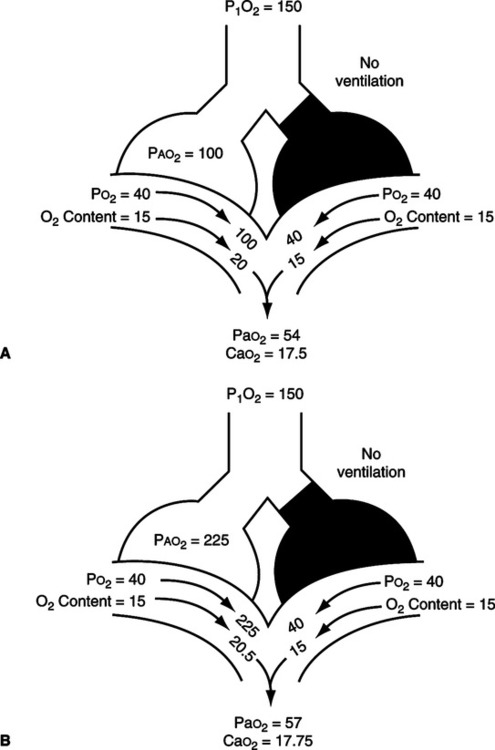
 /
/ as illustrated in Figure 8-4.
3. Shunt effect (ventilation/perfusion inequality, low  /
/ , venous admixture): Any pathophysiologic process in which perfusion is in excess of ventilation; however, some ventilation is still present (Figure 8-4).
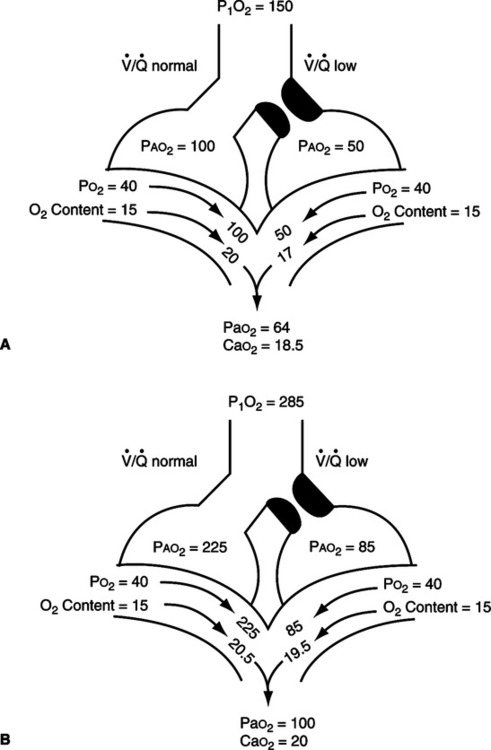
 /
/ mismatch showing the effect of supplemental O2.
  /
/ is normal on the left side of each idealized lung unit and low on the right. Only O2 exchange is shown, and the P(A-a)O2 is assumed to be zero. A, With room air, not enough O2 reaches the poorly ventilated alveolus to fully saturate its capillary blood. B, With 40% O2, Pao2 in this alveolus is increased enough to make its capillary PO2 nearly normal. Note that the Pao2 in the mixed blood from the two capillaries is determined by the average of the O2 contents of the two blood streams, not by their Pao2 values.
 /
/ ratios are <1.0.
III Derivation of Classic Shunt Equation
1.  o2: Volume of oxygen consumed per minute
 s: Shunted cardiac output
3.  c: Capillary cardiac output
 t: Total cardiac output
5. Cco2: Capillary oxygen content
6. Cao2: Arterial oxygen content
7. C o2: Mixed venous oxygen content
B The shunt equation is based on the Fick equation, which normally is used to calculate oxygen consumption or cardiac output:
< ?xml:namespace prefix = "mml" />
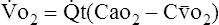 (1)
(1)C Because actual capillary blood flow ( c) represents the portion of the cardiac output that actually perfuses ventilated alveoli and Cco2 is the oxygen content of blood leaving those perfused and ventilated alveoli, this equation may be rewritten as:
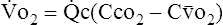 (2)
(2)D Thus total cardiac output is equal to shunted cardiac output plus capillary cardiac output:
 (3)
(3) c:
c: (4)
(4)F Substituting into equation 2 the equivalent of  o2 from equation 1:
 (5)
(5)G Substituting into equation 5 the equivalent of  c from equation 4:
 (6)
(6) (7)
(7)I Eliminating − tC
tC o2 from both sides of equation 7:
 tCao2 =
  tCco2 −
  Cco2 +
  sC
sC o2 (8)
 sCco2 −
  sC
sC o2 =
o2 =  tCco2 +
  tCao2 (9)
 s(Cco2 − C
 o2) =
o2) =  t(Cco2 − Cao2) (10)
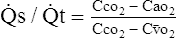 (11)
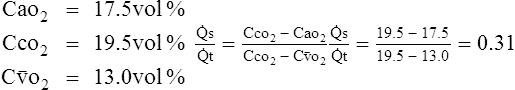
(11)M Equation 11 is the classic shunt equation, which states that the difference between the capillary oxygen content and arterial oxygen content divided by the difference between the capillary oxygen content and the mixed venous oxygen content equals the intrapulmonary shunt fraction.
N This equation is used to calculate the total physiologic shunt.
IV Calculation of the Total Physiologic (or Intrapulmonary) Shunt
A The intrapulmonary shunt is determined by calculating the capillary oxygen content, arterial oxygen content, and mixed venous oxygen content.
B All oxygen content determinations are based on the following equation:
C Calculation of the arterial oxygen content requires data from an arterial blood gas.
D Calculation of the mixed venous oxygen content requires data from a pulmonary artery blood gas.
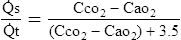
1. Because a blood sample from an ideally functioning alveolar-capillary unit is impossible to obtain, this calculation is based on the assumption that the end pulmonary capillary oxygen tension (Pco2) is equal to the alveolar oxygen tension (Pao2) in an ideally ventilated and perfused alveolar-capillary unit.
2. The Pao2 is obtained by calculation, using the ideal alveolar gas equation (see Chapter 5):
 (13)
(13)3. Hemoglobin content is the same as that measured in arterial blood or mixed venous blood.
V Estimated Intrapulmonary Shunt Calculation
A In patients without a pulmonary artery catheter, it is impossible to measure the C o2.
o2.
B However, in the majority of critically ill patients with cardiovascular stability, it has been determined that the Cao2 − C o2 is approximately 3.5 vol%.
C Thus in these patients 3.5 vol% may be used as an estimate of Cao2 − C o2.
o2.
D The denominator of the classic shunt equation may be expressed as follows:
 o2 = Cco2 − Cao2) + (Cao2 − C
 o2) (14)
E Because Cao2 − C o2 is estimated at 3.5 vol%, the denominator in equation 11 can be expressed as:
F The modified shunt equation used to estimate intrapulmonary shunt is:
 (16)
(16)G Equation 16 should be used only if pulmonary artery blood is unavailable and the patient is cardiovascularly stable.
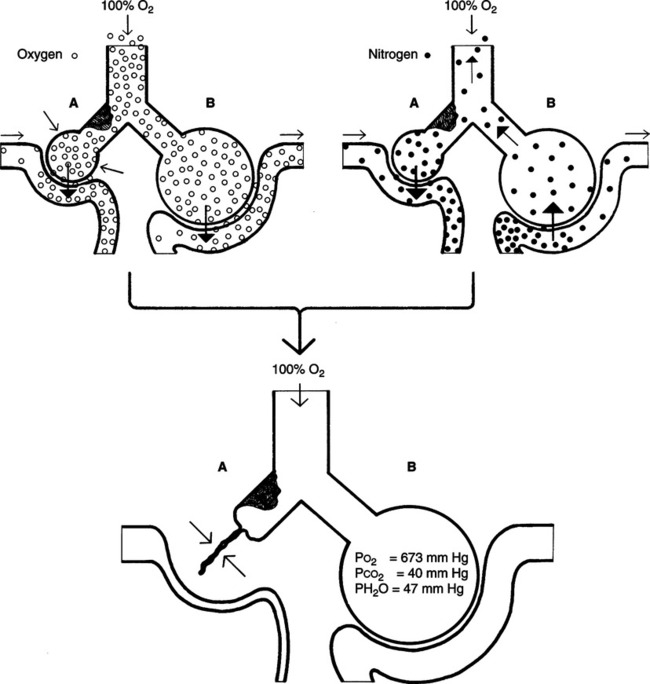
VI FIO2 Used to Calculate Percent Intrapulmonary Shunt
A Historically shunt fractions were determined at an FIO2 of 1.0.
B However, it has been demonstrated that the shunt fraction is increased at an FIO2 of 1.0.
1. Nitrogen washout atelectasis
a. Areas of the lung that are ventilated poorly tend to collapse if the nitrogen is removed.
b. Nitrogen normally maintains alveolar stability. When nitrogen is removed and replaced by oxygen, the blood absorbs the oxygen faster than it can be replaced because of the poor ventilation.
c. As a result, alveolar size decreases, eventually falling below its critical volume, and collapse occurs (Figure 8-5).
2. Redistribution of pulmonary blood flow
a. If an area of lung is poorly ventilated or not ventilated at all, the decreased Po2 in the area causes the pulmonary vasculature surrounding the alveoli to constrict.
b. This decreases blood flow to poorly ventilated areas and increases blood flow to areas more appropriately ventilated.
c. When a high FIO2 is administered, this autoregulatory mechanism is abated because the Po2 throughout the lung is elevated and capillaries that were previously constricted are now dilated.
d. This results in increased blood being shunted past nonventilated and poorly ventilated alveoli.
D Figure 8-6 represents the relationship between FIO2 and percent shunt. Clinically it appears that the lowest measured shunt occurs at approximately 50% oxygen.
 s/
s/ t) versus inspired oxygen concentration (FIO2) in normal and diseased lungs.
1. The percent shunt increases as the FIO2 decreases <0.5 because of the effect of venous admixture.
2. The percent shunt increases as the FIO2 increases >0.5 because of nitrogen washout atelectasis and redistribution of pulmonary blood flow.
E Percent intrapulmonary shunts should be calculated at the FIO2 the patient is maintained and at 100% oxygen so that the quantity of venous admixture contributing to the total shunt faction can be determined by the difference between the two.
VII Clinical Use of the Shunt Calculation
A Differentiating causes of hypoxemia
 /
/ mismatch): A decrease in local alveolar oxygen tension.
2. The numerator of the shunt equation, Cco2 − Cao2, can be considered a reflection of intrapulmonary pathology (i.e., hypoxemia of pulmonary origin will increase the Cco2 − Cao2 value, increasing the calculated shunt fraction).
3. The denominator in the shunt equation, Cco2 − Cao2, can be considered a reflection of the relationship of cardiac output to oxygen demand.
a. This is true because Cao2 − C o2 is contained in the denominator.
b. If hypoxemia is a result of cardiovascular pathology, it is primarily reflected in a widening of the Cco2 − C o2 but may not be accompanied by a proportional widening of the numerator.
4. Hypoxemia accompanied by an increased shunt measurement generally denotes an increase in intrapulmonary pathology.
5. Hypoxemia without a major increase in shunt fraction usually denotes cardiovascular causes of hypoxemia.
B Assessment of spontaneous ventilatory capabilities in patients being mechanically ventilated
1. An intrapulmonary shunt determination of <10% during mechanical ventilation is clinically comparable with normal lungs.
2. An intrapulmonary shunt determination of 10% to 19% should not represent sufficient pulmonary disease to interfere with spontaneous ventilation.
3. An intrapulmonary shunt of 20% to 30% may result in ventilatory failure in patients with central nervous system or cardiovascular dysfunction if spontaneous ventilation is attempted. However, many patients are able to sustain spontaneous ventilation with this level of shunt.
4. An intrapulmonary shunt of >30% represents a degree of pulmonary disease that normally requires aggressive cardiopulmonary support (i.e., increased positive end-expiratory pressure [PEEP], lung recruitment, fluid therapy, and prone positioning).
C Assessment of specific cardiopulmonary abnormalities
1. Performance of intrapulmonary shunt studies while a patient is in different positions may delineate the locale and extent of certain pulmonary pathology.
a. This is true because of the effects of gravity on pulmonary blood flow.
b. If the diseased area is gravity dependent, the percent intrapulmonary shunt is increased and may be a strong indication for prone positioning.
2. In the neonate the extent of right-to-left shunting is increased in the presence of the following congenital anomalies:
D Monitoring of oxygen and PEEP therapy
1. If the hypoxemia is of pulmonary origin and caused primarily by shunt effect, the appropriate application of oxygen therapy should demonstrate a decrease in intrapulmonary shunt.
2. If the hypoxemia is of pulmonary origin and caused primarily by capillary shunting of a generalized diffuse nature (e.g., acute respiratory distress syndrome [ARDS]), lung recruitment maneuvers, PEEP therapy, and prone positioning are primarily indicated, along with appropriate adjustment of FIO2.
3. However, the greater the percent intrapulmonary shunt, the less effect increasing FIO2 has on Pao2 (Figure 8-7).
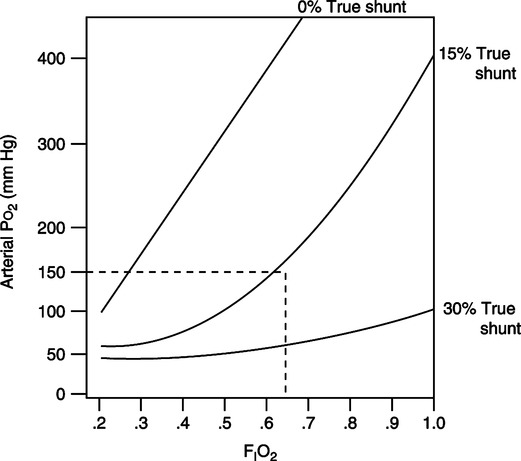
4. In patients with >30%  s/
s/ t, FIO2 of 1.0 may not increase the Po2 to a clinically acceptable level.
VIII Other Methods of Estimating Shunting and Oxygenation Status (Table 8-1)
TABLE 8-1
Methods of Calculating or Estimating Shunt
| Index | Normal Value | Abnormal Value | Limitations |
 s/ s/ t t |
2-5% | >10% | Invasive |
| P(A− a)O2 | 7-14 mm Hg (RA) | 100-150 at FIO2 1.0 | Varies with FIO2 |
| 31-56 mm Hg (1.0) | |||
| Pao2/PaO2 | >0.75 | <0.75 | —— |
| Pao2/FIO2 | 450-500 | <300-350 | Varies with Paco2 and FIO2 |
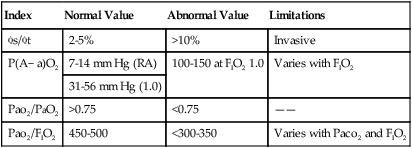
A Alveolar-arterial Po2 difference: P(A−a)o2
1. The P(A−a)o2 gradient has been used to estimate the percent intrapulmonary shunt.
2. The normal P(A−a)o2 when room air is breathed is 7 to 14 mm Hg.
3. However, at an FIO2 of 1.0, it increases to 31 to 56 mm Hg.
4. During 100% oxygen breathing, some estimate the shunt fraction as 1% for every 10 to 15 mm Hg of P(A−a)o2.
5. The fact that P(A−a)o2 exhibits variability with changes in FIO2 limits its usefulness as an indicator of overall cardiopulmonary function.
B Arterial-alveolar ratio: Pao2/Pao2
1. The lower limit of normal for Pao2/Pao2, regardless of FIO2, is ≥0.75.
2. The lower the Pao2/Pao2, the greater the cardiopulmonary abnormality.
3. Because Pao2/Pao2 is not affected by changes in FIO2, it is a more reliable index of abnormality than P(A−a)o2.
C Arterial-FIO2 ratio: Pao2/FIO2
1. The normal Pao2/FIO2 is approximately 450 to 500.
2. A Pao2/FIO2 <200 has been associated with a shunt fraction of >20%.
3. Paco2 and increasing FIO2 inversely affect the Pao2/FIO2.
4. As a result, it is a much cruder index of cardiopulmonary dysfunction than P(A−a)o2 or Pao2/Pao2.
5. The Pao2/FIO2 is the most commonly used index because it is easy to calculate.
A Pulmonary deadspace is the portion of the total ventilation that does not undergo external respiration.
B The total quantity of pulmonary deadspace is the physiologic deadspace and is composed of three subdivisions:
1. Anatomic deadspace: The portion of the total ventilation that does not contact the alveolar epithelium.
a. Normally the anatomic deadspace is equal to approximately 1.0 ml/lb of ideal body weight.
b. The relationship between anatomic deadspace and tidal volume is increased by small tidal volumes and rapid rates.
c. The absolute quantity of anatomic deadspace is increased by:
2. Alveolar deadspace: The portion of the total ventilation that contacts the alveolar epithelium but does not participate in gas exchange because of a lack of pulmonary capillary blood flow (Figure 8-8).
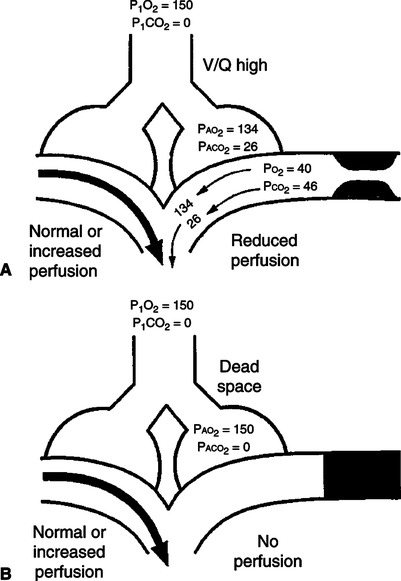
 /
/ and (B) alveolar deadspace. Areas of high
  /
/ experience alveolar hyperventilation, and capillary blood leaves them with higher Pao2 and lower PaCO2 than in the normal units. Because these areas are poorly perfused, they impair the efficiency of overall gas exchange. When some alveoli are not perfused at all (alveolar deadspace), their ventilation is wasted, and overall ventilation must be increased to maintain normal CO2 elimination.
a. Alveolar deadspace accounts for a small amount of the total physiologic deadspace in the healthy individual.
3. Deadspace effect (ventilation/perfusion inequality): Any pathophysiologic process in which ventilation is in excess of perfusion but some perfusion does exist (i.e.,  /
/ ratio >1.0) (see Figure 8-8).
X Derivation of the Deadspace Equation
4. Faco2: Fractional concentration of Co2 in alveolar gas
5. FĒco2: Mean fractional concentration of Co2 in mixed expired gas
6. Paco2: Partial pressure of arterial Co2
B Tidal volume is equal to deadspace volume plus alveolar volume.
C The total volume of Co2 in exhaled gas is equal to Vt times the fractional concentration of Co2 in the exhaled gas.
D This volume can be subdivided into the amount of Co2 exhaled from deadspace and alveoli:
E Because the concentration of Co2 in exhaled deadspace gas is approximately zero, equation 19 can be rewritten as:
F Because Va = Va − Vd, equation 20 may be rewritten as:
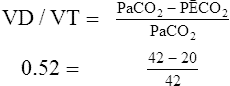
G By rearrangement of and simplification of equation 21, the Bohr equation for the determination of the deadspace/tidal volume ratio (Vd/Vt ratio) is generated.
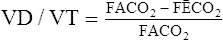 (22)
(22)H Because the concentration of Co2 in the alveoli is equal to the concentration of Co2 in the arterial blood and because the partial pressures of gases are proportional to their concentration, equation 22 may be rewritten as the Enghoff modification of the Bohr equation:
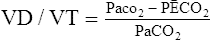 (23)
(23)I In all circumstances, as the deadspace increases, there is a widening of the Paco2 − PĒco2 gradient.
XI Calculation of the Deadspace/Tidal Volume Ratio
A A simultaneous sampling of arterial blood and exhaled gas is obtained.
1. The exhaled gas sample must be large enough to reflect a mean exhaled Pco2 value.
2. In spontaneously breathing patients, approximately 40 L of exhaled gas is collected. This is done to compensate for tidal volume variations.
3. If a patient is being mechanically ventilated without spontaneous efforts with consistent tidal volumes, a 5-L sample is sufficient.
B The patient should be stable and quiet at the time the sample is obtained.
XII Minute Volume–Paco2 Relationship
A Because the arterial Paco2 level clinically defines the physiologic adequacy of ventilation, a relationship between total minute volume and arterial Paco2 must exist.
B In the average adult, a minute volume of 4 to 6 L maintains a Paco2 of 40 mm Hg.
C If the minute volume increases, the Paco2 should decrease, and if the minute volume decreases, the Paco2 should increase.
D It is generally accepted that with each doubling of the minute volume, the Paco2 decreases by approximately 10 mm Hg (Table 8-2).
TABLE 8-2
Normal Minute Volume–Paco2 Relationship
| VA(L/min) | Paco2 (mm Hg) |
| 1.25 | 60 |
| 2.50 | 50 |
| 5.00 | 40 |
| 10.00 | 30 |
| 20.00 | 20 |
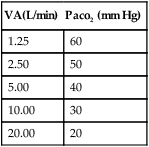
E If there is a disparity between the minute volume and the expected Paco2, deadspace is most probably increased.
XIII Clinical Use of the Deadspace/Tidal Volume Ratios
A Assessment of spontaneous ventilatory capabilities in patients being mechanically ventilated
1. The Vd/Vt ratio is typically increased during mechanical ventilation and is considered normal up to 0.50.
2. A Vd/Vt ratio <0.60 normally does not represent pulmonary pathology of sufficient magnitude to interfere with spontaneous ventilation.
3. A Vd/Vt ratio of 0.60 to 0.80 represents significant disease and frequently interferes with an individual’s ability to maintain prolonged spontaneous ventilation.
4. A Vd/Vt ratio >0.80 normally requires mechanical ventilatory support.
XIV Guidelines for Differentiating Shunt-Producing From Deadspace-Producing Diseases
A Deadspace-producing diseases
1. Minute volume greatly increased with little or no decrease in Paco2.
2. Although hypoxemia is present and correctable by oxygen therapy, minute ventilation changes are minimal when hypoxemia is corrected.
1. Paco2 decreases as minute volume increases.
2. Assuming the hypoxemia is responsive, oxygen therapy will decrease myocardial and ventilatory work and relieve hypoxemia. Thus minute volume and Paco2 return to normal.
3. If hypoxemia is refractory, caused by true shunting, the application of PEEP or prone positioning is necessary to reverse the hypoxemia.
[/level-membership-for-pulmolory-and-respiratory-category][not-level-membership-for-pulmolory-and-respiratory-category]
Intrapulmonary Shunting and Deadspace
I Spectrum of Ventilation/Perfusion (/) Abnormalities (Figure 8-1)
A Ideal alveolar-capillary unit: An alveolar-capillary unit in which perfusion and ventilation are normal; theoretically, a unit with a / ratio of 1.0.
B Deadspace unit: An alveolar-capillary unit in which ventilation is normal but perfusion is diminished or absent; a unit with a / ratio >1.0.
C Shunt unit: An alveolar-capillary unit in which perfusion is normal but ventilation is diminished or absent; a unit with a / ratio <1.0.
D Silent unit: An alveolar-capillary unit without perfusion or ventilation and therefore a / ratio of 0.0.
A A pathophysiologic process in which blood enters the left side of the heart without having been oxygenated by the lungs. The mixing of venous blood with oxygenated blood from the pulmonary capillaries to form arterial blood.
B The total quantity of shunted blood is the physiologic shunt, which is composed of three subdivisions (Figure 8-2).
1. Anatomic shunt: The portion of the total cardiac output that bypasses the pulmonary capillary bed.
a. Normally approximately 2% to 5% of the cardiac output bypasses the pulmonary capillaries because the following veins empty into the left side of the heart:
2. Capillary shunt: The portion of the total cardiac output that perfuses nonventilated alveoli (Figure 8-3).
/ as illustrated in Figure 8-4.3. Shunt effect (ventilation/perfusion inequality, low /, venous admixture): Any pathophysiologic process in which perfusion is in excess of ventilation; however, some ventilation is still present (Figure 8-4).
III Derivation of Classic Shunt Equation
1. o2: Volume of oxygen consumed per minute
3. c: Capillary cardiac output
5. Cco2: Capillary oxygen content
6. Cao2: Arterial oxygen content
7. Co2: Mixed venous oxygen content
B The shunt equation is based on the Fick equation, which normally is used to calculate oxygen consumption or cardiac output:
< ?xml:namespace prefix = "mml" />
(1)C Because actual capillary blood flow (c) represents the portion of the cardiac output that actually perfuses ventilated alveoli and Cco2 is the oxygen content of blood leaving those perfused and ventilated alveoli, this equation may be rewritten as:
(2)D Thus total cardiac output is equal to shunted cardiac output plus capillary cardiac output:
(3) (4)F Substituting into equation 2 the equivalent of o2 from equation 1:
(5)G Substituting into equation 5 the equivalent of c from equation 4:
(6) (7)I Eliminating −tCo2 from both sides of equation 7:
tCao2 = tCco2 − Cco2 + sCo2 (8)sCco2 − sCo2 = tCco2 + tCao2 (9)s(Cco2 − Co2) = t(Cco2 − Cao2) (10) (11)M Equation 11 is the classic shunt equation, which states that the difference between the capillary oxygen content and arterial oxygen content divided by the difference between the capillary oxygen content and the mixed venous oxygen content equals the intrapulmonary shunt fraction.
N This equation is used to calculate the total physiologic shunt.
IV Calculation of the Total Physiologic (or Intrapulmonary) Shunt
A The intrapulmonary shunt is determined by calculating the capillary oxygen content, arterial oxygen content, and mixed venous oxygen content.
B All oxygen content determinations are based on the following equation:
C Calculation of the arterial oxygen content requires data from an arterial blood gas.
D Calculation of the mixed venous oxygen content requires data from a pulmonary artery blood gas.
1. Because a blood sample from an ideally functioning alveolar-capillary unit is impossible to obtain, this calculation is based on the assumption that the end pulmonary capillary oxygen tension (Pco2) is equal to the alveolar oxygen tension (Pao2) in an ideally ventilated and perfused alveolar-capillary unit.
[/not-level-membership-for-pulmolory-and-respiratory-category]
