12 Intraoperative Transesophageal Echocardiography
Few areas in cardiac anesthesia have developed as rapidly as the field of intraoperative echocardiography. In the early 1980s, when transesophageal echocardiography (TEE) was first used in the operating room, its main application was the assessment of global and regional left ventricular (LV) function. Since that time, there have been numerous technical advances: biplane and multiplane probes; multifrequency probes; enhanced scanning resolution; color–flow Doppler (CFD), pulsed-wave (PW) Doppler, and continuous-wave (CW) Doppler; automatic edge detection; Doppler tissue imaging (DTI); three-dimensional (3D) reconstruction; and digital image processing. With these advances, the number of clinical applications of TEE has increased markedly. The common applications of TEE include: (1) assessment of valvular anatomy and function, (2) evaluation of the thoracic aorta, (3) detection of intracardiac defects, (4) detection of intracardiac masses, (5) evaluation of pericardial effusions, (6) detection of intracardiac air and clots, (7) assessment of biventricular systolic and diastolic function, and (8) evaluation of myocardial ischemia and regional wall motion abnormalities (RWMAs). In many of these evaluations, TEE is able to provide unique and critical information that previously was not available in the operating room (Box 12-1).
Basic concepts

Properties of Ultrasound
An ultrasound beam is a continuous or intermittent train of sound waves emitted by a transducer or wave generator. It is composed of density or pressure waves and can exist in any medium with the exception of a vacuum (Figure 12-1). Ultrasound waves are characterized by their wavelength, frequency, and velocity.1 Wavelength is the distance between the two nearest points of equal pressure or density in an ultrasound beam, and velocity is the speed at which the waves propagate through a medium. As the waves travel past any fixed point in an ultrasound beam, the pressure cycles regularly and continuously between a high and a low value. The number of cycles per second (Hertz) is called the frequency of the wave. Ultrasound is sound with frequencies above 20,000 Hz, which is the upper limit of the human audible range. The relationship among the frequency (f), wavelength (λ), and velocity (v) of a sound wave is defined by the following formula:
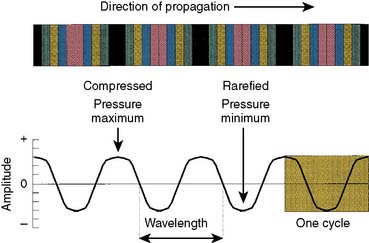
Figure 12-1 A sound wave is a series of compressions and rarefactions.
(From Thys DM, Hillel Z: How it works: Basic concepts in echocardiography. In Bruijn NP, Clements F [eds]: Intraoperative use of echocardiography. Philadelphia: JB Lippincott, 1991.)

Ultrasound waves transport energy through a given medium; the rate of energy transport is expressed as “power,” which is usually expressed in joules per second or watts.1 Because medical ultrasound usually is concentrated in a small area, the strength of the beam usually is expressed as power per unit area or “intensity.” In most circumstances, intensity usually is expressed with respect to a standard intensity. For example, the intensity of the original ultrasound signal may be compared with the reflected signal. Because ultrasound amplitudes may vary by a factor of 105 or greater, amplitudes usually are expressed using a logarithmic scale. The usual unit for intensity comparisons is the decibel, which is defined as:
where I1 is the intensity of the wave to be compared and I0 is the intensity of the reference waves.

Ultrasound Beam

where Fn is the near-field length, D is the diameter of the transducer, and λ is the ultrasound wavelength. Increasing the frequency of the ultrasound increases the length of the near field. In this near field, most energy is confined to a beam width no greater than the transducer diameter. Long Fresnel zones are preferred with medical ultrasonography, which may be achieved with large-diameter transducers and high-frequency ultrasound. The angle of the “far-field” convergence (θ) is directly proportional to the wavelength and inversely proportional to the diameter of the transducer and is expressed by the equation:


Attenuation, Reflection, and Scatter

where Ir is intensity reflection coefficient, and Z1 and Z2 are acoustical impedance of the two media.
Attenuation refers to the loss of ultrasound power as it transverses tissue. Tissue attenuation is dependent on ultrasound reflection, scattering, and absorption. The greater the ultrasound reflection and scattering, the less ultrasound energy is available for penetration and resolution of deeper structures; this effect is especially important during scanning with higher frequencies. In normal circumstances, however, absorption is the most significant factor in ultrasound attenuation.2 Absorption occurs as a result of the oscillation of tissue caused by the transit of the ultrasound wave. These tissue oscillations result in friction, with the conversion of ultrasound energy into heat. More specifically, the transit of an ultrasound wave through a medium causes molecular displacement. This molecular displacement requires the conversion of kinetic energy into potential energy as the molecules are compressed. At the time of maximal compression, the kinetic energy is maximized and the potential energy minimized. The movement of molecules from their compressed location to their original location requires conversion of this potential energy back into kinetic energy. In most cases, this energy conversion (either kinetic into potential energy or vice versa) is not 100% efficient and results in energy loss as heat.1
where a is the attenuation coefficient in decibels (dB) per centimeter at 1 MHz, and freq represents the ultrasound frequency in megahertz (MHz).
Examples of attenuation coefficient values are given in Table 12-1. Whereas water, blood, and muscle have low ultrasound attenuation, air and bone have very high tissue ultrasound attenuation, limiting the ability of ultrasound to transverse these structures. Table 12-2 gives the distance in various tissues at which the intensity or amplitude of an ultrasound wave of 2 MHz is halved (the half-power distance).
| Material | Coefficient (dB/cm/MHz) |
|---|---|
| Water | 0.002 |
| Fat | 0.66 |
| Soft tissue | 0.9 |
| Muscle | 2 |
| Air | 12 |
| Bone | 20 |
| Lung | 40 |
TABLE 12-2 Half-Power Distances at 2 MHz
| Material | Half-Power Distance (cm) |
|---|---|
| Water | 380 |
| Blood | 15 |
| Soft tissue (except muscle) | 1–5 |
| Muscle | 0.6–1 |
| Bone | 0.2–0.7 |
| Air | 0.08 |
| Lung | 0.05 |
Imaging techniques


Harmonic Imaging
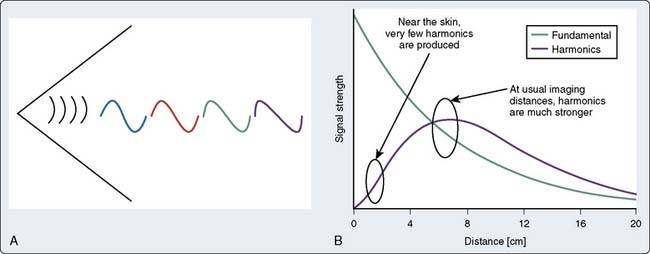
Harmonic frequencies are ultrasound transmission of integer multiples of the original frequency. For example, if the fundamental frequency is 4 MHz, the second harmonic is 8 MHz, the third fundamental is 12 MHz, and so on. Harmonic imaging refers to a technique of B-mode imaging in which an ultrasound signal is transmitted at a given frequency but will “listen” at one of its harmonic frequencies.3,4 As ultrasound is transmitted through a tissue, the tissue undergoes slight compressions and expansions that correspond to the ultrasound wave temporarily changing the local tissue density. Because the velocity of ultrasound transit is directly proportional to density, the peak amplitudes will travel slightly faster than the trough. This differential velocity transit of the peak with the trough wave results in distortion of the propagated sine wave, resulting in a more peaked wave. This peaked wave will contain frequencies of the fundamental frequency, as well as the harmonic frequencies (Figure 12-2). Although little distortion occurs in the near field, the amount of energy contained within these harmonics increases with ultrasound distance transversed as the ultrasound wave becomes more peaked. Eventually, the effects of attenuation will be more pronounced on these harmonic waves with subsequent decrease in harmonic amplitude. Because the effects of attenuation are greatest with high-frequency ultrasound, the second harmonic usually is used.

Doppler Techniques
The Doppler Effect
Information on blood flow dynamics can be obtained by applying Doppler frequency shift analysis to echoes reflected by the moving red blood cells.5,6 Blood flow velocity, direction, and acceleration can be instantaneously determined. This information is different from that obtained in 2D imaging, and hence complements it.

where v = the target velocity (blood flow velocity); c = the speed of sound in tissue; fd = the frequency shift; f0 = the frequency of the emitted ultrasound; and θ = the angle between the ultrasound beam and the direction of the target velocity (blood flow). Rearranging the terms,

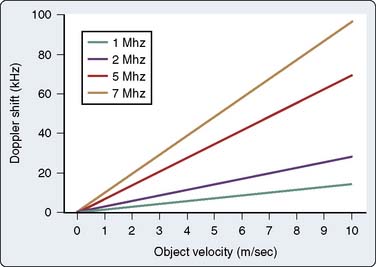
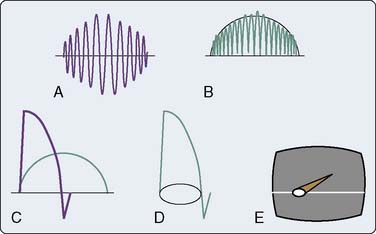
As is evident in Equation 8, the greater the velocity of the object of interest, the greater the Doppler frequency shift. In addition, the magnitude of the frequency shift is directly proportional to the initial emitted frequency (Figure 12-3). Low emitted frequencies produce low Doppler frequency shifts, whereas higher emitted frequencies produce high Doppler frequency shifts. This phenomenon becomes important with aliasing, as is discussed later in this chapter. Furthermore, the only ambiguity in Equation 7 is that theoretically the direction of the ultrasonic signal could refer to either the transmitted or the received beam; however, by convention, Doppler displays are made with reference to the received beam; thus, if the blood flow and the reflected beam travel in the same direction, the angle of incidence is zero degrees and the cosine is +1. As a result, the frequency of the reflected signal will be higher than the frequency of the emitted signal.
Pulsed-Wave Doppler

The trade-off for the ability to measure flow at precise locations is that ambiguous information is obtained when flow velocity is very high. Information theory suggests that an unknown periodic signal must be sampled at least twice per cycle to determine even rudimentary information such as the fundamental frequency; therefore, the rate of PRF of PW Doppler must be at least twice the Doppler-shift frequency produced by flow.7 If not, the frequency shift is said to be “undersampled.” In other words, this frequency shift is sampled so infrequently that the frequency reported by the instrument is erroneously low.1

The expression fs/2 is also known as the Nyquist limit. Doppler shifts above the Nyquist limit will create artifacts described as “aliasing” or “wraparound,” and blood-flow velocities will appear in a direction opposite to the conventional one (Figure 12-4). Blood flowing with high velocity toward the transducer will result in a display of velocities above and below the baseline. The maximum velocity that can be detected without aliasing is dictated by:

where Vm = the maximal velocity that can be unambiguously measured; c = the speed of sound in tissue; R = the range or distance from the transducer at which the measurement is to be made; and f0 = the frequency of emitted ultrasound.
Based on Equation 11, this “aliasing” artifact can be avoided by either minimizing R or f0. Decreasing the depth of the sample volume in essence increases fs. This higher sampling frequency allows for the more accurate determination of higher Doppler shifts frequencies (i.e., higher velocities). Furthermore, because fo is directly related to fd (see Eq. 7), a lower emitted ultrasound frequency will produce a lower Doppler frequency shift for a given velocity (see Figure 12-3). This lower Doppler frequency shift will allow for a higher velocity measurement before aliasing occurs.
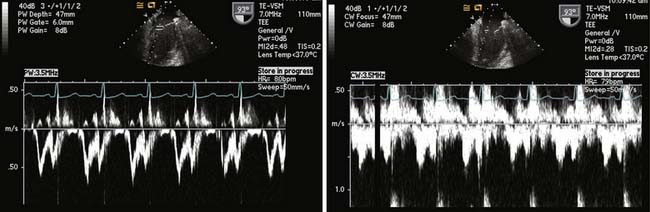
Continuous-Wave Doppler
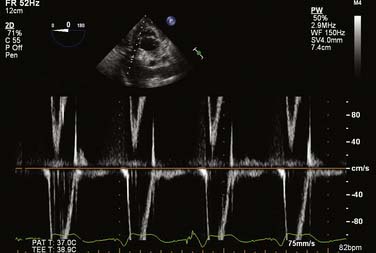
The CW Doppler technique uses continuous, rather than discrete, pulses of ultrasound waves. Ultrasound waves are continuously being both transmitted and received by separate transducers. As a result, the region in which flow dynamics are measured cannot be precisely localized. Because of the large range of depths being simultaneously insonated, a large range of frequencies is returned to the transducer. This large frequency range corresponds to a large range of blood-flow velocities. This large velocity range is known as “spectral broadening.” Spectral broadening during CW Doppler interrogation contrasts the homogenous envelope that is obtained with PW Doppler (Figure 12-5). Blood-flow velocity is, however, measured with great accuracy even at high flows because sampling frequency is very high. CW Doppler is particularly useful for the evaluation of patients with valvular lesions or congenital heart disease (CHD), in whom anticipated high-pressure/high-velocity signals are anticipated. It also is the preferred technique when attempting to derive hemodynamic information from Doppler signals (Box 12-2).
Color-Flow Doppler
Advances in electronics and computer technology have allowed the development of CFD ultrasound scanners capable of displaying real–time blood flow within the heart as colors while also showing 2D images in black and white. In addition to showing the location, direction, and velocity of cardiac blood flow, the images produced by these devices allow estimation of flow acceleration and differentiation of laminar and turbulent blood flow. CFD echocardiography is based on the principle of multigated PW Doppler in which blood-flow velocities are sampled at many locations along many lines covering the entire imaging sector.8 At the same time, the sector also is scanned to generate a 2D image.

Three-Dimensional Reconstruction
Echocardiography has become a vital tool in the practice of contemporary cardiac anesthesiology. As with any technology, a considerable evolution has occurred since it was first introduced into the operating rooms in the early 1980s. Among the most important advances has been the progression from one-dimensional (1D; e.g., M-mode) imaging to 2D imaging, as well as spectral Doppler and real-time color-flow mapping superimposed over a 2D image. The heart, however, remains a 3D organ. Although multiplane 2D images can be acquired easily with modern TEE probes by simply rotating the image plane electronically from 0 to 180 degrees, the final process occurs by the echocardiographer stitching the different 2D planes together and creating a “mental” 3D image. Transmitting this “mental” image to other members of the surgical team can sometimes be quite challenging. By directly displaying a 3D image onto the monitor, cardiac anatomy and function could be assessed more rapidly and communication between the echocardiographer and the cardiac surgeon facilitated before, during, and immediately after surgery.9
Historic Overview
Early concepts of 3D echocardiography (3DE) found their roots in the 1970s.10 Because of the limitations of hardware and software capabilities in that era, the acquisition times required to create a 3D image prohibited widespread clinical acceptance, limiting its use for research purposes only. Technologic advances in the 1990s enabled 3D reconstruction from multiple 2D images obtained from different imaging planes. By capturing an image every 2 to 3 degrees as the probe rotated 180 degrees around a specific region of interest (ROI), high-powered computers were able to produce a 3D image, which could be refined further with postprocessing software. These multigated image planes must be acquired under electrocardiographic and respiratory gating to overcome motion artifact. The limitations of this technology are the time required to process and optimize the 3D image and the inability to obtain instantaneous, real-time imaging of the heart.
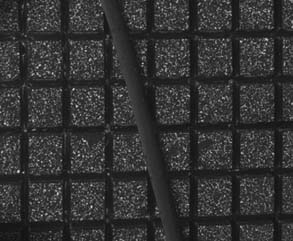
In 2007, a real-time 3D TEE probe with a matrix array of piezo-electric crystals within the transducer head was released on the market. This 3D imaging matrix array, as opposed to conventional 2D imaging transducers, not only has columns in a single 1D plane but also rows of elements. That is, instead of having a single column of 128 elements, the matrix array comprises more than 50 rows and 50 columns of elements (Figure 12-6). Although this “matrix” technology was available for transthoracic (precordial) scanning, a breakthrough in engineering design was required before the technology could be transitioned into the limited space of the head of a TEE probe.
Display of Three-Dimensional Images
Narrow Sector (Live 3D)—Real Time
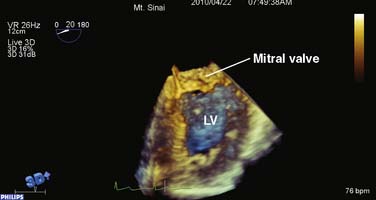
In this mode, a 3D volume pyramid is obtained. The image shown in this mode is real time. The 3D image changes as the transducer is moved just as in live 2D imaging. Manipulations of the TEE probe (e.g., rotation, change in position) lead to instantaneous changes in the image seen on the monitor (Figure 12-7).
Wide Sector Focused (3D Zoom)—Real Time
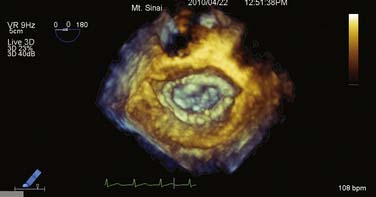
If only a specific ROI requires imaging, the “zoom mode” can be used in a similar fashion as in 2DE. A typical example for this mode would be the mitral valve (MV) apparatus. The 3D zoom mode displays a small magnified pyramidal volume that may vary from 20 × 20 degrees up to 90 × 90 degrees, depending on the density setting. This small data set can be spatially orientated at the discretion of the echocardiographer. A key advantage to this mode is the fact that the real-time 3D images are devoid of rotational artifacts, as are commonly encountered with electrocardiogram (ECG)-gated 3D acquisitions (Figure 12-8).
Large Sector (Full Volume)—Gated
Because of insufficient time for sound to travel back and forth in large volumes while maintaining a frame rate greater than 20 Hz and reasonable resolution in live scanning modes, one maneuver to overcome this limitation entails stitching four to eight gates together to create a “full-volume” mode. These gated “slabs” or “subvolumes” represent a pyramidal 3D dataset as would be acquired in the live 3D mode. This technique can generate more than 90-degree scanning volumes at frame rates greater than 30 Hz. Increasing the gates from four to eight creates smaller 3D slabs; this can be used to maintain frame rates and/or resolution as the volumes (pyramids) become larger (Figure 12-9).
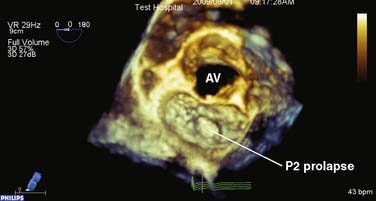
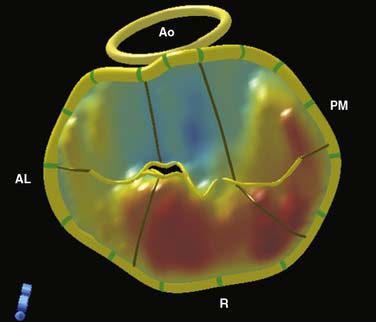
Figure 12-9 Full-volume mode acquisition of the mitral valve from the left atrial perspective.
Although the sector size is similar to Figure 12-8, note the improvement in temporal resolution as a consequence of the four-beat acquisition (9 vs. 29 Hz). This mode does not permit instantaneous “live” imaging. AV, aortic valve.
Unfortunately, as with any conventional gating technique, patients with arrhythmias are prone to motion artifacts when the individual datasets are combined; however, as long as the RR intervals fall within a reasonable range, a full-volume dataset still can be reconstructed (e.g., atrial fibrillation, electrocautery artifact). The acquired real-time 3D dataset subsequently can be cropped, analyzed, and quantified using integrated software in the 3D operating system (QLAB; Philips Healthcare, Andover, MA; Figure 12-10).
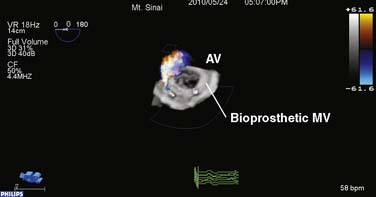
Three-dimensional Color Doppler—Gated
Because of the large amount of data that must be acquired with 3D color Doppler mode, a gating method must be utilized similar to that of the full-volume mode; however, because of the large amount of data required, 8 to 11 beats need to be combined to create an image. Jet direction, extent, and geometry easily can be recognized using this technique. Reports started emerging in the late 1990s showing that the strength of this methodology lies in its ability to quantitate severity of regurgitant lesions; 3D quantification of mitral regurgitation correlates better than 2D imaging, when using angiography as the gold standard.11 In an experimental setting, 3D quantification was more accurate (2.6% underestimation) than 2D or M-mode methods, which had the tendency to underestimate regurgitant volumes (44.2% and 32.1%, respectively; Figure 12-11).12
Right Ventricle
The right ventricle is a complex, crescent-shaped structure that does not lend itself easily to geometric assumptions as its LV counterpart and has been the Achilles heel to 2D imaging. Because of the fact that numerous reports have linked right ventricular (RV) function to prognostic outcome in a variety of cardiopulmonary diseases, it would be of great interest to quantify its function echocardiographically.13
A preliminary report showed that 3DE marginally underestimated RV volumes when compared with cardiac magnetic resonance, and that correlation to cardiac magnetic resonance–measured volumes was as good as that obtained by cardiac computed tomography.14 Further research in this field will undoubtedly lead to increased understanding of perioperative RV function.

Contrast Echocardiography
Gramiak and Shah15 originally reported the use of contrast echocardiography in 1969. They described visualization of aortic valve (AV) incompetence during left-heart catheterization15 (Box 12-3). Subsequently, contrast echocardiography has been used to image intracardiac shunts,16 valvular incompetence,17 and pericardial effusions.18 In addition, LV injections of hand-agitated microbubble solutions have been used to identify semiquantitative LV endocardial edges,19 cardiac output,20 and valvular regurgitation.21
BOX 12-3 Diagnostic Applications for Contrast Echocardiography
More modern contrast agents have improved the shell surrounding the microbubble, as well as modification of the gas. The shell must inhibit the diffusion of gas into the blood and must enhance the pressure that a microbubble can tolerate before dissolving.22 Gases with low shell diffusivity and blood saturation concentration result in a microbubble of increased survival because the gas would rapid equilibrate with blood, and the gas would tend to stay within the shell. Improvements in the shell both increase the tolerance of the microbubble to ultrasound energies and decrease the diffusion of the gas into the blood; both changes further increase the persistence of the microbubbles. At the same time, there must be an element of fragility; the microbubbles must be disrupted by ultrasound signals producing appropriate imaging effects. The use of high-molecular-weight and less-soluble gases further increases the persistence of the contrast agents. Currently, the perfluorocarbons are the most common gases used in contrast agents. The microbubbles need to be small enough to transverse the pulmonary circulation with a predominant size particle that approached the size of an erythrocyte. The number of larger particles needs to be minimized to reduce the risk for obstruction of pulmonary capillary flow. Because the reflected energy of contrast agents is high, attenuation of the ultrasound signal is common. This signal attenuation interferes with visualization of distal structures.
An ultrasound signal produces compression and rarefaction (expansion) of the medium through which it travels. When this compression and rarefaction impact a microbubble, the bubble is compressed and expanded, respectively.23 These changes result in changes in the bubble volume, causing bubble vibrations with subsequent effects on the returning ultrasound signal. These bubble pulsations may result in changes in the bubble radius by a factor of 20 or more.24
The acoustic properties of these microbubbles depend on the amplitude of the ultrasound signal. The amplitude of an ultrasound signal usually is defined by its mechanical index, which is the peak negative pressure divided by the square root of the ultrasound frequency. Normally, when bubbles are insonated by ultrasound at their intrinsic resonant frequency, they vibrate; during the peak of the signal, they are compressed, and at the nadir of the signal, they expand. An ideal bubble would oscillate at the insonated ultrasound frequency.25 At low ultrasound amplitudes (mechanical index < 0.1), the microbubbles oscillate at the frequency of the insonated signal with the degree of compression being equal to the degree of expansion. This is called linear oscillation. With fundamental imaging, no special contrast echo signals are produced.26 With increasing signal amplitudes (mechanical index, 0.1 to 0.7), the degree of expansion exceeds the degree of compression, which results in nonlinear oscillations. These nonlinear oscillations result in the creation of ultrasound waves at harmonic frequencies of the delivered ultrasound waves. Although some bubble destruction will occur at all amplitudes, further increases in ultrasound amplitude (mechanical index, 0.8 to 1.9) result in more compression and expansion with subsequent extensive bubble destruction. This bubble destruction, called scintillation, results in a brief but high output signal appearing as swirling. Because of the extensive bubble destruction, intermittent imaging must be performed to allow contrast replenishment. The role of most contrast imaging modalities is to create and display these nonlinear components while suppressing the linear echoes from tissue and tissue motion.27
Further improvements in image acquisition can be achieved using harmonic imaging.24 As explained previously, nonlinear oscillations result in the creation of harmonics. It was theorized that if the receiver was tuned to receive the first harmonic of the transmitted ultrasound signal, the signal-to-noise ratio can be improved by predominantly imaging signals from the microbubbles producing these harmonics. Because tissues also produce harmonics, tissue grayscale imaging also was enhanced. Further improvements may include subharmonic and ultraharmonic imaging, which may provide more specific contrast enhancement. Harmonic imaging with TEE improves endocardial visualization and allows partial assessment of myocardial perfusion.28 Harmonic-power Doppler is more sensitive for detecting basilar perfusion in the far field compared with harmonic grayscale imaging.29
The safety of contrast echocardiography must be considered. The contrast agents themselves must have a high therapeutic index. Multiple large bubbles may obstruct pulmonary microcirculation. The disruption of microbubbles by high-amplitude ultrasound may rupture capillaries and injure surrounding tissue.30 Rare allergic and life-threatening anaphylactic/anaphylactoid reactions occur at a rate of approximately 1 per 10,000.27 Premature ventricular contractions have been described during high-intensity triggered imaging.31 Other investigators were not able to demonstrate an increase in premature ventricular complex occurrence during or after imaging with triggered ultrasound at a mechanical index of 1.32 Contraindications to the use of perflutren-containing agents include pulmonary hypertension, serious ventricular arrhythmias, severe pulmonary disease, cardiac shunting, or hypersensitivity to perflutren, blood, blood products, or albumin. If current recommendations are followed, contrast echocardiography rarely results in significant side effects.22
Uses
Left Ventricular Opacification
The commercially available contrast agents allow for left ventricular opacification (LVO) as well. Relatively low mechanical index modes usually are used (<0.2), to allow for bubble detection without bubble destruction. The images are processed such that the linear scatters from tissue are completely eliminated, leaving only nonlinear scatters from the bubble contrast. The LVO allows enhancement of LV endocardial borders in patients in whom normal studies are challenging.33,34 Such challenging studies include patients who are obese, with pulmonary disease, are critically ill, or on a ventilator.27 The use of LVO substantially increases the accuracy of LV volume determination compared with electron beam computed tomography measurements, decreases interobserver variability associated with these measurements, and increases the number of myocardial segments that may be described accurately during stress echocardiography.35,36 Underestimation of LV volume measurements, which is common with standard echocardiography, may be virtually eliminated with the use of LVO.37 Finally, LVO provides greater visualization of structural abnormalities such as apical hypertrophy, noncompaction, ventricular thrombus, endomyocardial fibrosis, LV apical ballooning (Takotsubo), LV aneurysms or pseudoaneurysms, and myocardial rupture.27
Aortic Dissections
Echocardiographic contrast may be used to diagnose aortic dissections. Artifacts may be distinguished from true aortic dissection and artifact, by the homogenous distribution of contrast within the aortic lumen.27 The intimal flap may be visualized, the entry and exit point may be identified, and the extension into major aortic branches may be more easily defined. The use of contrast further increases the successful differentiation between the true and false lumen.
Doppler Enhancement
The administration of contrast will enhance the echocardiographic Doppler spectrum, where the signal is weak or suboptimal.38 The enhancement is particularly useful in the evaluation of aortic stenosis (AS) but also may be used with transmitral evaluation, pulmonary venous flow determination, or regurgitant tricuspid valvular flow (Figure 12-12). Whereas the threshold for detecting contrast is substantially less for Doppler compared with 2D imaging, contrast agents usually are used initially for the latter application.
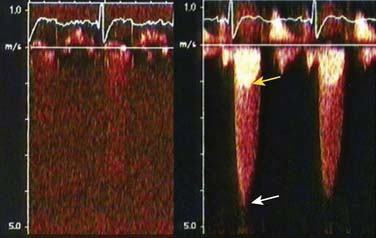
Figure 12-12 Doppler enhancement of aortic stenosis.
(Reproduced from Mulvagh SL, Rakowski H, Vannan MA, et al: American Society of Echocardiography Consensus Statement on the Clinical Applications of Ultrasonic Contrast Agents in Echocardiography. J Am Soc Echocardiogr 21:1179–1201, 2008, by permission.)
Myocardial Perfusion
The second-generation agents allow for perfusion of the myocardial microcirculation. This perfusion allows for assessment of perfusion patterns, coronary artery stenosis, and myocardium at risk during acute coronary syndromes.26 Currently, only Imagify has U.S. Food and Drug Administration approval for myocardial perfusion imaging.
Lindner et al39 described a method for the quantification of myocardial blood flow using contrast echocardiography. If a contrast agent is administered at a steady rate, the blood concentration and myocardial concentration of the contrast agent will equilibrate. If a single high-amplitude (i.e., high mechanical index) ultrasound pulse is delivered to a myocardial ROI, the microbubbles will be destroyed; they will be replenished as the contrast-filled blood perfuses the myocardium. The rate of contrast replenishment in the myocardium is directly related to myocardial blood flow. Repeated ultrasound pulses are delivered at shorter frequencies until a maximum myocardial contrast-enhanced ultrasound signal is obtained. A time-myocardial contrast intensity curve is constructed. Myocardial-contrast echocardiographic-derived indications of myocardial perfusion rate have relatively good between-study and between-reading reproducibility.40
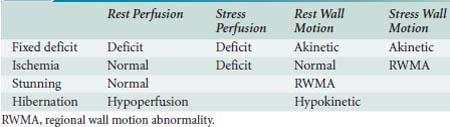
If contrast echocardiography is used in conjunction with traditional echocardiography, different flow patterns can be described as outlined in Table 12-3. A fixed myocardial deficit may be diagnosed with a perfusion deficit during rest and stress and with akinetic segments during both of these periods. An ischemic segment may be defined as a segment with normal perfusion and wall motion with rest, and a perfusion deficit during stress that is accompanied by a regional wall motion abnormality (RWMA). Myocardial stunning may be diagnosed if normal perfusion is observed during rest in the presence of a hypokinetic rest wall motion, and hibernation may be diagnosed with rest hypoperfusion and with hypokinetic rest wall motion. The addition of myocardial-contrast echocardiography (MCE) may increase the sensitivity, but not specificity, of dipyridamole-exercise echocardiography. Moir et al41 combined MCE with dipyridamole-exercise echocardiography in 85 patients. They detected significant coronary artery stenosis in 43 patients involving 69 coronary areas. The addition of MCE improved sensitivity for the detection of CAD (91% vs. 74%; P = 0.02) and accurate recognition of disease extent (87% vs. 65% of territories; P = 0.003).
TABLE 12-3 Diagnosis of Fixed Myocardial Deficits, Ischemia, Stunning, and Hibernation Based on Perfusion and Wall Motion Findings
Measurements of myocardial blood flow by MCE are comparable with other techniques. Senior et al42 compared MCE and single-photon emission computerized tomography (SPECT) for the detection of coronary artery disease (CAD) in 55 patients with a medium probability of CAD. The sensitivity of MCE was significantly greater than that of SPECT for the detection of CAD (86% vs 43%; P < 0.0001); however, the specificities were not significantly different (88% and 93%; P = 0.52). In another investigation, quantitative real-time MCE with dipyridamole defined the presence and severity of CAD in a manner that compared favorably with quantitative SPECT.43
Microvascular perfusion is a prerequisite for ensuring viability early after acute myocardial infarction (AMI). For adequate assessment of myocardial perfusion, both myocardial blood volume and velocity need to be evaluated. Because of its high frame rate, low-power continuous MCE can assess both myocardial blood volume and velocity, allowing for assessment of microvascular perfusion.44 To differentiate necrotic from viable myocardium after reperfusion therapy, Janardhanan et al44 examined 50 patients with low-power continuous MCE 7 to 10 days after acute myocardial perfusion. Myocardial perfusion by contrast opacification was assessed over 15 cardiac cycles after the destruction of microbubbles, and wall thickening was assessed at baseline. Regional and global LV function were reassessed after 12 weeks. Of the segments without contrast enhancements, 93% showed no recovery of function; in the segments with contrast opacification, 84% exhibited functional recovery. The greater the extent and intensity of contrast opacification, the better the LV function at 3 months (P < 0.001; r = −0.91). Almost all patients (94%) with less than 20% perfusion in dysfunctional myocardium (assessing various cutoffs) failed to demonstrate an improvement in LV function.
Janardhanan et al45 performed MCE in 70 patients with AMI after thrombolysis. Myocardial perfusion was examined in the akinetic areas in 20 patients with an occluded infarct-related artery that was subsequently revascularized. Contractile reserve was evaluated in these segments 12 weeks after revascularization with dobutamine–echocardiography. Of the 102 akinetic segments, 37 (36%) showed contractile reserve. Contractile reserve was present in 24 of the 29 segments (83%) with homogenous contrast opacification and absent in 60 of the 73 segments (82%) with reduced opacification. Quantitative measurements of myocardial blood flow were significantly greater (P < 0.0001) in the segments with contractile reserve than in those without contractile reserve. MCE may, thus, be used as a reliable bedside technique for the accurate evaluation of collateral blood flow in the presence of an occluded infarct-related artery after AMI. MCE performed early after percutaneous coronary interventions provides information on the extent of infarction, and hence the likelihood for recovery of contractile reserve. The presence of perfusion before this intervention predicts the maintenance of perfusion and recovery of systolic function.46
MCE may be a useful tool in the detection of myocardial viability before coronary revascularization. In Korosoglou et al’s47 study, contrast echocardiography was compared with low-dose dobutamine stress echocardiography and with combined technetium-99 sestamibi SPECT and fluorodeoxyglucose-18 positron emission tomography. Myocardial recovery was predicted by contrast echocardiography with a sensitivity of 86% and a specificity of 43%, by nuclear imaging with a sensitivity of 90% and specificity of 44%, whereas DSE was similarly sensitive (83%) but more specific (76%). A combination of quantitative MCE and dobutamine stress echocardiography provided the best diagnostic characteristics, with a sensitivity of 96%, a specificity of 63%, and an accuracy of 83%. Fukuda et al48 performed myocardial contrast echocardiography on 28 patients with chronic stable CAD and LV dysfunction before and after coronary revascularization. Of the 101 revascularized dysfunctional segments, MCE was adequately visualized in 91 (90%) segments, and wall motion was recovered in 45 (49%) segments. Quantitative measurements of myocardial blood flow in the recovery segments were significantly greater than that in nonrecovery segments. The investigators concluded that quantitative intravenous MCE can predict functional recovery after coronary revascularization.
Echocardiographic scanners


Resolution
An ultrasound image may be described by its axial, lateral, and elevational resolution (Box 12-4). Axial resolution is the minimum separation between two interfaces located in a direction parallel to the beam so that they can be imaged as two different interfaces. The most precise image resolution is along this axial plane. The higher the frequency of the ultrasound signal, the greater the axial resolution, because ultrasound waves of shorter wavelengths may be utilized. Shorter bursts of ultrasound waves (i.e., short pulse length) provide greater axial resolution. Pulse length should be no more than two or three cycles. The range of frequencies contained within a given ultrasound transmission is referred to as the “frequency bandwidth.” Generally, the shorter the pulse of the ultrasound produced, the greater the frequency bandwidth. Because of the relation between short pulse lengths and high bandwidths, high bandwidths are associated with better axial resolution. High transducer bandwidths also allow for better resolution of deeper structures.

Preprocessing
Dynamic Range Manipulation
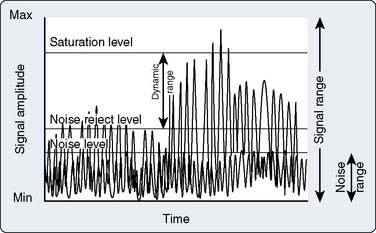
The intensity of echo signals spans a wide range from very weak to very strong. Very strong signals falling beyond the saturation level of the electronic circuitry and very weak signals below the sensitivity of the instrument are automatically eliminated. The dynamic range of the instrument is defined by the limits at which extremely strong or weak signals are eliminated; dynamic range is under operator control (Figure 12-13). In this manner, signals of low intensity that contain little useful information, and mostly noise, can be selectively rejected.
Lateral Gain Control
A recent innovation allows the application of gain control to selected sectors of the ultrasound image. This feature appears particularly useful for the enhancement of image strength of structures that are nearly parallel to the ultrasound beam (e.g., the septum and lateral wall on a short–axis (SAX) view at the level of the papillary muscles; Figure 12-14).
Time-Gain Compensation
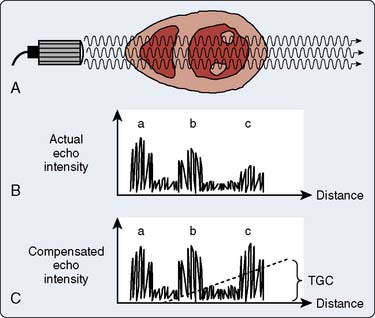
Because any wave traveling through tissues is attenuated proportionally to the traveled distance, it is necessary to compensate for the fact that echoes returning from more distant objects will be weaker than those from equally dense objects closer to the transducer. A mechanism called depth compensation or time-gain compensation (TGC) is used to achieve this. The manner in which time-gain compensation is obtained is illustrated in Figure 12-15. Time-gain compensation can be manually or automatically controlled.
Leading-Edge Enhancement
Leading-edge enhancement, or differentiation, is another type of preprocessing used to sharpen the ultrasound image. The reflected echo signal undergoes half–wave rectification and is smoothed into a signal envelope (Figure 12-16A, B). An amplifier then differentiates the leading edge of the smoothed signal envelope from its first mathematical derivative (see Figure 12-16C), and a narrower and brighter image spot is formed (see Figure 12-16D). Because a 2D image is composed of multiple radially juxtaposed scan lines, excessive edge enhancement narrows bright spots in the direction of travel of the echo beam (i.e., axially but not laterally). For this reason, leading-edge enhancement primarily is performed on M-mode scans, whereas instruments with 2D mode capability use little or no edge enhancement in the 2D mode. Therefore, M-mode images often have better resolution than 2D images and are better suited for quantitative measurements.

Postprocessing
Digital Scan Conversion
After completing analog preprocessing, ultrasound devices digitize the image data with an analog-to-digital (A–D) converter (Figure 12-17). Further processing is done while data are stored in the digital memory (input processing) or as they are received from the memory (output processing). An early step in digital processing uses a scan converter to transform the information obtained as radial sector scan lines into a rectangular (Cartesian) format for television screen display.
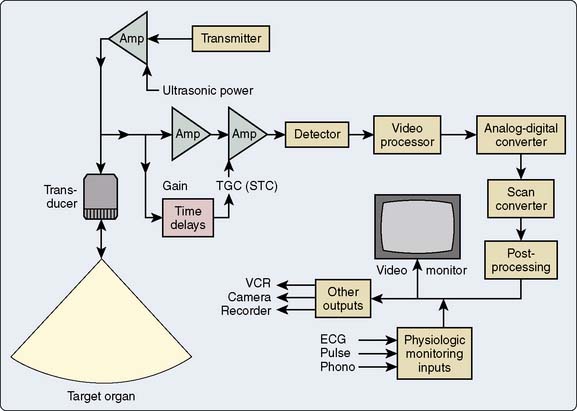

Image Storage
Videotape
The video recorder is a commonly used long-term, mass-storage medium in echocardiography. Most echo scanners are equipped with 1/2-inch VHS, “super” VHS, or 3/4-inch videocassette recorders (VCRs). Their advantages include low cost and their ability to record multiple cardiac cycles, facilitating the creation of 3D images in the reviewer’s mind.49 Because VCRs store images in analog format, the quality of videotaped images currently is inferior to the real-time display, the digital cine memory replay, or digital storage. In the United States, videotape records images using NTSC (National Television Standards Committee) format. When videotape is used, resolution is limited by this NTSC format, which is not lost with digital storage.49 Other disadvantages are the inability to randomly access parts of the current examination or previous examinations, difficulty sharing examinations with colleagues, as well as the degradation of videotape quality over time.49
Digital Storage
Digital image storage rapidly is becoming an alternative to videotape storage. Although the digital storage of echocardiographic images has increased the complexity of study storage, the American Society of Echocardiography (ASE) and others have suggested that digital storage has advantages over other modalities (Table 12-4).50,51 These advantages include:
TABLE 12-4 Advantages of Digital Echocardiographic Storage50,51
Adapted from Thomas JD, Adams DB, Devries S, et al: Digital Echocardiography Committee of the American Society of Echocardiography. Guidelines and Recommendations for Digital Echocardiography: A report from the Digital Echocardiography Committee of the American Society of Echocardiography, J Am Soc Echocardiogr 18:287–297, 2005. Thomas JD, Greenberg NL, Garcia MJ: Digital Echocardiography 2002: Now is the time, J Am Soc Echocardiogr 15:831–838, 2002.
The increased efficiency of digital reading of echocardiographic studies has been demonstrated by Mathewson et al,52 who timed study acquisition and analysis during approximately 750 pediatric echocardiograms. As a group, the digitally captured images contained more hemodynamic measurements and hence required more time for acquisition. The average times for study acquisition were 26.0 ± 8.9 minutes for videotape and 28.4 ± 11.5 minutes for the single-beat digital method. In contrast, interpretation of these studies was more rapid using digital methods, with an average interpretation time of 6.5 ± 3.7 minutes for the videotape compared with 4.6 ± 3.9 minutes for the digital method.
Image Terminology
Clinical Compression
Does clinical compression affect the interpretation of echocardiographic examinations? Haluska et al53 reported high concordance between video and digital echocardiographic interpretations of adult echocardiographic examinations. Most observed discordances were minor, with lesser values being reported with the digital method. For example, degrees of mitral regurgitation were reported to be milder by digital compared with video presentation. Most major discordances were cases of assessment of aortic and MV thickening and the degree of mitral regurgitation; the authors hypothesized that the major discordances were caused by undersampling and not image quality. The routine acquisition of longer video clips may not necessarily increase the accuracy of digital echocardiogram readings. Shah et al54 evaluated 102 patients with regurgitant valvular disease, recording findings on videotape, as well as digitally, using one, two, and three cardiac cycles. They observed substantial agreement when the video and one-cycle digital presentations were compared. There were no increases in agreement when two or three cardiac cycles were presented digitally.
Digital Compression
In a comparison of quantitative measurements of sVHS- and digital MPEG-1–derived images, Garcia et al55 demonstrated excellent agreement between linear, area, and Doppler measurements. The MPEG-1 measurements were reproducible and provided a higher quality compared with the sVHS images. Other studies have confirmed the diagnostic quality of images subjected to MPEG-1 compression.56,57 Harris et al58 compared the image quality of sVHS recording with MPEG-2 compressions, analyzing 80 matched examination interpretations among four echocardiographers. They reported an overall concordance rate of 94%. Most of the reported discrepancies (4% total) were minor. They concluded that MPEG-2 compression offers excellent concordance with sVHS image review. Similar high-quality compression may be seen with newer compression schemes such as MPEG-4.59
Digital Imaging and Communications in Medicine Standard
With the increased use of medical imaging, standardized formats for image storage were developed to allow for uniform acquisition, storage, and distribution of examinations. In 1983, the American College of Radiology and the National Electrical Manufacturers Association formed a joint committee to create a standard format for storing and transmitting these medical images, which was published in 1985. This original protocol was limited to single-frame grayscale images and required highly specific nonstandard hardware for information transfer and storage. Images were stored in a proprietary format, so image viewing was difficult. Subsequently, this format has been further developed and renamed DICOM.60 Its current version may be found on the National Electrical Manufacturers Association website (ftp://medical.nema.org/medical/dicom/2008/08_01pu.pdf); version 3.0 currently is being used.
Image Acquisition, Transmission, Analysis, and Storage
Image Acquisition
Before performing an examination, the patient must be properly identified. If a modality worklist capability is present on the ultrasound machine, the patient information already will have been prepopulated on the ultrasound machine. The minimum examination should consist of all 20 ASE/SCA (Society of Cardiovascular Anesthesiologists) recommended standard multiplane TEE views with the appropriate Doppler and color-Doppler spectra.61 Most of these views are saved as clips, and the Doppler images are saved as static images. Calibration information for off-line analysis (such as length, time, and velocity) is automatically stored. Because ECG monitoring should be used, clips of a fixed number of cardiac cycles may be specified and automatically saved. Because electrocautery artifacts may interfere with cycle determination, an alternative fixed time (e.g., 1 to 2 seconds) may be specified. Although dependent on the number and duration of clips and images stored, the usual echocardiographic examination is between 50 and 100 MB. After conclusion of the study, all examination information may be sent via the LAN (local area network) to the PACS server.
Study Distribution and Analysis
Off-site Distribution
As discussed earlier, individual studies may be 50 to 100 MB in size. If high-speed network connectivity is available (such as 1 Gbps), a 50-MB study may be transmitted to a workstation in less than 1 second (Table 12-5). This high-speed connectivity is, however, not usually available to a user outside of the institutional LAN. If studies are to be accessed outside of an institution, the Internet must be used to download and view these studies; transmission speed may limit the speed of study display. An old-technology dial-up modem may require almost 4 hours to download a 50-MB study, whereas a 1.54-Mbps T1 line may require approximately 5 minutes. Because of these transmission speed issues, studies must be compressed before off-site study transmission. It is most common to use one of the lossy compression routines. Although there is generally some image degradation, image quality still may be reasonable for some diagnostic work. Because these compression routines are used and the actual DICOM image file is not sent, calibration information is lost; thus, off-line image measurements and calculation may be problematic.
| Speed of Connectivity | Study Download Time |
|---|---|
| 28.8 kbps modem | 3.9 hours |
| 112 kbps ISDN | 1 hour |
| 768 kbps DSL or cable modem | 8.6 minutes |
| 1.54 Mbps T1 line | 4.4 minutes |
| 10 Mbps Ethernet | 40 seconds |
| 100 Mbps Ethernet | 4 seconds |
| 1 Gbps Ethernet | 0.4 second |
Adapted from Thomas JD, Adams DB, Devries S, et al: Digital Echocardiography Committee of the American Society of Echocardiography. Guidelines and Recommendations for Digital Echocardiography. A Report from the Digital Echocardiography Committee of the American Society of Echocardiography. J Am Soc Echocardiogr 18:287–297, 2005.
Equipment
The first TEE examination was performed in 1975. The probe used allowed only M-mode imaging and had limited control of direction. Two-dimensional TEE was first performed with a mechanical system.62 The system consisted of a vertical and a horizontal mechanical scanner connected to a 3.5-MHz ultrasonic transducer contained in a 12′20′6-mm oil bag. The transducers were rotated by a single-phase commutator motor via flexible shafts. Subsequently, phased-array transducers were mounted into gastroscope housings.63,64 With their greater flexibility and control, these probes allowed 2D scanning of the heart through many planes, and the probes became the prototypes of the currently used models (see Chapter 11).
Complications
Complications resulting from intraoperative TEE can be separated into two groups: injury from direct trauma to the airway and esophagus and indirect effects of TEE (Box 12-5). In the first group, potential complications include esophageal bleeding, burning, tearing, dysphagia, and laryngeal discomfort. Many of these complications could result from pressure exerted by the tip of the probe on the esophagus and the airway. Although in most patients even maximal flexion of the probe will not result in pressure greater than 17 mm Hg, occasionally, even in the absence of esophageal disease, pressures greater than 60 mm Hg will result.65 To look more closely at the effects on the esophagus, animal autopsy studies have been performed. In dogs as small as 5 kg on cardiopulmonary bypass (CPB) with full heparinization, no evidence of macroscopic or microscopic injury to the esophageal mucosa after 6 hours of maximally flexed probe positioning was noted.66
BOX 12-5 Complications From Intraoperative Transesophageal Echocardiography
Further confirmation of the low incidence of esophageal injury from TEE is apparent in the few case reports of complications. In a study of 10,000 TEE examinations, there was one case of hypopharyngeal perforation (0.01%), two cases of cervical esophageal perforation (0.02%), and no cases of gastric perforation (0%).67 Kallmeyer et al68 reported overall incidences of TEE-associated morbidity and mortality of 0.2% and 0%, respectively. The most common TEE-associated complication was severe odynophagia, which occurred in 0.1% of the study population, dental injury (0.03%), endotracheal tube malpositioning (0.03%), upper gastrointestinal hemorrhage (0.03%), and esophageal perforation (0.01%). Piercy et al69 reported a gastrointestinal complication rate of approximately 0.1%, with a great frequency of injuries among patients older than 70 and women. If resistance is met while advancing the probe, the procedure should be aborted to avoid these potentially lethal complications.
Another possible complication of esophageal trauma is bacteremia. Studies have shown that the incidence rate of positive blood cultures in patients undergoing upper gastrointestinal endoscopy is 4% to 13%,70,71 and that in patients undergoing TEE is 0% to 17%.72–74 Even though bacteremia may occur, it does not always cause endocarditis. Antibiotic prophylaxis in accordance with the American Heart Association (AHA) guidelines is not routinely recommended but is optional in patients with prosthetic or abnormal valves, or who are otherwise at high risk for endocarditis.75
In one of the earliest studies using TEE, transient vocal cord paralysis was reported in two patients undergoing neurosurgery in the sitting position with the head maximally flexed and the presence of an armored endotracheal tube.76 This complication was believed to be due to the pressure the TEE probe exerted against the larynx. Since this initial report, no further problems of this kind have been reported with the use of the newer equipment.
The second group of complications that result from TEE includes hemodynamic and pulmonary effects of airway manipulation and, particularly for new TEE operators, distraction from patient care. Fortunately, in the anesthetized patient, there are rarely hemodynamic consequences to esophageal placement of the probe, and no studies specifically address this question. More important for the anesthesiologist are the problems of distraction from patient care. Although these reports have not appeared in the literature, the authors have heard of several endotracheal tube disconnections that went unnoticed to the point of desaturation during TEE examination. In addition, there have been instances in which severe hemodynamic abnormalities have been missed because of fascination with the images or the controls of the echocardiograph machine. Clearly, new echo operators should enlist the assistance of an associate to watch the patient during the examination. This second anesthesiologist will become unnecessary after sufficient experience is gained. It also is important to be sure that all the respiratory and hemodynamic alarms are activated during the examination. One report that did appear in the literature was that, during TEE, an esophageal stethoscope was inadvertently pushed into the patient’s stomach and was noticed to be missing only when the patient developed a small bowel obstruction.77 There have been instances in which severe hemodynamic and ventilatory abnormalities have been missed because of fascination with the images or the controls of the echocardiograph machine.

Safety Guidelines and Contraindications
Absolute contraindications to TEE in intubated patients include esophageal stricture, diverticula, tumor, recent suture lines, and known esophageal interruption. Relative contraindications include symptomatic hiatal hernia, esophagitis, coagulopathy, esophageal varices, and unexplained upper gastrointestinal bleeding. Notably, despite these relative contraindications, TEE has been used in patients undergoing hepatic transplantation without reported sequelae.78,79
Credentialing
This is an era in medicine in which the observance of guidelines for training, credentialing, certifying, and recertifying medical professionals has become increasingly common. Although there have been warnings80 and objections81 to anesthesiologists making diagnoses and aiding in surgical decision making, there is no inherent reason that an anesthesiologist cannot provide this valuable service to the patient. The key factors are proper training, extensive experience with TEE, and available backup by a recognized echocardiographer (see Chapter 41).
In 1990, a task force from the American College of Physicians, the American College of Cardiology (ACC), and the American Heart Association created initial general guidelines for echocardiography.82 The ASE also provided recommendations for general training in echocardiography and has introduced a self-assessment test for measuring proficiency. These organizations recommended the establishment of three levels of performance with a minimum number of cases for each level: level 1, introduction and an understanding of the indications (120 2D and 60 Doppler cases); level 2, independent performance and interpretation (240 2D and 180 Doppler cases); and level 3, laboratory direction and training (590 2D and 530 Doppler cases).81,83 However, these guidelines are limited because they are not based on objective data or achievement. Furthermore, because different individuals learn at different rates, meeting these guidelines does not ensure competence, nor does failure to meet these guidelines preclude competence.
Proficiency in echocardiography can be achieved more efficiently in a limited setting (i.e., the perioperative period) with fewer clinical applications (e.g., interpreting wall motion, global function, and mitral regurgitation severity) than in a setting that introduces every aspect of echocardiography. The American Society of Anesthesiologists (ASA) and the SCA have worked together to create a document on practice parameters for perioperative TEE.84,85 The SCA then created a Task Force on Certification for Perioperative TEE to develop a process that acknowledged basic competence and offered the opportunity to demonstrate advanced competence as outlined by the SCA/ASA practice parameters. This process resulted in the development of the Examination of Special Competence in Perioperative Transesophageal Echocardiography (PTEeXAM). In 1998, the National Board of Echocardiography was formed. Currently, board certification in perioperative TEE may be granted by meeting the following requirements: (1) the holding of a valid license to practice medicine, (2) board certification in an approved medical specialty (e.g., anesthesiology), (3) training and/or experience in the perioperative care of surgical patients with cardiovascular disease, (4) the study of 300 echocardiographic examinations, and (5) the passing of the PTEeXAM (see the National Board of Echocardiography website for more information: http://www.echoboards.org/content/advanced-PTEexam-certification).
Training/quality assurance
TEE training should begin with a dedicated training period. This is most easily accomplished during a cardiac anesthesia fellowship but can be done by postgraduate physicians as well. The subject can be approached through a combination of tutorials, scientific review courses, self–instruction with teaching tapes, interactive learning programs, and participation in echo reading sessions.86,87 Frequently, a symbiotic relationship with the cardiology division can be established in which anesthesiologists can teach the fundamentals of airway management, operating room physiology, and the use of local anesthetics while learning the principles of echocardiography from the cardiologists.
Quality assurance is another area for which no specific guidelines currently exist for TEE. One model for quality assurance was proposed by Rafferty et al.88 At the very least, each echocardiogram should be recorded in a standardized fashion and accompanied by a written report for inclusion in the patient’s chart. Images also may be copied and included in the chart. Careful records of any complications should be maintained. To ensure that the proper images are being obtained and that the interpretations are correct, the studies should be periodically reviewed. This is another area in which the relation between cardiology and anesthesiology can be productive.
Practice parameters
An updated report by the American Society of Anesthesiologists and the Society of Cardiovascular Anesthesiologists Task Force on Transesophageal Echocardiography was published in 2010.85 This document updated the 1996 published guidelines for the perioperative use of TEE.84 The major change that these guidelines recommend is that perioperative TEE should be utilized in all adult patients, without contraindications for TEE, presenting for cardiac or thoracic aortic procedures. A complete TEE examination should be performed in all patients with the following intent: (1) confirm and refine the preoperative diagnosis, (2) detect new or unsuspected pathology, (3) adjust the anesthetic and surgical plan accordingly, and (4) assess results of the surgical intervention.
Minhaj et al’s89 study found that in 30% of patients, the routine use of TEE during cardiac surgery revealed a previously undiagnosed cardiac pathology leading to change in surgical management in 25% of patients studied. Eltzschig et al90 were able to confirm these findings in a much larger cohort, showing that the perioperative use of TEE may improve outcome. This group reported that 7% of 12,566 consecutive TEE examinations directly influenced surgical decision making. Combined procedures (CABG, valve) were most commonly influenced by perioperative TEE. In 0.05%, the surgical procedure was actually canceled as a direct result of the intraoperative TEE examination.