[level-membership-for-pediatrics-category]Chapter 33
Inherited Metabolic and Neurodegenerative Disorders
Inherited Metabolic Brain Disorders
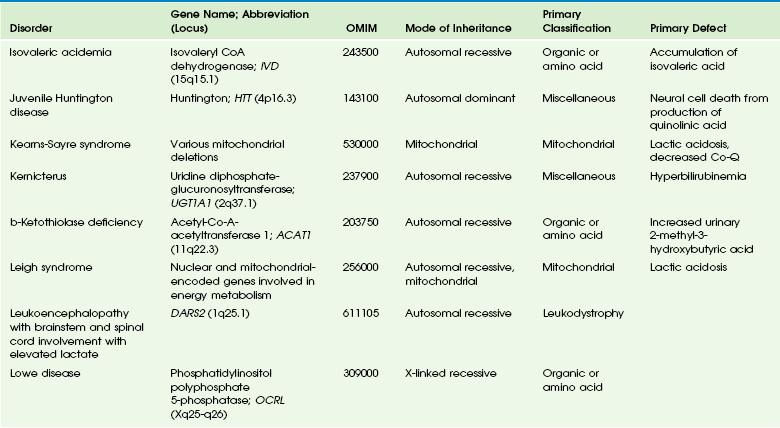
This chapter includes as a reference a large listing of metabolic brain diseases encountered in the imaging setting (see Tables 33-1 to 33-10). For convenience, the recognized metabolic or genetic defect and the patterns of inheritance are summarized. However, because of space limitations, the following discussion will address only the most commonly encountered of these rare disorders.
Table 33-1
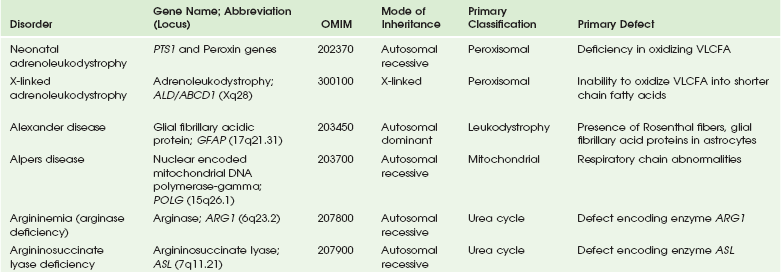
OMIM, Online Mendelian Inheritance in Man Database; VLCFA, very-long-chain fatty acid.
Adapted From Cecil KM. MR spectroscopy of metabolic disorders. Neuroimaging Clin North Am 2006;16:87-116; used with permission. Data from The Johns Hopkins University, Online Mendelian Inheritance in Man (OMIM), McKusick-Nathans Institute for Genetic Medicine, Johns Hopkins University (Baltimore, MD) and the National Center for Biotechnology Information, National Library of Medicine (Bethesda, MD), 2000. Available at http://www.ncbi.nlm.nih.gov/omim/. Accessed October 2012.
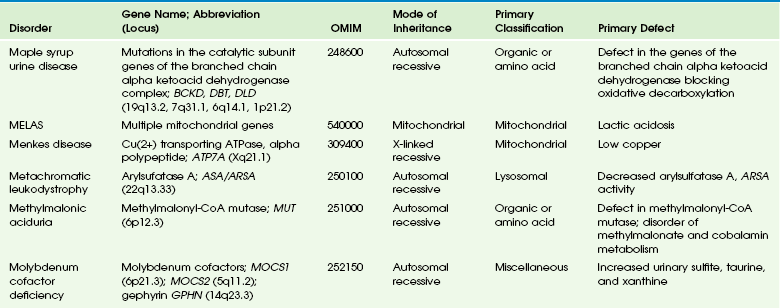
Table 33-2
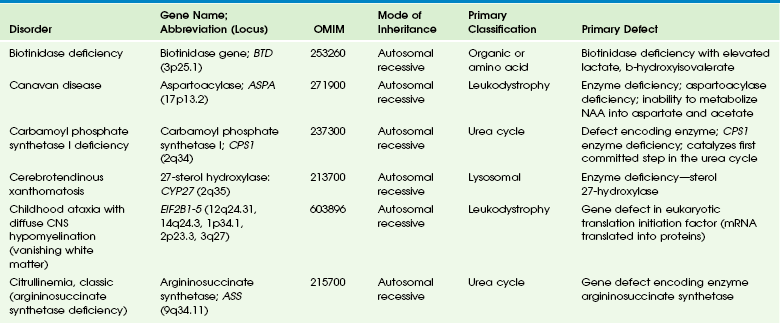
Adapted From Cecil KM. MR spectroscopy of metabolic disorders. Neuroimaging Clin N Am 2006;16:87-116; used with permission. Data from The Johns Hopkins University, Online Mendelian Inheritance in Man (OMIM), McKusick-Nathans Institute for Genetic Medicine, Johns Hopkins University (Baltimore, MD) and the National Center for Biotechnology Information, National Library of Medicine (Bethesda, MD), 2000. Available at http://www.ncbi.nlm.nih.gov/omim/. Accessed October 2012.
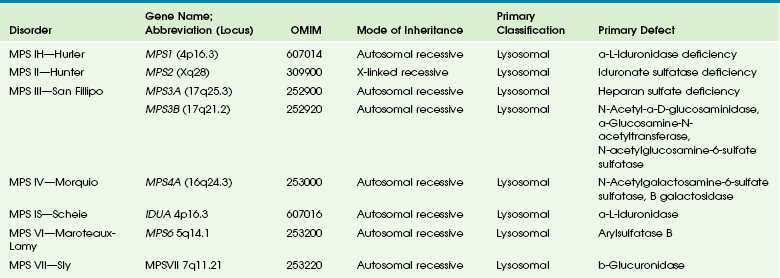
Table 33-3
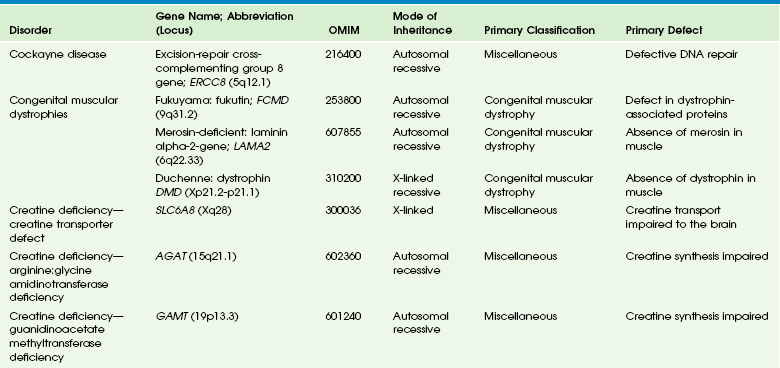
DNA, Deoxyribonucleic acid; OMIM, online Mendelian Inheritance in Man Database.
Adapted From Cecil KM. MR spectroscopy of metabolic disorders. Neuroimaging Clin N Am 2006;16:87-116; used with permission. Data from The Johns Hopkins University, Online Mendelian Inheritance in Man (OMIM), McKusick-Nathans Institute for Genetic Medicine, Johns Hopkins University (Baltimore, MD) and the National Center for Biotechnology Information, National Library of Medicine (Bethesda, MD), 2000. Available at http://www.ncbi.nlm.nih.gov/omim/. Accessed October 2012.
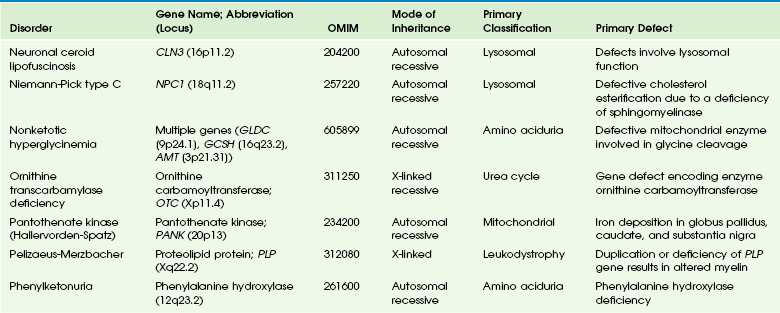
Table 33-4
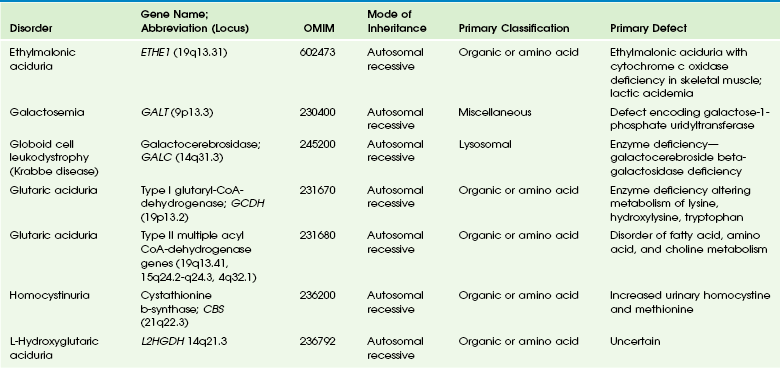
OMIM, Online Mendelian Inheritance in Man Database.
Adapted From Cecil KM. MR spectroscopy of metabolic disorders. Neuroimaging Clin N Am 2006;16:87-116; used with permission. Data from The Johns Hopkins University, Online Mendelian Inheritance in Man (OMIM), McKusick-Nathans Institute for Genetic Medicine, Johns Hopkins University (Baltimore, MD) and the National Center for Biotechnology Information, National Library of Medicine (Bethesda, MD), 2000. Available at http://www.ncbi.nlm.nih.gov/omim/. Accessed October 2012.
Table 33-5
OMIM, Online Mendelian Inheritance in Man Database.
Adapted From Cecil KM. MR spectroscopy of metabolic disorders. Neuroimaging Clin N Am 2006;16:87-116; used with permission. Data from The Johns Hopkins University, Online Mendelian Inheritance in Man (OMIM), McKusick-Nathans Institute for Genetic Medicine, Johns Hopkins University (Baltimore, MD) and the National Center for Biotechnology Information, National Library of Medicine (Bethesda, MD), 2000. Available at http://www.ncbi.nlm.nih.gov/omim/. Accessed October 2012.
Table 33-6
Adapted From Cecil KM. MR spectroscopy of metabolic disorders. Neuroimaging Clin N Am 2006;16:87-116; used with permission. Data from The Johns Hopkins University, Online Mendelian Inheritance in Man (OMIM), McKusick-Nathans Institute for Genetic Medicine, Johns Hopkins University (Baltimore, MD) and the National Center for Biotechnology Information, National Library of Medicine (Bethesda, MD), 2000. Available at http://www.ncbi.nlm.nih.gov/omim/. Accessed October 2012.
Table 33-7
OMIM, Online Mendelian Inheritance in Man Database.
Adapted From Cecil KM. MR spectroscopy of metabolic disorders. Neuroimaging Clin N Am 2006;16:87-116; used with permission. Data from The Johns Hopkins University, Online Mendelian Inheritance in Man (OMIM), McKusick-Nathans Institute for Genetic Medicine, Johns Hopkins University (Baltimore, MD) and the National Center for Biotechnology Information, National Library of Medicine (Bethesda, MD), 2000. Available at http://www.ncbi.nlm.nih.gov/omim/. Accessed October 2012.
Table 33-8
OMIM, Online Mendelian Inheritance in Man Database.
Adapted From Cecil KM. MR spectroscopy of metabolic disorders. Neuroimaging Clin N Am 2006;16:87-116; used with permission. Data from The Johns Hopkins University, Online Mendelian Inheritance in Man (OMIM), McKusick-Nathans Institute for Genetic Medicine, Johns Hopkins University (Baltimore, MD) and the National Center for Biotechnology Information, National Library of Medicine (Bethesda, MD), 2000. Available at http://www.ncbi.nlm.nih.gov/omim/. Accessed October 2012.
Table 33-9
Adapted From Cecil KM. MR spectroscopy of metabolic disorders. Neuroimaging Clin N Am 2006;16:87-116; used with permission. Data from The Johns Hopkins University, Online Mendelian Inheritance in Man (OMIM), McKusick-Nathans Institute for Genetic Medicine, Johns Hopkins University (Baltimore, MD) and the National Center for Biotechnology Information, National Library of Medicine (Bethesda, MD), 2000. Available at http://www.ncbi.nlm.nih.gov/omim/. Accessed October 2012.
Table 33-10
OMIM, Online Mendelian Inheritance in Man Database.
Adapted From Cecil KM. MR spectroscopy of metabolic disorders. Neuroimaging Clin N Am 2006;16:87-116; used with permission. Data from The Johns Hopkins University, Online Mendelian Inheritance in Man (OMIM), McKusick-Nathans Institute for Genetic Medicine, Johns Hopkins University (Baltimore, MD) and the National Center for Biotechnology Information, National Library of Medicine (Bethesda, MD), 2000. Available at http://www.ncbi.nlm.nih.gov/omim/. Accessed October 2012.
Lysosomal Storage Diseases
Gangliosidoses
GM1 Gangliosidosis
Three types of GM1 gangliosidosis exist: type I (infantile), type II (late infantile/juvenile), and type III (adult). An intermediate form between infantile and juvenile has been reported.1 The clinical presentation of GM1 gangliosidosis typically occurs in infancy; its features include seizures, decerebrate posturing, pitting edema of the face, hypotonia, developmental delay, hepatosplenomegaly, macrocephaly, and cherry red spots involving the macula of the retina. Additional features include broad digits, kyphoscoliosis, skeletal dysplasia with widening of the metabphyses, and dermal pigmentary lesions.2 The course is progressive, with death common within 2 years of life. A juvenile form presents during the second year of life with progressive ataxia but without many features of the infantile variety.
The underlying deficiency of β-galactosidase results in accumulation of GM1 ganglioside in both gray and white matter of the cerebrum, brainstem, cerebellum, and spinal cord. Results of cerebral MRI initially are normal, with subsequent loss of cortical gray matter. Secondary changes to the white matter manifest later and typically exhibit an abnormal, nonspecific, patchy, hyperintense T2 signal within the centrum semiovale. Hypointensity of the thalami on T2-weighted images also has been reported.3
GM2 Gangliosidosis
The most common forms of GM2 gangliosidoses include Tay-Sachs disease and Sandhoff disease. Tay-Sachs disease arises with β-N-acetylhexosaminidase-A isoenzyme deficiency in Jewish children of eastern European descent. Onset is usually before the age of 1 year with irritability, hypotonia, seizures, blindness, and cherry-red spots on the macula in 90% of patients. Death usually results by 2 to 3 years of age. Sandhoff disease is attributed to a deficiency of A and B isoenzymes of hexosaminidase. The clinical course is similar to that of Tay-Sachs disease. There is visceral involvement, including hepatomegaly and cardiac and renal tubular abnormalities. Brain MRI in the early stages demonstrates increased T2 signal in the basal ganglia, particularly with the enlarged caudate nuclei. Later, cortical and deep gray matter volume loss occurs with patchy increases in T2 signal in the white matter. Thalamic involvement is more reflective of Sandhoff disease. In adult-onset Sandhoff disease, lower motor neuron involvement has been reported. Whereas cerebellar atrophy may vary, it does not appear to be correlated with clinical severity.4 In persons with Tay-Sachs disease, the thalami may be hypointense on T2-weighted images and hyperintense on T1-weighted images because of calcium deposition. It has been reported that T2-weighted hyperintensity in cerebral matter is indicative of abnormal myelin production and active demyelination.5 Asymmetrical swelling and high T2 intensity in the white matter and basal nuclei of the right hemisphere has been reported. Elevated levels of cytokines have been reported, possibly indicating inflammation as a contributing factor to the progression of gangliosidosis.6 In the B1 variant of GM2 gangliosidosis, the bilateral thalami may appear hyperdense/hyperintense on CT/T1-weighted MRI and show a T2-hypointense signal in the ventral thalami and a hyperintense signal in the posteromedial thalami. Other findings in this variant include involvement of the medullary lamellae, bilateral T2 hyperintense/swollen basal ganglia, diffuse white matter hyperintensity on T2-weighted images, and brain atrophy in later stages.7
Mucopolysaccharidoses
Cerebral MRI demonstrates two major abnormalities:
1. Diffuse patches of hyperintensity on T2-weighted images resulting from accumulation of mucopolysaccharide in neurons and astrocytes and degenerative effects on myelin
2. Prominent cystic or perivascular spaces resulting from metabolic accumulation within histiocytes located in perivascular areas, which is the most characteristic imaging feature; reversal of these changes after bone marrow transplantation has been reported
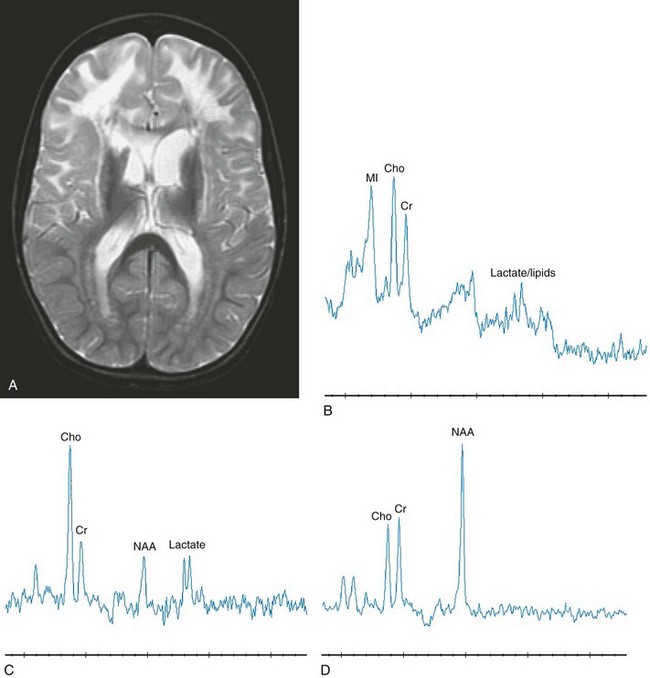
Spinal stenosis is especially common in Morquio and Maroteaux-Lamy variants but may be demonstrated in other variants. Typical bullet-shaped vertebral bodies are characteristic (Fig. 33-1).
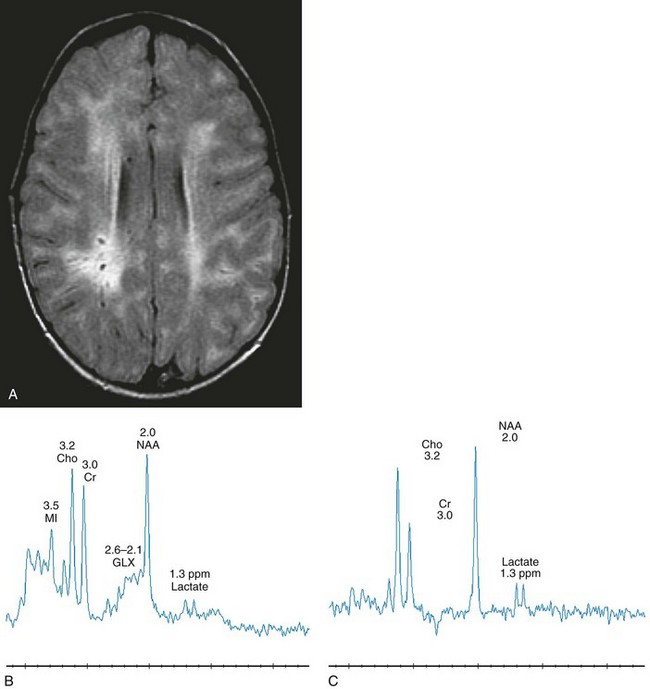
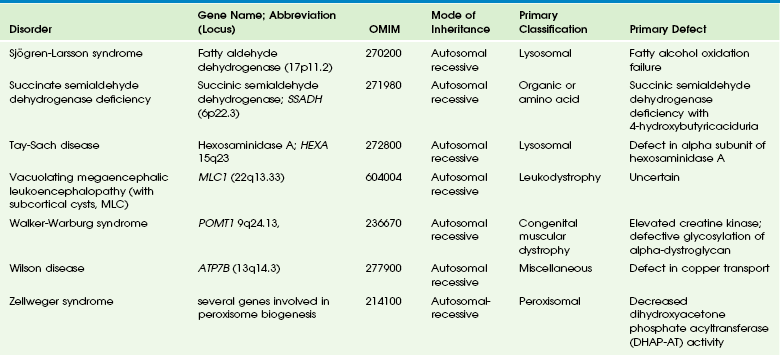
Figure 33-1 A 2-year-old boy with Hunter syndrome, mucopolysaccharidoses, type II.
Select axial fluid-attenuated inversion recovery (A), short echo (time to echo [TE] 35 msec) magnetic resonance spectroscopy (MRS) (B), and long echo (TE 288 msec) MRS (C) images are shown. The patient underwent scanning within months of a stem cell transplant. Prominent perivascular spaces are demonstrated with a diffuse, abnormal, hyperintense signal throughout the periventricular and subcortical white matter. The spectra demonstrate diminished N-acetylaspartate levels with elevated lactate, which may reflect histiocytic cell infiltration of the perivascular spaces and brain parenchyma. (From Cecil KM. MR spectroscopy of metabolic disorders. Neuroimaging Clin N Am. 2006;16:87-116; used with permission.)
Neuronal Ceroid Lipofuscinoses
NCL is a disorder or group of disorders characterized by striking volume loss of brain parenchyma. NCL, which can be divided into six subtypes based on age at onset, is one of the most common neurodegenerative syndromes, with an incidence of 1 per 25,000 live births. The various subtypes are associated with different mutations in the CLN genes and have similar clinical manifestations occurring at different ages. These manifestations include seizures and abnormal eye movements, with subsequent vision loss, dementia, hypotonia, and speech and motor deficits. CSF neurotransmitter abnormalities also have been reported in patients with NCL.8 At pathology, these disorders are characterized by distinctive granular inclusions in neuronal lysosomes, called granular osmiophilic deposits. Imaging findings follow behind the clinical presentation in all but the infantile form of NCL and are dominated by progressive cerebral and cerebellar volume loss. Later stages of disease are characterized by development of a band of hyperintense signal in the periventricular white matter on T2-weighted images. In palmitoyl protein thioesterase-1 related NCL, isolated, symmetric dentate nucleus hyperintensities have been reported in early stages on T2-weighted images.9 Proton MRS has shown progressive decreases in NAA and relative increases in mI in persons with NCL.
Metachromatic Leukodystrophy
In persons with MLD, the primary metabolic defect is a deficiency in the enzyme arylsulfatase A, resulting in the accumulation of cerebroside sulfate within the lysosome. MLD has four subtypes: congenital, late infantile, juvenile, and adult. The late infantile subtype is the most common and presents from around 14 months to 4 years of age. The early presentations are an unsteady gait that progresses to severe ataxia and flaccid paralysis, dysarthria, mental retardation, and decerebrate posturing. Gallbladder involvement has been reported, possibly appearing before the onset of neurologic symptoms. Intestinal involvement also has been reported, specifically polypoid masses in one patient.10
Histologic analysis of the abnormal nervous tissue demonstrates a complete loss of myelin (demyelination) followed by axonal degeneration. Metachromatic granules are reported within engorged lysosomes in white matter and neurons and on peripheral nerve biopsies. Oligodendrocytes are reduced in number, and areas of demyelination predominate throughout the deep white matter region. Early sparing of the subcortical arcuate white matter fibers (“U” fibers) occurs until late in the disease process. An inflammatory response typically is absent, which accounts for a lack of enhancement in this disorder, but eventually, even myelinated white matter is replaced by astrogliosis and scarring. The corpus callosum is involved before significant progression, whereas subcortical white matter remains unaffected until the disease has progressed; atrophy is a late sign. Demyelination also can be seen in the posterior limbs of the internal capsule, descending pyramidal tracts, and the cerebellar white matter.11 Thalamic changes may be common in primary MLD, and isolated cerebellar atrophy may be seen in some atypical later-onset variants. On T2-weighted images, there is marked hyperintensity of the white matter fiber tracts involving the cerebral hemispheres that may extend to the cerebellum, brainstem, and spinal cord. The findings further demonstrate diffuse deep white matter involvement with relative sparing of subcortical white matter. The findings initially are focal and patchy, but later, a diffuse, hyperintense T2 signal of the centrum semiovale develops. Two distinct white matter appearances have been noted that mimic what was previously considered to be pathognomonic of Pelizaeus-Merzbacher disease (PMD). Punctate areas of hypointensity (“leopard skin” appearance) and radiating patterns of linear tubular structures of T2 hypointensity (“tigroid” appearance) are seen, with areas of relatively normal-appearing white matter within the areas of demyelination. On T1-weighted images, the white matter fibers may be isointense with, or hypotense to, gray matter (Fig. 33-2).
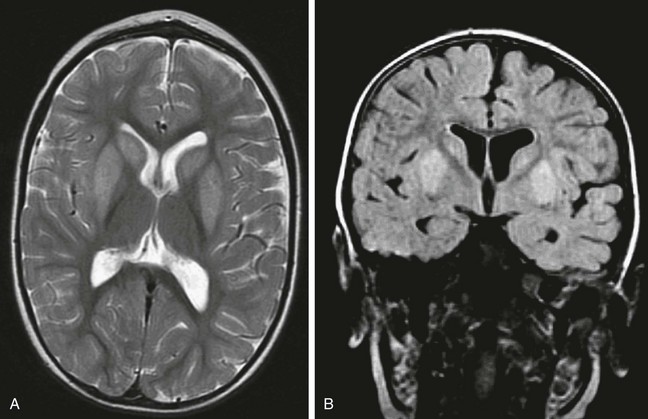
Figure 33-2 A 7-year-old boy with metachromatic leukodystrophy.
Select axial T2-weighted (A), coronal fluid-attenuated inversion recovery (B) with left parietal white matter short echo magnetic resonance spectroscopy (MRS) (C) and long echo MRS (D) images reveal an abnormal hyperintense signal in the periventricular white matter throughout the cerebrum, sparing the subcortical U fibers. The signal has a “tigroid” appearance on T2-weighted images. The spectra demonstrate significant elevations of choline and myo-inositol with diminished N-acetylaspartate reflecting neuroaxonal loss, demyelination, and glial activation. (From Cecil KM. MR spectroscopy of metabolic disorders. Neuroimaging Clin N Am. 2006;16:87-116; used with permission.)
Proton MRS studies have demonstrated reduced NAA, which is expected with neuroaxonal loss, but they also have revealed disturbances in glial cell metabolism associated with elevated mI and choline. The levels of NAA in white matter have been found to correlate with motor function in children with MLD.12
Globoid Cell Leukodystrophy (Krabbe Disease)
Globoid cell leukodystrophy (Krabbe disease) arises from a deficiency in the enzyme β-galactocerebrosidase, leading to the accumulation of cerebroside and galactosylsphingosine, which induces apoptosis in the oligodendrocyte cell lines. Globoid cell leukodystrophy, an autosomal-recessive disorder, has a frequency of 2 in 100,000 in a series reported from Sweden. It is seen predominantly in young children; however, the infantile form is the most common. Onset of symptoms usually begins between 3 and 5 months after birth with irritability. The disease continues to progress, with development of symptoms mimicking encephalitis with motor deterioration and atypical seizures. At the end stage of the disease, the child is in a vegetative state with decerebrate posturing. Elevated CSF protein has been reported, to a larger extent in adult phenotypes than in phenotypes affecting younger people.13 Positional ocular flutter has been reported in one patient with infantile Krabbe disease.14 In nerve conduction studies, the severity of abnormalities appears to correlate with the severity of clinical symptoms.15
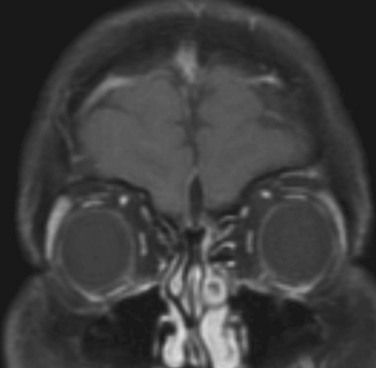
Delayed myelination may be the first finding noted on MRI in infants with this disorder. In infantile Krabbe disease, MRI findings may be normal, but as the disease progresses, classic Krabbe features emerge; this phenomenon is probably related to the immature myelination.16 The appearance of Krabbe disease on MRI is featured as one of either two patterns. A patchy hyperintense periventricular signal on T2-weighted images, consistent with hypomyelination, eventually may evolve into a more diffuse pattern in the white matter. In this form, involvement of the thalami with a hyperintense T2 signal often is present as well. A second pattern is a patchy low signal on T2-weighted images in a similar distribution to the hyperdense regions seen on CT, which is suspected to represent a paramagnetic effect from calcium deposition in the region. Additional early changes include increased density in the distribution of the thalami, cerebellum, caudate heads, and brainstem that may precede the abnormally low attenuation of white matter in the centrum semiovale. Symmetric enlargement of the optic nerves also has been described in persons with Krabbe disease, which is presumed to reflect accumulation of proteolipid in globoid cells. The distal optic nerves are primarily involved; however, a case has been described with proximal prechiasmatic enlargement of the nerves.17 At times, changes within the cerebellar white matter also have been reported, with hyperintensity on T2-weighted images. The findings within the spinal cord are visualized as atrophic changes. Diffuse volume loss and periventricular white matter abnormalities predominate in the latter stages of this disease (Fig. 33-3).
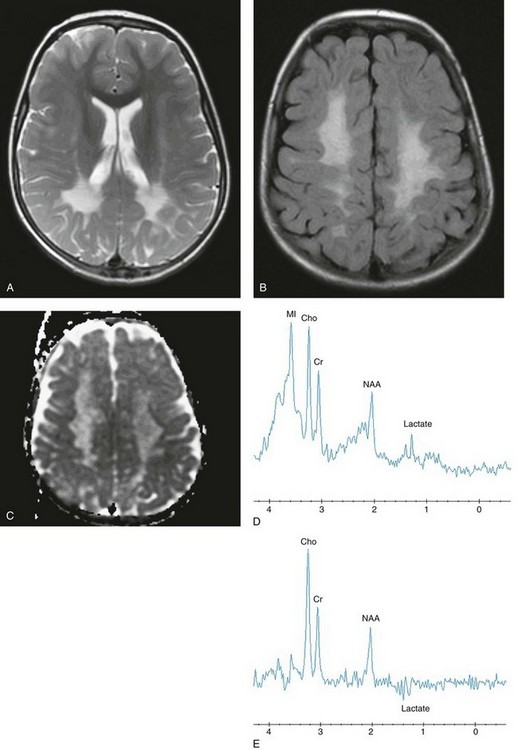
Figure 33-3 A 4-year-old girl with Krabbe disease.
Select axial T2-weighted fast spin echo (A), axial fluid-attenuated inversion recovery (FLAIR) (B), axial apparent diffusion coefficient (ADC) map (C), short echo magnetic resonance spectroscopy (MRS) (D), and intermediate (time to echo 144 msec) echo MRS (E) images are shown. Abnormal hyperintense T2 and FLAIR signals are noted within the centrum semiovale with sparing of the subcortical U fibers and posterior limbs of the internal capsules. Relatively increased diffusion is seen in the periatrial and parietal white matter. The spectra demonstrate significant elevations of lactate, choline, and myo-inositol, with diminished N-acetylaspartate reflecting neuroaxonal loss, demyelination, and glial activation.
Peroxisomal Disorders
Zellweger Syndrome (Cerebrohepatorenal Syndrome)
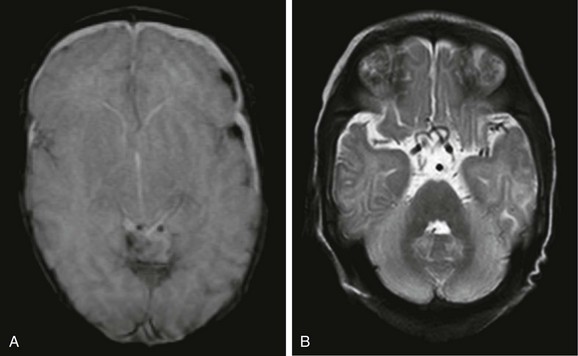
ZS is an autosomal-recessive disease characterized by defective peroxisomal functions. Infants are symptomatic early, with hypotonia, seizures, large liver size, and limb and facial anomalies that are easily recognizable at birth. A diffuse lack of myelination throughout the white matter is noted, combined with cortical dysplasia. The gyri are broad, with shallow intervening sulci found mainly in the anterior frontal and temporal lobes but also over the convexities in the perirolandic area. The presence of a germinolytic cyst in the caudothalamic groove is common in persons with ZS, and one case of germinolytic cysts with hemorrhagic transformation has been reported.18 In one case, signal abnormality suggestive of demyelination was identified almost solely in the bilateral corticospinal tracts, in particular in the brainstem with concomitant motor losses.19 Variants of ZS also have been described that do not follow the typical prototype but demonstrate many common features to ZS. Clinical overlap may occur with other conditions, including neonatal ALD, infantile Refsum disease, and hyperpipecolic acidemia. Death usually comes with many of these conditions within the first two years of life (e-Fig. 33-4).
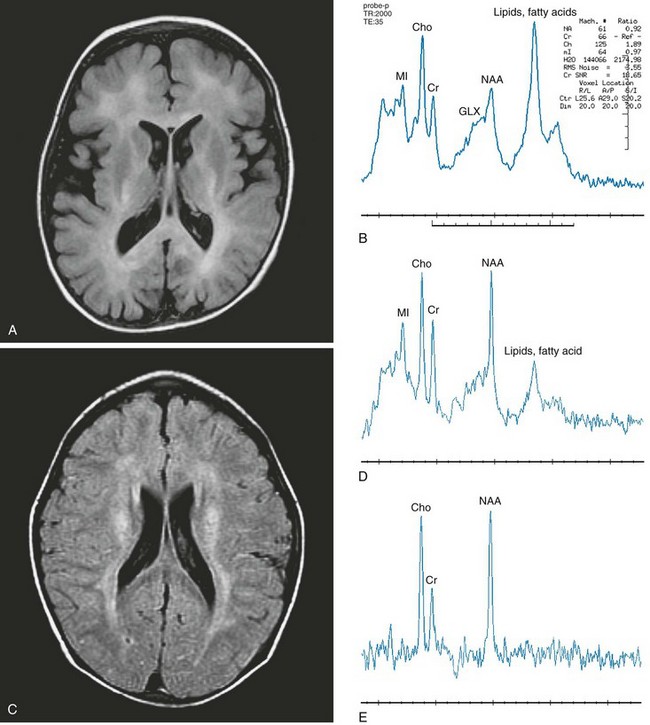
e-Figure 33-4 Zellweger syndrome (A and B) and Refsum disease (C, D, and E).
Axial fluid-attenuated inversion recovery (FLAIR) (A) and short echo magnetic resonance spectroscopy (MRS) (B) images were acquired in the left frontal lobe of a 3-year-old boy with Zellweger syndrome. Imaging demonstrates mildly enlarged ventricles and extraaxial spaces consistent with parenchymal volume loss with abnormal hyperintense signal throughout the white matter. Axial FLAIR (C), short echo MRS (D), and long echo MRS (E) images were acquired in the periventricular white matter of a 6-year-old boy with Refsum disease. An abnormal hyperintense signal is demonstrated in the periventricular white matter and is noted along the course of the corticospinal tracts. Spectra from both patients demonstrate an elevated lipid peak, representing stored fatty acids. Reduced N-acetylaspartate with elevated choline and myo-inositol levels also are demonstrated in the spectra. (From Cecil KM. MR spectroscopy of metabolic disorders. Neuroimaging Clin N Am. 2006;16:87-116; used with permission.)
Neonatal Adrenoleukodystrophy
Neonatal ALD is characterized by the presence of multiple recognizable enzyme deficiencies with grossly normal but deficient numbers of peroxisomes. Specific conditions include pipecolic and phytanic acidemia and a deficiency of plasmalogen synthetase. This condition also presents with hypotonia in the first months of life but without many of the facial features of ZS. Cortical abnormalities in the form of a dysplasia can be found in this condition, as well as hypomyelination in cerebral white matter (Fig. 33-5).
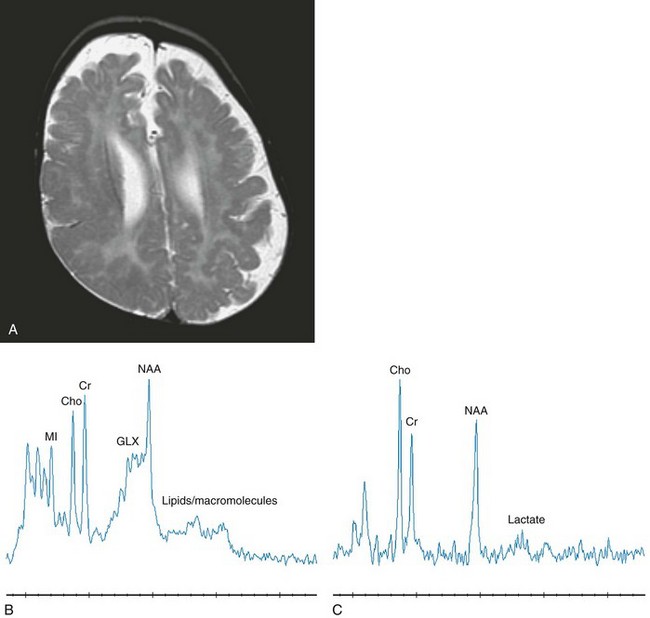
Figure 33-5 A 12-month-old boy with neonatal adrenoleukodystrophy.
Axial T2-weighted (A), short echo magnetic resonance spectroscopy (MRS) (B), and long echo MRS (C) images are shown. The imaging reveals an abnormal hyperintense signal within the central white matter and an abnormal cerebral gyral pattern consistent with polymicrogyria. The lateral ventricles and extraaxial spaces are prominent in size with a thin corpus callosum. The spectroscopy performed in the left parietal cortex and white matter reveals elevated glutamate and glutamine with a slightly elevated lactate signal and reduced N-acetylaspartate levels. (From Cecil KM. MR spectroscopy of metabolic disorders. Neuroimaging Clin N Am. 2006;16:87-116; used with permission.)
Adrenoleukodystrophy
X-linked ALD is the prototypical peroxisomal disorder in which the morphology of the organelle is found to be normal on electron microscopy but a single enzyme defect, acyl-CoA synthetase, along with a failure of incorporation into cholesterol esters for myelin synthesis, leads to the accumulation of very-long-chain fatty acids and progressive CNS deterioration in the form of a chronic progressive encephalopathy. This “classic” form of ALD is an X-linked disorder with a clinical onset between the ages of 5 to 7 years that includes behavioral problems, followed by a rapidly progressive decline in neurologic function and death within the ensuing 5- to 8-year period. The first indication of this condition may include mental status changes or a decline in school performance, progressing to subtle alterations in neurocognitive function, and ultimately resulting in severe spasticity and visual deficits, leading finally to a vegetative state and death. Childhood cerebral ALD, although rare, can present with raised intracranial pressure (ICP) and an elevated level of CSF protein.20
X-linked ALD has been described with a typical appearance on CT and MRI with predominately posterior involvement that, over time, progresses from posterior to anterior into the frontal lobes and from the deep white matter to the peripheral subcortical white matter. On CT, the involvement appears as symmetrical low attenuation in a butterfly distribution across the splenium of the corpus callosum, surrounded on its periphery by an enhancing zone (inflammatory intermediate zone). Three zones are readily distinguished on MR: an inner zone of astrogliosis and scarring corresponds to the low density zone seen on CT that appears hypointense on T1-weighted images and hyperintense on T2-weighted sequences; an intermediate zone of active inflammation that appears isointense on T1-weighted images and isointense or hypointense on T2-weighted images; and an outer zone of active demyelination that appears minimally hypointense on T1-weighted images and hyperintense on T2-weighted scans. Enhancement after administration of gadolinium is demonstrated within the intermediate zone of active inflammation and may disappear as the first change after bone marrow transplantation (Fig. 33-6).
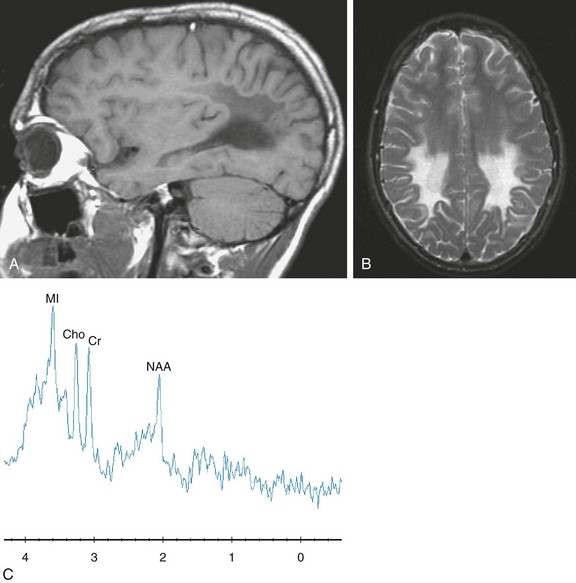
Figure 33-6 A 16-year-old boy with X-linked adrenoleukodystrophy, 8 months after a bone marrow transplant.
Sagittal T1-weighted (A), axial T2-weighted (B), and short echo magnetic resonance spectroscopy (C) images are shown. The imaging demonstrates an abnormal signal in the posterior portion of the cerebrum. The spectra sampled in the right posterior parietal white matter reveals a diminished N-acetylaspartate level with an elevated myo-inositol level. Imaging and spectroscopy reflected disease stability for this patient.
Mitochondrial Diseases
Kearns-Sayre Syndrome
Kearns-Sayre syndrome is a mitochondrial cytopathy characterized by external ophthalmoplegia, retinal pigmentary degeneration, and conductive hearing block. Ragged red fibers indicative of a defect in the respiratory chain of mitochondria are demonstrated on muscle biopsy, in common with mitochondrial encephalomyopathy, lactic acidosis, and strokelike symptoms (MELAS) and myoclonic epilepsy with ragged red fibers (MERRF) syndromes. The heart is often affected, causing conduction defects, which progress to heart block, manifesting as heart failure.21 Choroid plexus failure also has been reported.22 Cerebral MRI demonstrates diffuse, patchy areas of hyperintensity on T2-weighted images. In the presence of calcification, both the basal ganglia and dentate regions also may show hyperintense T1-weighted signal. On T2/FLAIR images, bilateral involvement of the thalamus, basal ganglia, and brainstem are observed. Cerebral and, more frequently, cerebellar atrophy often are observed.23 Ocular myopathy characterizes some patients affected by Kearns-Sayre syndrome (e-Fig. 33-7).
Melas Syndrome
Proton MRS has been used to aid diagnosis of mitochondrial disorders, with the assumption that elevation of lactic acid is a primary feature. However, positive lactate at spectroscopy does not necessarily equal the presence of a mitochondrial disorder, and the absence of lactate on MRS does not rule out a defect in mitochondrial function. Proton MRS in patients with MELAS syndrome can demonstrate variable results as strokelike lesions emerge and evolve. Proton MRS details energy failure with increased lactate and decreased creatine. Elevation of lactate in the acute and subacute stages typically is observed, with subsequent declines in NAA and creatine, consistent with neuroaxonal injury that may or may not be reversible. It has been reported that both increase of lactate peaks in MRS and state of hyperperfusion in continuous arterial spin labeling images are both indicative of active lesions.24 Reports have shown that MELAS syndrome is differentiated from ischemic stroke because of its longer ADC decline. Another distinctive characteristic of MELAS syndrome is the gradual spread of the core of the edematous lesion, a contributing factor to the prolonged ADC decline25 (Fig. 33-8).
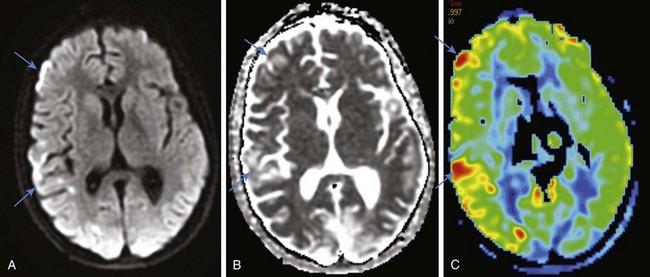
Figure 33-8 A 13-year-old boy affected by mitochondrial encephalomyopathy, lactic acidosis, and strokelike symptoms.
Select axial diffusion-weighted imaging (A), an axial apparent diffusion coefficient map (B), and an axial arterial spin labeling color map (C) are shown. Scattered foci of vasogenic edema corresponding to increased perfusion are identified in the acute phase of the disease in the right cerebral hemisphere.
Leigh Syndrome (Subacute Necrotizing Encephalomyelopathy)
Disorders arising from defects in nDNA are numerous; however, the most commonly encountered syndrome is Leigh syndrome. The genetic defect of Leigh syndrome can arise from several sources, including pyruvate dehydrogenase complex deficiency, complex I deficiency, complex V deficiency with adenosine triphosphatase 6 mutation, and cytochrome oxidase deficiency with SURF1 mutation. This group of disorders characteristically presents at 3 months to 2 years of age but may begin with symptoms of hypotonia in the newborn period or even in adulthood. Clinical signs include ophthalmoplegia, cerebellar signs, and spasticity, which are slowly progressive. Other features include psychomotor regression, extrapyramidal signs, blindness, nystagmus, respiratory compromise, or cranial nerve palsies. Onset of symptoms within the first years of life typically portends a rapid downhill course. A later onset of symptoms is generally associated with slower progression (Fig. 33-9 and e-Fig. 33-10).
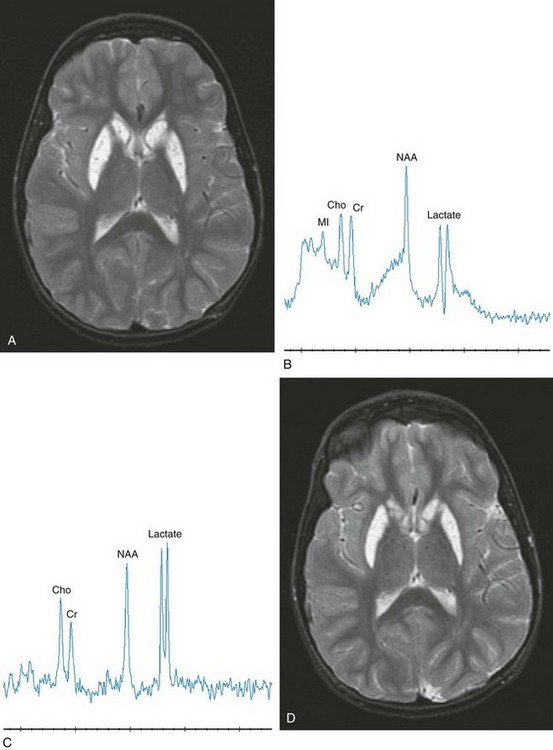
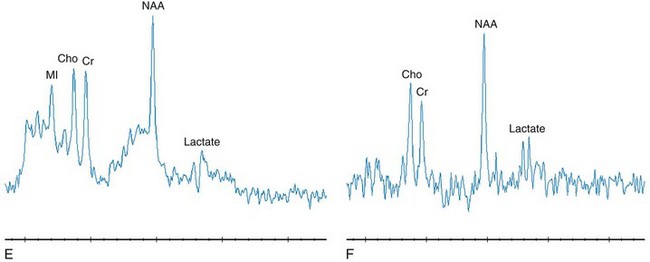
Figure 33-9 A complex I deficiency with magnetic resonance examinations in an 8-year-old girl acquired approximately 3 months apart.
Axial T2-weighted (A), short echo magnetic resonance spectroscopy (MRS) (B), and long echo MRS (C) images were obtained. The imaging reveals a pattern characteristic of “Leigh syndrome” with an abnormal hyperintense signal bilaterally within the caudate and globus pallidus. The MRS image acquired in the left basal ganglia at a period of clinical exacerbation caused by febrile illness demonstrates a dramatic elevation of lactate compared with her routinely observed levels as shown in axial T2-weighted (D), short echo MRS (E), and long echo MRS (F) images. The spectra acquired 3 months later demonstrates a significant reduction in lactate. A comparison of the imaging data is unremarkable between the examinations. The dramatic elevation of lactate revealed on MRS in B and C corresponds to worsening clinical symptoms (seizures and leg stiffening). The lactate levels observed in E and F are typical and consistent with this mitochondrial defect. (From Cecil KM. MR spectroscopy of metabolic disorders. Neuroimaging Clin N Am. 2006;16:87-116; used with permission.)
e-Figure 33-10 A complex I deficiency acquired in a 4-year-old girl.
Note the dramatic differences in the imaging and spectroscopy compared with the previous figure. An axial T2-weighted image (A), a short echo magnetic resonance spectroscopy (MRS) image in the frontal white matter (B), a long echo MRS image in the frontal white matter (C), and a long echo MRS image in the posterior cortex parasagittally (D) are shown. The imaging reveals an abnormal hyperintense signal within the white matter of frontal lobe, including the U fibers but sparing the internal capsule with enlarged ventricles, suggesting volume loss of the caudates. Within the frontal lobe, decreased N-acetylaspartate with lactate, choline, and myo-inositol elevations are seen, representing mitochondrial dysfunction, demyelination, axonal loss, and astrocytosis. The sampled spectrum within the posterior cortex is unremarkable. (From Cecil KM. MR spectroscopy of metabolic disorders. Neuroimaging Clin N Am. 2006;16:87-116; used with permission.)
Pantothenate Kinase-Associated Neurodegeneration
Pantothenate kinase-associated neurodegeneration, also called neurodegeneration with brain iron accumulation (NBIA), is caused by mutations in the gene that encodes pantothenate kinase 2 (PANK2). PANK2 is necessary for the production of coenzyme A in mitochondria. Other similar mutations result in atypical presentations of the same syndrome. “Classic” NBIA has an early onset of disease in infancy, with rapid progression of gait impairment, development of choreoathetoid movements, rigidity, dysarthria, and cognitive decline. Dystonia is a prominent feature of this disorder. All of these clinical manifestations reflect the impact of the disease upon the basal ganglia and striatum. Atypical NBIA has a later presentation with slower progression (Fig. 33-11).
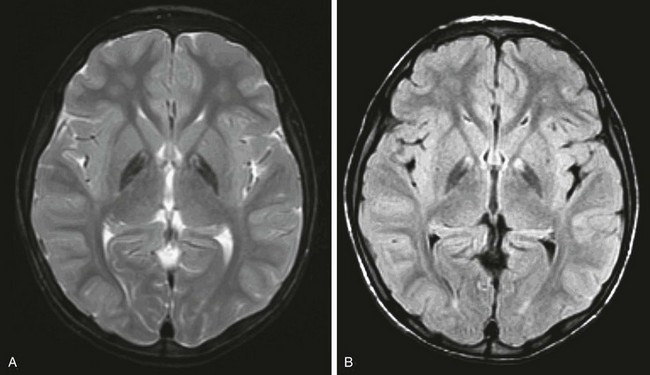
Figure 33-11 A 6-year-old girl with pantothenate kinase-associated neurodegeneration or neurodegeneration with brain iron accumulation, traditionally referred to as Hallervorden-Spatz syndrome.
Axial T2-weighted (A) and axial fluid-attenuated inversion recovery (B) images are shown. An abnormal hypointense signal is demonstrated bilaterally in the globus pallidus.
Menkes Disease
Plain radiographs may demonstrate wormian bones in the skull, rib fractures, and metaphyseal infarctions in long bones. Neuroimaging findings include cerebral volume loss and subdural collections, and cerebral angiography shows dilated and tortuous vessels within the circle of Willis. Basal ganglia lesions have been reported in advanced stages; however, a case documented basal ganglia involvement in a patient in the early stages of Menkes disease.26 A hyperintense signal within white matter on T2-weighted images indicates a lack of myelination with this disorder, but this finding may be related to a relative lack of blood flow as a result of the vascular involvement. The combination of extracerebral collections and metaphyseal infarctions may simulate battered child syndrome (Fig. 33-12).
Organic and Amino Acid Disorders
Glutaric Aciduria
Brain MRI demonstrates hyperintensity on T2-weighted images in the basal ganglia, especially the putamen, but also in the caudate nucleus and globus pallidus. Myelination is delayed. Bilateral temporal arachnoid cysts and enlarged frontotemporal spaces with subdural hematomas may be found. As a consequence, this rare disorder is sometimes considered as a differential diagnosis in children with nonaccidental trauma. The development of T2 prolongation in the basal ganglia and periventricular white matter would support the diagnosis of glutaric aciduria type I in such cases. The enlargement of extraaxial spaces makes glutaric aciduria type I one of the metabolic diseases associated with macrocrania. Unlike in Alexander disease and Canavan disease, the macrocrania does not reflect megalencephaly. Enlargement of the sylvian fissure has been correlated with severity of the enzyme deficiency. Acute striatal necrosis is the main cause of death during infancy; it can be visualized as usually symmetric, strokelike signal hyperintensity on T2-weighted and diffusion-weighted MRI, bilateral striatal lucency on CT, or a sharp decline of fluorodeoxyglucose uptake on positron emission tomography.27 Prenatal MRI has been shown to be useful in identifying GA1, revealing focal reduction of the anterior pole of both temporal lobes with widening of the liquoral space28 (Fig. 33-13).
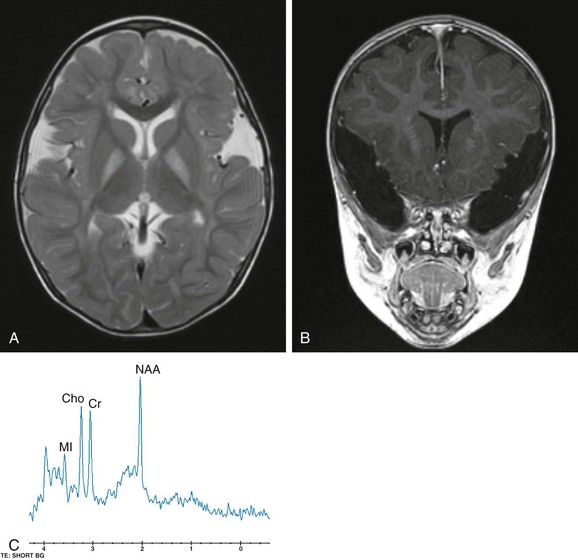
Figure 33-13 Glutaric aciduria I in a 22-month-old boy.
A, An axial fast spin echo T2-weighted image demonstrates a hyperintense signal bilaterally within the globus pallidus. B, A coronal spoiled gradient echo image features the prominent symmetric, bilateral widening of the sylvian fissures with frontotemporal hypoplasia. C, A short echo (time to echo 35 msec) magnetic resonance spectroscopy image acquired within the basal ganglia demonstrates an elevation of choline.
Methylmalonic and Proprionic Acidemias
Methylmalonic acidemia results from a deficiency in methylmalonyl CoA mutase, an enzyme required for the conversion of methylmalonic CoA to succinyl CoA, which is necessary for the proper metabolism of the amino acids methionine, threonine, isoleucine, and valine. The high levels of methylmalonic acid resulting from the enzyme deficiency inhibit succinate dehydrogenase, which disrupts aerobic metabolism in the mitochondria. A relatively milder form of the disease is caused by deficiency of the cobalamin coenzyme. Propionic aciduria is a result of a deficiency in propionyl-CoA carboxylase and presents in a similar fashion (e-Fig. 33-14).
e-Figure 33-14 A 2-year-old boy with propionic aciduria.
A select axial T2-weighted fast spin echo image (A) and a coronal fluid-attenuated inversion recovery image (B) reveal an abnormal hyperintense signal bilaterally within the putamen without evidence of volume loss.
Epilepsy is common in patients with methylmalonic acidemia, and cardiac involvement, including cardiomyopathy, arrhythmias, carnitine deficiency, and structural heart disease, have been reported.29,30 Hyperglycemia also has been reported.31 On imaging, parenchymal volume often is decreased, with delays in myelination. Optic neuropathy also has been reported.32 Like other mitochondrial-based syndromes, the organic acidemias have a strong tendency to cause lesions in the basal ganglia, most particularly the globus pallidus. Lesions in the globus pallidus are striking in their stereotypical appearance from patient to patient. Affected areas will appear low in attenuation on CT and hyperintense on T2-weighted MRI. Strokelike episodes similar to MELAS occasionally may be encountered. DWI will show restricted diffusion in affected regions. Proton MRS has shown decreases in NAA and elevation of lactate levels. Lactate elevation also can be found in the CSF, which is important for narrowing the differential diagnosis.
Phenylketonuria
Brain MRI appearances initially demonstrate symmetric hyperintense areas on T2-weighted images in the periatrial white matter. Extension occurs into the optic radiations and periventricular frontal white matter with more severe involvement and contrast enhancement. In untreated patients, it has been reported that diffuse white matter pathology is evidence of hypomyelination; however, white matter abnormalities in patients who are treated early are indicative of intramyelinic edema.33 Hyperintensity in multiple areas on T1-weighted images has been reported, corresponding to subcortical parenchymal calcification.
Maple Syrup Urine Disease
MSUD is a rare autosomal-recessive disorder caused by defective oxidative decarboxylation of three branched-chain amino acids: valine, isoleucine, and leucine. The accumulation of metabolites in the urine leads to the characteristic odor, which resembles that of maple syrup. Although cerebral imaging findings initially may be unremarkable, diffuse cerebral edema develops with subsequent residual areas of hyperintensity in the dorsal brainstem and pons. Proton MRS of the brain appears to be useful for examining patients who have MSUD in different metabolic states. The accumulation of abnormal branched-chain amino acids and branched-chain alpha-ketoacids appear as a broad peak at 0.9 ppm accompanied by an elevated lactate level. The presence of cytotoxic or intramyelinic edema as evidenced by restricted water diffusion on DWI, with the presence of lactate on spectroscopy, could imply cell death. However, in the context of metabolic decompensation in MSUD, it appears that changes in cell osmolarity and metabolism can reverse completely after metabolic correction. Classification of MSUD includes a form that is responsive to thiamine (Fig. 33-15).
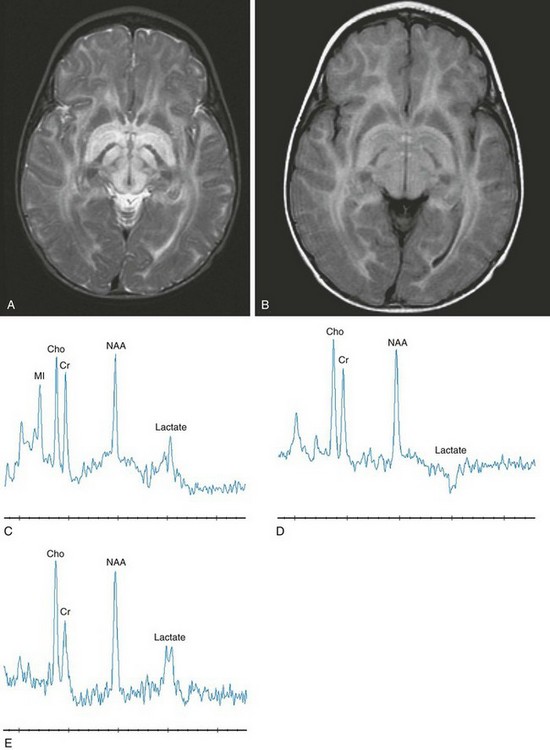
Figure 33-15 An infant with maple syrup urine disease.
Axial T2-weighted (A), axial fluid-attenuated inversion recovery (B), short echo magnetic resonance spectroscopy (MRS) (C), intermediate echo MRS (D), and long echo MRS (E) images reveal an abnormal signal within the brainstem, internal capsule, and globus pallidus. On short echo MRS, a composite of branched chain amino acids (0.9 ppm) with lactate (1.35 ppm) is inverted on intermediate echo and upright on long echo MRS. Notice the reduced signal intensity associated with the inversion at time to echo (TE) 144 with partial restoration of the signal intensity at TE 288. (From Cecil KM. MR spectroscopy of metabolic disorders. Neuroimaging Clin N Am. 2006;16:87-116; used with permission.)
Nonketotic Hyperglycinemia
Pathology in nonketotic hyperglycinemia is characterized by vacuolation, astrocytosis, and demyelination, also called vacuolating myelinopathy. Because these changes only occur in myelinated white matter, in the neonate they are restricted to the dorsal limbs of the internal capsule, dorsal brainstem, pyramidal tracts in the coronal radiata, and lateral thalamus. A long tractlike lesion involving the spinal cord has been reported in persons with late-onset disease.34 On MR, these areas will show a hyperintense signal on T2-weighted images and restricted diffusion on DWI. Volume loss ensues and may be present at birth as a result of the toxic effects of glycine in utero. Proton MRS can detect the accumulated glycine itself, as a distinct resonance at 3.55 ppm. In patients with nonketotic hyperglycinemia, elevated cerebral glycine can be measured with proton MRS. Using long echo times, such as 288 ms, MRS reveals glycine at 3.5 ppm. With use of short echo times, the resonance at 3.5 is a composite of mI and glycine. Select metabolite ratios (NAA, mI, and glycine) appear to correlate with the patient’s course (Fig. 33-16).
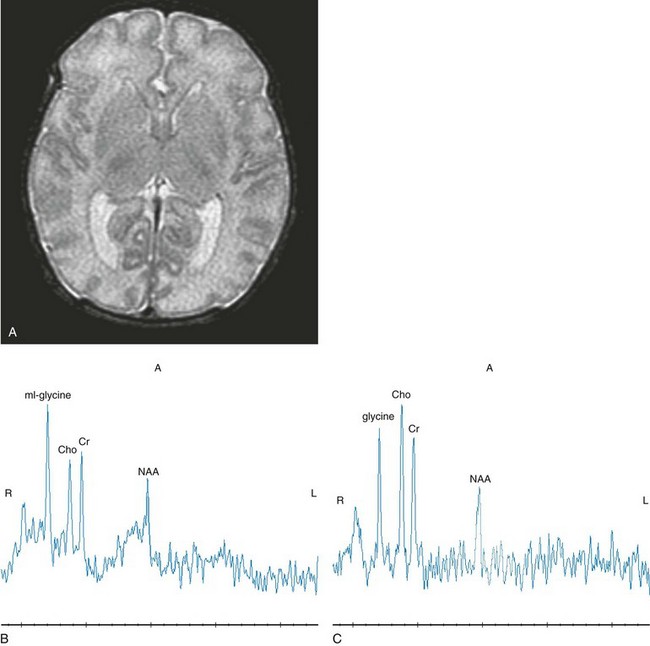
Figure 33-16 A neonate with nonketotic hyperglycinemia.
Axial T2-weighted (A), short echo magnetic resonance spectroscopy (MRS) (B), and intermediate (144 msec) MRS (C) images are shown. The short echo spectrum demonstrates a composite myo-inositol and glycine resonance at 3.5 ppm. The intermediate echo demonstrates glycine. (From Cecil KM. MR spectroscopy of metabolic disorders. Neuroimaging Clin N Am. 2006;16:87-116; used with permission.)
Primary Disorders of White Matter (Leukodystrophies)
Canavan Disease
The MRI findings are related to the myelin degeneration of the white matter tracts. The first change detected is hyperintensity on T2-weighted images of the subcortical U fibers. Eventually there is diffuse involvement of all the white matter fiber tracts in both cerebral hemispheres. In the later stages of the disease, volume loss of the cerebral hemispheres occurs. Enlarged perivascular spaces, likely reflecting spongiform degeneration of the white matter, has been described in one patient.35 MRS demonstrates marked elevation of the NAA peak, which is diagnostic for Canavan disease (Fig. 33-17).
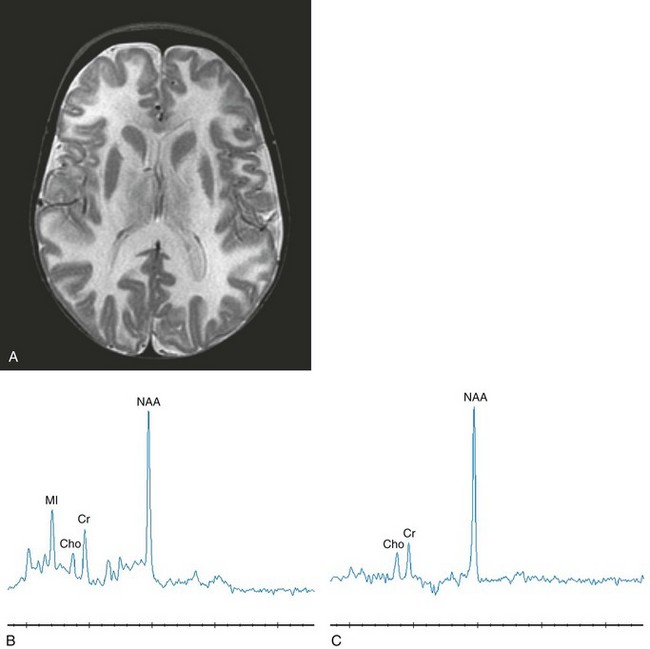
Figure 33-17 A 12-month-old girl with Canavan disease.
Select axial T2-weighted (A), short echo magnetic resonance spectroscopy (MRS) (B), and long echo MRS (C) images are shown. Diffuse hypomyelination is revealed on the T2-weighted image. Elevated N-acetylaspartate (NAA) is the key feature with secondary myo-inositol elevation representing gliosis. Because of the deficiency in aspartoacylase, NAA accumulates in the mitochondria, impairing myelin synthesis. (From Cecil KM. MR spectroscopy of metabolic disorders. Neuroimaging Clin N Am. 2006;16:87-116; with permission.)
Alexander Disease
The diagnosis traditionally has been performed via a brain biopsy. The predominant histologic feature is a considerable amount of Rosenthal fibers within the white matter. Most commonly, the disease begins in the periventricular white matter, usually involving the frontal lobes and then extending into the parietotemporal and then the occipital regions. Eventually, involvement of the cerebellar white matter and spinal cord occurs. CSF oligoclonal bands have been reported in the adult-onset variant.36
The MRI findings demonstrate macrocephaly with hyperintensity on T2-weighted images involving the white matter areas, which commonly is seen in the frontal areas with progression posteriorly to involve other parts of the cerebral hemispheres. According to van der Knapp et al.,37 the findings of frontal predominance, a periventricular rim of high-T2/low-T1 signal, involved central gray matter and brainstem, plus enhancement of portions of the involved areas are very characteristic of this disease (Fig. 33-18).
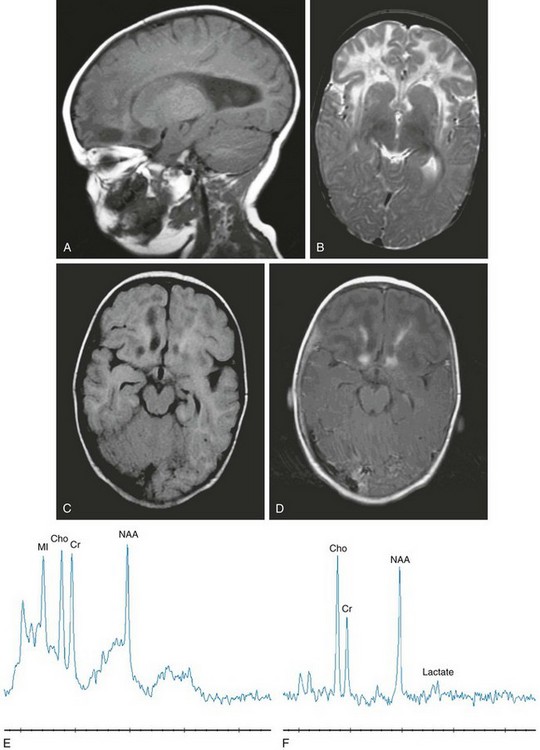
Figure 33-18 An 8-month-old girl with Alexander disease.
Select sagittal T1-weighted (A), axial T2-weighted (B), axial fluid-attenuated inversion recovery (FLAIR) (C), axial T1-weighted postcontrast (D), short echo magnetic resonance spectroscopy (MRS) (E), and long echo MRS (F) images were acquired in the frontal white matter. The deep frontal and periventricular white matter demonstrate a hypointense T1-weighted and hyperintense T2-weighted signal. The frontal lobe cavitations are revealed on the FLAIR image with hypointense signal and demonstrate enhancement at the borders. Volume enlargement of the caudate heads is seen. Decreased N-acetylaspartate with lactate, choline, and myo-inositol elevations representing macrophage infiltration, demyelination, and astrocytosis are indicated from the MRS image.
van der Knapp et al38 identified five characteristics of Alexander disease on MRI that can be applied to suspected cases to make a presumptive diagnosis. These characteristics are (1) extensive cerebral white matter changes with frontal predominance, (2) a periventricular rim with a high signal on T1-weighted images and a low signal on T2-weighted images, (3) signal abnormalities with swelling or volume loss in the basal ganglia and thalami, (4) brainstem signal abnormalities, and (5) contrast enhancement of one or more of the following structures: ventricular lining, periventricular rim of tissue, white matter of the frontal lobes, optic chiasm, fornix, basal ganglia, thalamus, dentate nucleus, or brainstem structures. Although many of these abnormalities may be seen in other leukodystrophies, the association of four or more appears to be relatively specific for Alexander disease. The extent and pattern of contrast enhancement and the distinctive periventricular rim of abnormal signal are not encountered in many other processes. This leukodystrophy is one of the few in which the administration of contrast material provides specific additional information that can lead to the correct diagnosis by imaging.
Brockmann et al.39 used localized proton MRS to assess metabolic abnormalities in gray and white matter, basal ganglia, and cerebellum of four patients with infantile Alexander disease identified with heterozygous de novo mutations in the gene-encoding GFAP. Elevated concentrations of mI in conjunction with normal or increased choline compounds in gray and white matter, basal ganglia, and cerebellum point to astrocytosis and demyelination. Neuroaxonal degeneration, as reflected by a reduction of NAA, was most pronounced in cerebral and cerebellar white matter.
Megalencephalic Leukoencephalopathy with Subcortical Cysts
Megaloencephalic leukoencephalopathy with subcortical cysts typically presents in infancy or childhood with macrocrania, developmental delay, seizures, and motor disability. MRI demonstrates widespread signal abnormalities throughout the white matter, with sparing of deep structures. Cysts typically are identified in the subcortical temporal lobes and less frequently in the frontal, parietal, or occipital lobes. Despite the extensive abnormalities on imaging, many affected patients achieve a high level of normal function. The genetic source of the condition has been traced to a gene on the long arm of chromosome 22 (22q13.33), the MLC1 gene. The disease is inherited in an autosomal-recessive pattern, and because of the variable phenotype, identification of a single case should prompt further investigation and genetic counseling (e-Fig. 33-19).
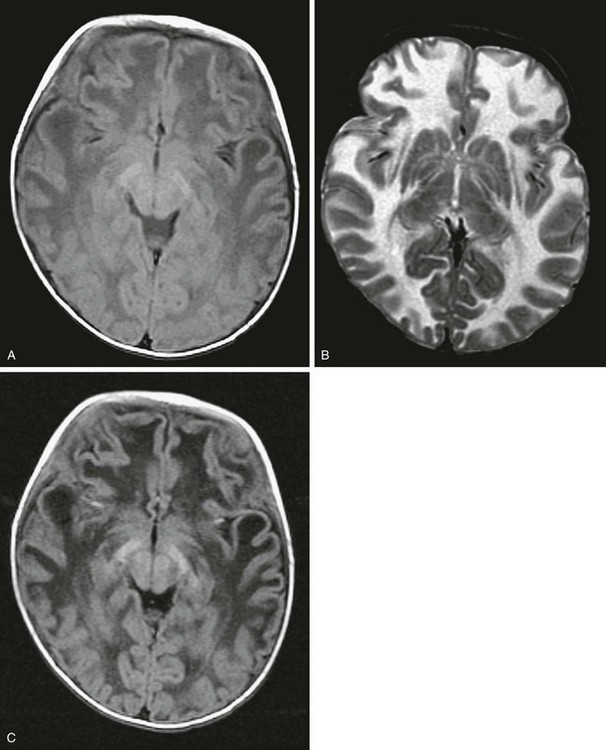
e-Figure 33-19 A 7-month-old boy with megaencephalic leukoencephalopathy with subcortical cysts.
Axial T1-weighted (A), axial T2-weighted (B), and axial fluid-attenuated inversion recovery (FLAIR) (C) images are shown. A decreased signal throughout the hemispheric white matter is demonstrated on the T1-weighted and FLAIR images, with a corresponding hyperintense signal on the T2-weighted images. The basal ganglia are spared.
Leukoencephalopathy with Brainstem and Spinal Cord Involvement and Elevated White Matter Lactate
Leukoencephalopathy with brainstem and spinal cord involvement and elevated white matter lactate recently has been described based on the MRI characteristics. Initial childhood development is generally unremarkable; the onset of presentation for leukoencephalopathy with brainstem and spinal cord involvement and elevated white matter lactate occurs in childhood with motor deterioration. The MRI pattern is quite distinct. The progressive white matter abnormalities spread from the periventricular region outward with sparing of the subcortical U fibers. The corpus callosum is affected with posterior preference. The pyramidal tracts are affected over their entire length from the posterior limb of the internal capsule and brainstem into the lateral corticospinal tracts of the spinal cord. The sensory tracts are involved from the dorsal columns in the spinal cord, the medial lemniscus through the brainstem up to the level of the thalamus, and the corona radiata above the level of the thalamus. The cerebellar involvement progresses over time to the point of significant volume loss. Clinical severity and the extent of neurologic abnormalities on MRI do not appear to correlate40 (e-Fig. 33-20).
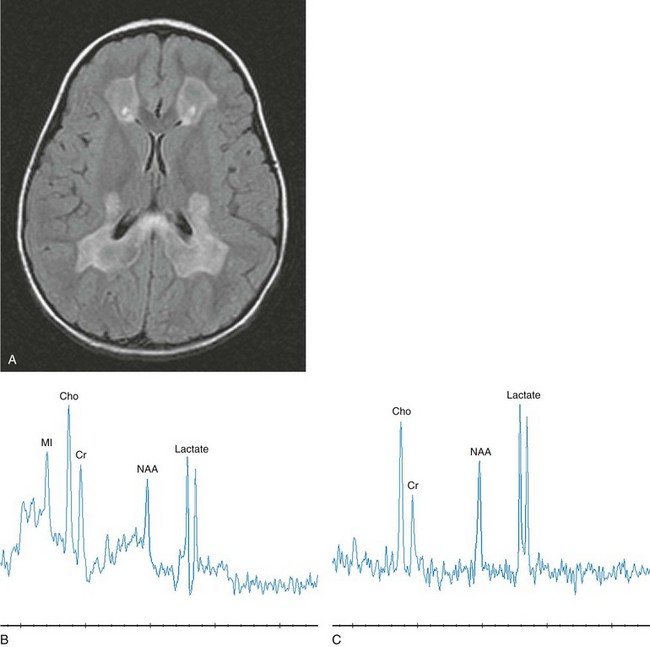
e-Figure 33-20 A 2-year-old girl with leukodystrophy with brainstem and spinal cord involvement and high lactate levels.
Axial T2-weighted (A), short echo magnetic resonance spectroscopy (MRS) (B), and long echo MRS (C) images are shown. The T2-weighted image (A) reveals a confluent, hyperintense signal in the central white matter with sparing of subcortical U fibers. Elevated lactate, choline, and myo-inositol levels with diminished N-acetylaspartate are demonstrated in white matter regions with an abnormal signal. Not shown are normal spectra from unaffected gray matter. (From Cecil KM. MR spectroscopy of metabolic disorders. Neuroimaging Clin N Am. 2006;16:87-116; used with permission.)
Galactosemia
Galactosemia is the result of a deficiency in galactose-1-phosphate uridyl transferase, which is an enzyme essential for the metabolism of galactose. It presents in infants soon after the introduction of cow’s milk into the diet. Clinical features include failure to thrive, hepatomegaly with jaundice, vomiting and diarrhea, cataracts, increased ICP, and mental deterioration. It can be identified by the presence of increased reducing substances in the stool. Neurologic dysfunction is the result of hypoglycemia and the accumulation of galactose, galactose-1-phosphate, and galactitol in the brain and eye. In adult forms, low bone density often is observed.41
Creatine Deficiency
Inborn errors of creatine metabolism, specifically defects in creatine synthesis and transport, recently have been reported. In many brain structures, including the cortex and basal ganglia, arginine glycine amidinotransferase (AGAT) and guanidinoacetate methyltransferase (GAMT) are expressed in a disassociated way rather than being coexpressed, leading to the thought that guanidinoacetate must be transported from AGAT to GAMT.42 Proton MRS clinical studies have led to the discovery of three creatine deficiency syndromes: creatine transporter deficiency syndrome, AGAT deficiency, and (3) GAMT deficiency. Several patients have been found to have a markedly diminished or absent creatine signal with proton MRS. If proton MRS reveals the absence of creatine in the brain, serum and urine creatine assessments may give a preliminary indication of whether there is a synthesis defect (diminished creatine) or a transport defect (elevated creatine). In cases of synthesis defects, proton MRS can monitor increasing brain creatine concentration with oral supplementation, which offers improvement of some symptoms but not recovery of normal function (Fig. 33-21).
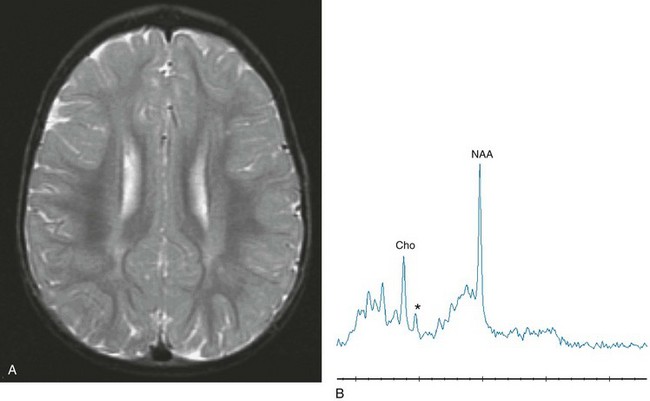
Figure 33-21 A 2-year-old boy with a known mutation of the creatine transporter.
Axial T2-weighted (A) and short echo magnetic resonance spectroscopy (B) images reveal an abnormal signal within the periventricular white matter, representing hypomyelination. Short echo spectroscopy reveals a marked reduction of creatine signal (asterisk).
Miscellaneous White Matter Disorders
Pelizaeus-Merzbacher Disease and Disorders of Myelin Proteolipid Protein
Diffusion tensor imaging has been reported to be effective for detecting subtle changes in the microstructure of the white matter, such as abnormal myelination, even when findings of MRI and MRS are normal.43
Diminished values of NAA and mild elevations of choline have been reported when MRS is performed in patients with PMD, indicating axonal injury and secondary gliosis. Plecko et al.44 found heterogeneous cerebral metabolite patterns in patients with PMD and Pelizaeus-Merzbacher–like disease, indicating a mixture of unspecific changes as a result of primary hypomyelination and secondary gliosis and demyelination. However, neither MRI nor MRS provided unique patterns to allow differentiation between patients with PMD and Pelizaeus-Merzbacher–like disease.
Other Disorders Affecting the Basal Ganglia
Huntington disease (HD) is an autosomal-recessive degenerative disorder that is uncommon in children, with most cases presenting after the fourth decade. HD is characterized by a movement disorder. Cerebellar symptoms, seizures, rigidity, and mental retardation are common. Caudate volume loss is demonstrated on MRI, although cortical changes also may be detected.45 Bilateral areas of hyperintensity may be seen in the basal ganglion on T2-weighted images. Global atrophy in persons with HD shows a disproportionate relationship to caudate involvement.46 In pre-HD, gray matter change has been reported to be specific to regions consistent with basal ganglia-thalamocortical pathways, whereas white matter changes were much more generalized.47 White matter diffusivity abnormalities also have been reported in the corpus callosum and external/extreme capsules.48 In premanifest gene carriers, the white matter pathway of the sensorimotor cortex is impaired.49 Changes in the hypothalamic region have been reported in prodromal HD and appear to be one of the earliest evident features of this disease.50
Fahr Disease
Fahr disease comprises a group of disorders that have basal ganglia calcification. Mental deterioration and growth retardation have been described. Cerebral MRI demonstrates areas of signal void within the basal nuclei and dentate nuclei on T1- and T2-weighted images. The appearances correlate with the areas of calcification on CT. Transcranial sonography also has been reported to be useful for visualizing calcifications of the basal ganglia.51
Wilson Disease
On CT, the basal ganglia are typically low in attenuation, especially the globus pallidus and putamen arising from copper accumulation. Volume loss of these structures eventually follows. The white matter also may appear low in attenuation, with volume loss eventually leading to compensatory dilatation of the lateral ventricles. On MRI, the basal ganglia are hyperintense on T1-weighted images and the first echo of the T2-weighted sequence, as seen with other causes of hepatic dysfunction. These same regions typically are hyperintense on T2-weighted images early in the course of the disease, but the hyperintense signal may decrease late in the disease associated with an increase in signal on the T1-weighted images. The white matter demonstrates progressive increase in T2-signal as a result of demyelination and gliosis. Corpus callosum abnormalities also have been reported.52 The presence of signal changes involving the basal ganglia, thalami, and brainstem; the “face of giant panda” sign; midbrain tectal plate signal changes; or central pontine myelinolysis-like changes all can be considered to be diagnostic of Wilson disease.53
Dali, C, Hanson, LG, Barton, NW, et al. Brain N-acetylaspartate levels correlate with motor function in metachromatic leukodystrophy. Neurology. 2010;75(21):1896–1903.
Ergül, Y, Ni li, K, Sagygili, A, et al. Kearns-Sayre syndrome presenting as somatomedin C deficiency and complete heart block. Turk Kardiyol Dern Ars. 2010;38(8):568–571.
Kamate, M, Hattiholi, V. Normal neuroimaging in early-onset Krabbe disease. Pediatr Neurol. 2011;44(5):374–376.
Miller, E, Widjaja, E, Nilsson, D, et al. Magnetic resonance imaging of a unique mutation in a family with Pelizaeus–Merzbacher disease. Am J Med Genet A. 2010;152A:748–752.
Toscano, M, Canevelli, M, Giacomelli, E, et al. Transcranial sonography of basal ganglia in calcifications in Fahr disease. J Ultrasound Med. 2011;30(7):1032–1033.
References
1. Caciotti, A, Garman, SC, Rivera-Colon, Y, et al. GM1 gangliosidosis and Morquio B disease: an update on genetic alterations and clinical findings. Biochi Biophys Acta. 2011;1812(7):782–790.
2. Dweikat, I, Libdeh, BA, Murrar, H, et al. Gm1 gangliosidosis associated with neonatal-onset of diffuse ecchymoses and mongolian spots. Indian J Dermatol. 2011;56(1):98–100.
3. Sharma, S, Sankhyan, N, Kabra, M, et al. Teaching neuroimages: T2 hypointense thalami in infantile GM1 gangliosidosis. Neurology. 2010;74(12):e47.
4. Delnooz, CC, Lefeber, DJ, Langemeijer, SM, et al. New cases of adult-onset Sandhoff disease with a cerebellar or lower motor neuron phenotype. J Neurol Neurosurg Psychiatry. 2010;81(9):968–972.
5. Aydin, K, Bakir, B, Tatli, B, et al. Proton MR spectroscopy in three children with Tay-Sachs disease. Pediatr Radiol. 2005;35:1081–1085.
6. Hayase, T, Shimizu, J, Goto, T, et al. Unilaterally and rapidly progressing white matter lesion and elevated cytokines in a patient with Tay-Sachs disease. Brain Dev. 2010;32(3):244–247.
7. Bano, S, Prasad, A, Yadav, SN, et al. Neuroradiological findings in GM2 gangliosidosis variant B1. J Pediatr Neurosci. 2011;6(2):110–113.
8. Le, NM, Parikh, S. Late infantile neuronal ceroid lipofuscinosis and dopamine deficiency. J Child Neurol. 2012;27(2):234–237.
9. Kamate, M, Hattiholi, V. Novel neuroimaging finding in palmitoyl protein thioesterase-1 related neuronal ceroid lipofuscinosis. Pediatr Neurol. 2012;46(5):325–328.
10. Yavuz, H, Yükeskkaya, A. Intestinal involvement in metachromatic leukodystrophy. J Child Neurol. 2011;26:117–120.
11. Gieselmann, V, Krägeloh-Mann, I. Metachromatic leukodystrophy—an update. Neuropediatrics. 2010;41(1):1–6.
12. Dali, C, Hanson, LG, Barton, NW, et al. Brain N-acetylaspartate levels correlate with motor function in metachromatic leukodystrophy. Neurology. 2010;75(21):1896–1903.
13. Duffner, PK, Barczykowski, A, Kay, DM, et al. Later onset phenotypes of Krabbe disease: results of the world-wide registry. Pediatr Neurol. 2012;46(5):298–306.
14. Brodsky, MC, Hunter, JS. Positional ocular flutter and thickened optic nerves as sentinel signs of Krabbe disease. J AAPOS. 2011;15(6):595–597.
15. Kohlschütter, A, Eichler, F. Childhood leukodystrophies: a clinical perspective. Expert Rev Neurother. 2011;11:1485–1496.
16. Kamate, M, Hattiholi, V. Normal neuroimaging in early-onset Krabbe disease. Pediatr Neurol. 2011;44(5):374–376.
17. Hussain, SA, Zimmerman, HH, Abdul-Rahman, OA, et al. Optic nerve enlargement in Krabbe disease: a pathophysiologic and clinical perspective. J Child Neurol. 2011;26(5):642–644.
18. Takenouchi, T, Raju, GP. Germinal matrix hemorrhage in Zellweger syndrome. J Child Nerurol. 2010;25(11):1398–1400.
19. Kulkarni, KS, Baranano, KW, Lin, DD, et al. Contrast enhancement of brainstem tracts in Zellweger spectrum disorder: evidence of inflammatory demyelination? Neuropediatrics. 2011;42(1):32–34.
20. Bansal, AR, Baheti, NN, Rathore, C, et al. Teaching neuroimages: adrenoleukodystrophy presenting as raised intracranial pressure. Neurology. 2010;74(21):e93.
21. Ergül, Y, Ni li, K, Sagygili, A, et al. Kearns-Sayre syndrome presenting as somatomedin C deficiency and complete heart block. Turk Kardiyol Dern Ars. 2010;38(8):568–571.
22. Spector, R, Johanson, CE. Choroid plexus failure in the Kearns-Sayre syndrome. Cerebrospinal Fluid Res. 2010;7:14.
23. Phadke, M, Lokeshwar, MR, Bhutada, S, et al. Kearns Sayre syndrome—case report with review of the literature. Indian J Pediatr. 2012;79(5):650–654.
24. Tsujokawa, T, Yoneda, M, Shimizu, Y, et al. Pathophysiologic evaluation of MELAS strokes by serially quantified MRS and CASL perfusion images. Brain Dev. 2010;32(2):143–149.
25. Kim, JH, Lim, MK, Jeon, TY, et al. Diffusion and perfusion characteristics of MELAS (mitochondrial myopathy, encephalopathy, lactic acidosis, and stroke-like episode) in thirteen patients. Korean J Radiol. 2011;12(1):15–24.
26. Koprivsek, K, Lucic, M, Kozic, D, et al. Basal ganglia lesions in the early stage of Menkes disease. J Inherit Metab Dis. 2010;33:301–302.
27. Sen, A, Pillay, RS. Striatal necrosis in type 1 glutaric aciduria: different stages in two siblings. J Pediatr Neurosci. 2011;6(2):146–148.
28. Righini, A, Fiori, L, Parazzini, C, et al. Early prenatal magnetic resonance imaging of glutaric aciduria type 1: case report. J Comput Assist Tomogr. 2010;34(3):446–448.
29. Ma, X, Zhang, Y, Yang, Y, et al. Epilepsy in children with methylmalonic academia: electroclinical features and prognosis. Brain Dev. 2011;33:790–795.
30. Prada, CE, Al Jasmi, F, Kirk, EP, et al. Cardiac disease in methylmalonic academia. J Pediatr. 2011;159:862–864.
31. Imen, M, Hanene, B, Ichraf, K, et al. Methylmalonic academia and hyperglycemia: an unusual association. Brain Dev. 2012;34:113–114.
32. Traber, G, Baumgartner, MR, Schwarz, U, et al. Subacute bilateral visual loss in methylamalonic acidemia. J Neuro Opthalmol. 2011;31:344–346.
33. Anderson, PJ, Leuzzi, V. White matter pathology in phenylketonuria. Mol Genet Metab. 2010;99:3–9.
34. Wei, SH, Weng, WC, Lee, NC, et al. Unusual spinal cord lesions in late-onset non-ketoic hyperglycinemia. J Child Neurol. 2011;26(7):900–903.
35. Pradhan, S, Goyal, G. Teaching neuroimages: honeycomb appearance of the brain in patient with Canavan disease. Neurology. 2011;76(13):e68.
36. Tschampa, HJ, Greschus, S, Vinahl, M, et al. MS-like presentation of Alexander disease with multifocal lesions and oligoclonal bands. J Neurol. 2011;258:935–937.
37. van der Knapp, MS, Salomons, GS, Li, R, et al. Unusual variants of Alexander’s disease. Ann Neurol. 2005;57:327–338.
38. van der Knaap, MS, Ramesh, V, Schiffmann, R, et al. Alexander disease: ventricular garlands and abnormalities of the medulla and spinal cord. Neurology. 2006;66:494–498.
39. Brockmann, K, Dechent, P, Meins, M, et al. Cerebral proton magnetic resonance spectroscopy in infantile Alexander disease. J Neurol. 2003;250:300–306.
40. Labauge, P, Dorboz, I, Eymard-Pierre, E, et al. Clinically asymptomatic adult patient with extensive LBSL MRI pattern and DARS2 mutations. J Neurol. 2011;258:335–337.
41. Batley, LA, Welt, CK, Rohr, F, et al. Skeletal health in adult patients with classic galactosemia. Osteoporos Int. 2013;24(2):501–509.
42. Braissant, O, Henry, H, Beard, E, et al. Creatine deficiency syndromes and the importance of creatine synthesis in the brain. Amino Acids. 2001;40:1315–1324.
43. Miller, E, Widjaja, E, Nilsson, D, et al. Magnetic resonance imaging of a unique mutation in a family with Pelizaeus–Merzbacher disease. Am J Med Genet A. 2010;152A:748–752.
44. Plecko, B, Stockler-Ipsiroglu, S, Gruber, S, et al. Degree of hypomyelination and magnetic resonance spectroscopy findings in patients with Pelizaeus Merzbacher phenotype. Neuropediatrics. 2003;34:127–136.
45. Caixeta, L. Huntington’s disease presenting as posterior cortical atrophy. Arq Neuropsiquiatr. 2011;69(2B)):407–408.
46. Hobbs, NZ, Barnes, J, Frost, C, et al. Onset and progression of pathologic atrophy in Huntington disease: Longitudinal MR imaging study. AJNR Am J Neuroradiol. 2010;31:1036–1041.
47. Stoffers, D, Sheldon, S, Kuperman, JM, et al. Contrasting gray and white matter changes in preclinical Huntington disease. Neurology. 2010;74:1208–1216.
48. Bohanna, I, Georgiou-Karistianis, N, Sritharan, A, et al. Diffusion tensor imaging in Huntington’s disease reveals distinct patterns of white matter degeneration associated with motor and cognitive deficits. Brain Imaging Behav. 2011;5:171–180.
49. Dumas, EM, van den Bogaard, SJ, Ruber, ME, et al. Early changes in white matter pathways of the sensorimotor cortex in premanifest Huntington’s disease. Hum Brain Mapp. 2012;33(1):203–212.
50. Soneson, C, Fontes, M, Zhou, Y, et al. Early changes in the hypothalamic region in prodromal Huntington disease revealed by MRI analysis. Neurobiol Dis. 2010;40(3):531–543.
51. Toscano, M, Canevelli, M, Giacomelli, E, et al. Transcranial sonography of basal ganglia in calcifications in Fahr disease. J Ultrasound Med. 2011;30:1030–1036.
52. Trocello, JM, Guichard, JP, Leyendecker, A, et al. Corpus callosum abnormalities in Wilson’s disease. J Neurol Neurosurg Psychiatry. 2011;82:1119–1121.
53. Prashanth, LK, Sinha, S, Taly, AB, et al. Do MRI features distinguish Wilson’s disease from other early onset extrapyramidal disorders? An analysis of 100 cases. Mov Disord. 2010;25(6):672–678.
[/level-membership-for-pediatrics-category][not-level-membership-for-pediatrics-category]Chapter 33
Inherited Metabolic and Neurodegenerative Disorders
Inherited Metabolic Brain Disorders
This chapter includes as a reference a large listing of metabolic brain diseases encountered in the imaging setting (see Tables 33-1 to 33-10). For convenience, the recognized metabolic or genetic defect and the patterns of inheritance are summarized. However, because of space limitations, the following discussion will address only the most commonly encountered of these rare disorders.
Table 33-1
OMIM, Online Mendelian Inheritance in Man Database; VLCFA, very-long-chain fatty acid.
Adapted From Cecil KM. MR spectroscopy of metabolic disorders. Neuroimaging Clin North Am 2006;16:87-116; used with permission. Data from The Johns Hopkins University, Online Mendelian Inheritance in Man (OMIM), McKusick-Nathans Institute for Genetic Medicine, Johns Hopkins University (Baltimore, MD) and the National Center for Biotechnology Information, National Library of Medicine (Bethesda, MD), 2000. Available at http://www.ncbi.nlm.nih.gov/omim/. Accessed October 2012.
Table 33-2
Adapted From Cecil KM. MR spectroscopy of metabolic disorders. Neuroimaging Clin N Am 2006;16:87-116; used with permission. Data from The Johns Hopkins University, Online Mendelian Inheritance in Man (OMIM), McKusick-Nathans Institute for Genetic Medicine, Johns Hopkins University (Baltimore, MD) and the National Center for Biotechnology Information, National Library of Medicine (Bethesda, MD), 2000. Available at http://www.ncbi.nlm.nih.gov/omim/. Accessed October 2012.
Table 33-3
DNA, Deoxyribonucleic acid; OMIM, online Mendelian Inheritance in Man Database.
Adapted From Cecil KM. MR spectroscopy of metabolic disorders. Neuroimaging Clin N Am 2006;16:87-116; used with permission. Data from The Johns Hopkins University, Online Mendelian Inheritance in Man (OMIM), McKusick-Nathans Institute for Genetic Medicine, Johns Hopkins University (Baltimore, MD) and the National Center for Biotechnology Information, National Library of Medicine (Bethesda, MD), 2000. Available at http://www.ncbi.nlm.nih.gov/omim/. Accessed October 2012.
Table 33-4
OMIM, Online Mendelian Inheritance in Man Database.
Adapted From Cecil KM. MR spectroscopy of metabolic disorders. Neuroimaging Clin N Am 2006;16:87-116; used with permission. Data from The Johns Hopkins University, Online Mendelian Inheritance in Man (OMIM), McKusick-Nathans Institute for Genetic Medicine, Johns Hopkins University (Baltimore, MD) and the National Center for Biotechnology Information, National Library of Medicine (Bethesda, MD), 2000. Available at http://www.ncbi.nlm.nih.gov/omim/. Accessed October 2012.
Table 33-5
OMIM, Online Mendelian Inheritance in Man Database.
Adapted From Cecil KM. MR spectroscopy of metabolic disorders. Neuroimaging Clin N Am 2006;16:87-116; used with permission. Data from The Johns Hopkins University, Online Mendelian Inheritance in Man (OMIM), McKusick-Nathans Institute for Genetic Medicine, Johns Hopkins University (Baltimore, MD) and the National Center for Biotechnology Information, National Library of Medicine (Bethesda, MD), 2000. Available at http://www.ncbi.nlm.nih.gov/omim/. Accessed October 2012.
Table 33-6
Adapted From Cecil KM. MR spectroscopy of metabolic disorders. Neuroimaging Clin N Am 2006;16:87-116; used with permission. Data from The Johns Hopkins University, Online Mendelian Inheritance in Man (OMIM), McKusick-Nathans Institute for Genetic Medicine, Johns Hopkins University (Baltimore, MD) and the National Center for Biotechnology Information, National Library of Medicine (Bethesda, MD), 2000. Available at http://www.ncbi.nlm.nih.gov/omim/. Accessed October 2012.
Table 33-7
OMIM, Online Mendelian Inheritance in Man Database.
Adapted From Cecil KM. MR spectroscopy of metabolic disorders. Neuroimaging Clin N Am 2006;16:87-116; used with permission. Data from The Johns Hopkins University, Online Mendelian Inheritance in Man (OMIM), McKusick-Nathans Institute for Genetic Medicine, Johns Hopkins University (Baltimore, MD) and the National Center for Biotechnology Information, National Library of Medicine (Bethesda, MD), 2000. Available at http://www.ncbi.nlm.nih.gov/omim/. Accessed October 2012.
Table 33-8
OMIM, Online Mendelian Inheritance in Man Database.
Adapted From Cecil KM. MR spectroscopy of metabolic disorders. Neuroimaging Clin N Am 2006;16:87-116; used with permission. Data from The Johns Hopkins University, Online Mendelian Inheritance in Man (OMIM), McKusick-Nathans Institute for Genetic Medicine, Johns Hopkins University (Baltimore, MD) and the National Center for Biotechnology Information, National Library of Medicine (Bethesda, MD), 2000. Available at http://www.ncbi.nlm.nih.gov/omim/. Accessed October 2012.
Table 33-9
Adapted From Cecil KM. MR spectroscopy of metabolic disorders. Neuroimaging Clin N Am 2006;16:87-116; used with permission. Data from The Johns Hopkins University, Online Mendelian Inheritance in Man (OMIM), McKusick-Nathans Institute for Genetic Medicine, Johns Hopkins University (Baltimore, MD) and the National Center for Biotechnology Information, National Library of Medicine (Bethesda, MD), 2000. Available at http://www.ncbi.nlm.nih.gov/omim/. Accessed October 2012.
Table 33-10
OMIM, Online Mendelian Inheritance in Man Database.
Adapted From Cecil KM. MR spectroscopy of metabolic disorders. Neuroimaging Clin N Am 2006;16:87-116; used with permission. Data from The Johns Hopkins University, Online Mendelian Inheritance in Man (OMIM), McKusick-Nathans Institute for Genetic Medicine, Johns Hopkins University (Baltimore, MD) and the National Center for Biotechnology Information, National Library of Medicine (Bethesda, MD), 2000. Available at http://www.ncbi.nlm.nih.gov/omim/. Accessed October 2012.
Lysosomal Storage Diseases
Gangliosidoses
GM1 Gangliosidosis
Three types of GM1 gangliosidosis exist: type I (infantile), type II (late infantile/juvenile), and type III (adult). An intermediate form between infantile and juvenile has been reported.1 The clinical presentation of GM1 gangliosidosis typically occurs in infancy; its features include seizures, decerebrate posturing, pitting edema of the face, hypotonia, developmental delay, hepatosplenomegaly, macrocephaly, and cherry red spots involving the macula of the retina. Additional features include broad digits, kyphoscoliosis, skeletal dysplasia with widening of the metabphyses, and dermal pigmentary lesions.2 The course is progressive, with death common within 2 years of life. A juvenile form presents during the second year of life with progressive ataxia but without many features of the infantile variety.
The underlying deficiency of β-galactosidase results in accumulation of GM1 ganglioside in both gray and white matter of the cerebrum, brainstem, cerebellum, and spinal cord. Results of cerebral MRI initially are normal, with subsequent loss of cortical gray matter. Secondary changes to the white matter manifest later and typically exhibit an abnormal, nonspecific, patchy, hyperintense T2 signal within the centrum semiovale. Hypointensity of the thalami on T2-weighted images also has been reported.3
GM2 Gangliosidosis
The most common forms of GM2 gangliosidoses include Tay-Sachs disease and Sandhoff disease. Tay-Sachs disease arises with β-N-acetylhexosaminidase-A isoenzyme deficiency in Jewish children of eastern European descent. Onset is usually before the age of 1 year with irritability, hypotonia, seizures, blindness, and cherry-red spots on the macula in 90% of patients. Death usually results by 2 to 3 years of age. Sandhoff disease is attributed to a deficiency of A and B isoenzymes of hexosaminidase. The clinical course is similar to that of Tay-Sachs disease. There is visceral involvement, including hepatomegaly and cardiac and renal tubular abnormalities. Brain MRI in the early stages demonstrates increased T2 signal in the basal ganglia, particularly with the enlarged caudate nuclei. Later, cortical and deep gray matter volume loss occurs with patchy increases in T2 signal in the white matter. Thalamic involvement is more reflective of Sandhoff disease. In adult-onset Sandhoff disease, lower motor neuron involvement has been reported. Whereas cerebellar atrophy may vary, it does not appear to be correlated with clinical severity.4 In persons with Tay-Sachs disease, the thalami may be hypointense on T2-weighted images and hyperintense on T1-weighted images because of calcium deposition. It has been reported that T2-weighted hyperintensity in cerebral matter is indicative of abnormal myelin production and active demyelination.5 Asymmetrical swelling and high T2 intensity in the white matter and basal nuclei of the right hemisphere has been reported. Elevated levels of cytokines have been reported, possibly indicating inflammation as a contributing factor to the progression of gangliosidosis.6 In the B1 variant of GM2 gangliosidosis, the bilateral thalami may appear hyperdense/hyperintense on CT/T1-weighted MRI and show a T2-hypointense signal in the ventral thalami and a hyperintense signal in the posteromedial thalami. Other findings in this variant include involvement of the medullary lamellae, bilateral T2 hyperintense/swollen basal ganglia, diffuse white matter hyperintensity on T2-weighted images, and brain atrophy in later stages.7
Mucopolysaccharidoses
Cerebral MRI demonstrates two major abnormalities:
1. Diffuse patches of hyperintensity on T2-weighted images resulting from accumulation of mucopolysaccharide in neurons and astrocytes and degenerative effects on myelin
2. Prominent cystic or perivascular spaces resulting from metabolic accumulation within histiocytes located in perivascular areas, which is the most characteristic imaging feature; reversal of these changes after bone marrow transplantation has been reported
Spinal stenosis is especially common in Morquio and Maroteaux-Lamy variants but may be demonstrated in other variants. Typical bullet-shaped vertebral bodies are characteristic (Fig. 33-1).
Figure 33-1 A 2-year-old boy with Hunter syndrome, mucopolysaccharidoses, type II.
Select axial fluid-attenuated inversion recovery (A), short echo (time to echo [TE] 35 msec) magnetic resonance spectroscopy (MRS) (B), and long echo (TE 288 msec) MRS (C) images are shown. The patient underwent scanning within months of a stem cell transplant. Prominent perivascular spaces are demonstrated with a diffuse, abnormal, hyperintense signal throughout the periventricular and subcortical white matter. The spectra demonstrate diminished N-acetylaspartate levels with elevated lactate, which may reflect histiocytic cell infiltration of the perivascular spaces and brain parenchyma. (From Cecil KM. MR spectroscopy of metabolic disorders. Neuroimaging Clin N Am. 2006;16:87-116; used with permission.)
Neuronal Ceroid Lipofuscinoses
NCL is a disorder or group of disorders characterized by striking volume loss of brain parenchyma. NCL, which can be divided into six subtypes based on age at onset, is one of the most common neurodegenerative syndromes, with an incidence of 1 per 25,000 live births. The various subtypes are associated with different mutations in the CLN genes and have similar clinical manifestations occurring at different ages. These manifestations include seizures and abnormal eye movements, with subsequent vision loss, dementia, hypotonia, and speech and motor deficits. CSF neurotransmitter abnormalities also have been reported in patients with NCL.8 At pathology, these disorders are characterized by distinctive granular inclusions in neuronal lysosomes, called granular osmiophilic deposits. Imaging findings follow behind the clinical presentation in all but the infantile form of NCL and are dominated by progressive cerebral and cerebellar volume loss. Later stages of disease are characterized by development of a band of hyperintense signal in the periventricular white matter on T2-weighted images. In palmitoyl protein thioesterase-1 related NCL, isolated, symmetric dentate nucleus hyperintensities have been reported in early stages on T2-weighted images.9 Proton MRS has shown progressive decreases in NAA and relative increases in mI in persons with NCL.
Metachromatic Leukodystrophy
In persons with MLD, the primary metabolic defect is a deficiency in the enzyme arylsulfatase A, resulting in the accumulation of cerebroside sulfate within the lysosome. MLD has four subtypes: congenital, late infantile, juvenile, and adult. The late infantile subtype is the most common and presents from around 14 months to 4 years of age. The early presentations are an unsteady gait that progresses to severe ataxia and flaccid paralysis, dysarthria, mental retardation, and decerebrate posturing. Gallbladder involvement has been reported, possibly appearing before the onset of neurologic symptoms. Intestinal involvement also has been reported, specifically polypoid masses in one patient.10
Histologic analysis of the abnormal nervous tissue demonstrates a complete loss of myelin (demyelination) followed by axonal degeneration. Metachromatic granules are reported within engorged lysosomes in white matter and neurons and on peripheral nerve biopsies. Oligodendrocytes are reduced in number, and areas of demyelination predominate throughout the deep white matter region. Early sparing of the subcortical arcuate white matter fibers (“U” fibers) occurs until late in the disease process. An inflammatory response typically is absent, which accounts for a lack of enhancement in this disorder, but eventually, even myelinated white matter is replaced by astrogliosis and scarring. The corpus callosum is involved before significant progression, whereas subcortical white matter remains unaffected until the disease has progressed; atrophy is a late sign. Demyelination also can be seen in the posterior limbs of the internal capsule, descending pyramidal tracts, and the cerebellar white matter.11 Thalamic changes may be common in primary MLD, and isolated cerebellar atrophy may be seen in some atypical later-onset variants. On T2-weighted images, there is marked hyperintensity of the white matter fiber tracts involving the cerebral hemispheres that may extend to the cerebellum, brainstem, and spinal cord. The findings further demonstrate diffuse deep white matter involvement with relative sparing of subcortical white matter. The findings initially are focal and patchy, but later, a diffuse, hyperintense T2 signal of the centrum semiovale develops. Two distinct white matter appearances have been noted that mimic what was previously considered to be pathognomonic of Pelizaeus-Merzbacher disease (PMD). Punctate areas of hypointensity (“leopard skin” appearance) and radiating patterns of linear tubular structures of T2 hypointensity (“tigroid” appearance) are seen, with areas of relatively normal-appearing white matter within the areas of demyelination. On T1-weighted images, the white matter fibers may be isointense with, or hypotense to, gray matter (Fig. 33-2).
Figure 33-2 A 7-year-old boy with metachromatic leukodystrophy.
Select axial T2-weighted (A), coronal fluid-attenuated inversion recovery (B) with left parietal white matter short echo magnetic resonance spectroscopy (MRS) (C) and long echo MRS (D) images reveal an abnormal hyperintense signal in the periventricular white matter throughout the cerebrum, sparing the subcortical U fibers. The signal has a “tigroid” appearance on T2-weighted images. The spectra demonstrate significant elevations of choline and myo-inositol with diminished N-acetylaspartate reflecting neuroaxonal loss, demyelination, and glial activation. (From Cecil KM. MR spectroscopy of metabolic disorders. Neuroimaging Clin N Am. 2006;16:87-116; used with permission.)
Proton MRS studies have demonstrated reduced NAA, which is expected with neuroaxonal loss, but they also have revealed disturbances in glial cell metabolism associated with elevated mI and choline. The levels of NAA in white matter have been found to correlate with motor function in children with MLD.12
Globoid Cell Leukodystrophy (Krabbe Disease)
Globoid cell leukodystrophy (Krabbe disease) arises from a deficiency in the enzyme β-galactocerebrosidase, leading to the accumulation of cerebroside and galactosylsphingosine, which induces apoptosis in the oligodendrocyte cell lines. Globoid cell leukodystrophy, an autosomal-recessive disorder, has a frequency of 2 in 100,000 in a series reported from Sweden. It is seen predominantly in young children; however, the infantile form is the most common. Onset of symptoms usually begins between 3 and 5 months after birth with irritability. The disease continues to progress, with development of symptoms mimicking encephalitis with motor deterioration and atypical seizures. At the end stage of the disease, the child is in a vegetative state with decerebrate posturing. Elevated CSF protein has been reported, to a larger extent in adult phenotypes than in phenotypes affecting younger people.13 Positional ocular flutter has been reported in one patient with infantile Krabbe disease.14 In nerve conduction studies, the severity of abnormalities appears to correlate with the severity of clinical symptoms.15
Delayed myelination may be the first finding noted on MRI in infants with this disorder. In infantile Krabbe disease, MRI findings may be normal, but as the disease progresses, classic Krabbe features emerge; this phenomenon is probably related to the immature myelination.16 The appearance of Krabbe disease on MRI is featured as one of either two patterns. A patchy hyperintense periventricular signal on T2-weighted images, consistent with hypomyelination, eventually may evolve into a more diffuse pattern in the white matter. In this form, involvement of the thalami with a hyperintense T2 signal often is present as well. A second pattern is a patchy low signal on T2-weighted images in a similar distribution to the hyperdense regions seen on CT, which is suspected to represent a paramagnetic effect from calcium deposition in the region. Additional early changes include increased density in the distribution of the thalami, cerebellum, caudate heads, and brainstem that may precede the abnormally low attenuation of white matter in the centrum semiovale. Symmetric enlargement of the optic nerves also has been described in persons with Krabbe disease, which is presumed to reflect accumulation of proteolipid in globoid cells. The distal optic nerves are primarily involved; however, a case has been described with proximal prechiasmatic enlargement of the nerves.17 At times, changes within the cerebellar white matter also have been reported, with hyperintensity on T2-weighted images. The findings within the spinal cord are visualized as atrophic changes. Diffuse volume loss and periventricular white matter abnormalities predominate in the latter stages of this disease (Fig. 33-3).
Figure 33-3 A 4-year-old girl with Krabbe disease.
Select axial T2-weighted fast spin echo (A), axial fluid-attenuated inversion recovery (FLAIR) (B), axial apparent diffusion coefficient (ADC) map (C), short echo magnetic resonance spectroscopy (MRS) (D), and intermediate (time to echo 144 msec) echo MRS (E) images are shown. Abnormal hyperintense T2 and FLAIR signals are noted within the centrum semiovale with sparing of the subcortical U fibers and posterior limbs of the internal capsules. Relatively increased diffusion is seen in the periatrial and parietal white matter. The spectra demonstrate significant elevations of lactate, choline, and myo-inositol, with diminished N-acetylaspartate reflecting neuroaxonal loss, demyelination, and glial activation.
