[level-membership-for-pediatrics-category]Chapter 34
Infection and Inflammation
Imaging of central nervous system (CNS) infection is most often initially performed by means of computed tomography (CT) to assess for the possibility of hydrocephalus or increased intracranial pressure prior to the preparation of a lumbar puncture. Nonspecific parenchymal hypoattenuation indicative of edema on CT is sometimes appreciated in cases of more focal infection. CT is superior in the evaluation of bone erosion and destruction. Magnetic resonance imaging (MRI) is warranted in the assessment of infectious complications such as abscess, empyema, vasculitis, and ischemia in the setting of a worsening clinical condition or lack of clinical improvement despite appropriate therapy. Infection is most often manifested on MRI by abnormal hyperintense signal on T2-weighted (T2W), proton density, and fluid-attenuated inversion–recovery (FLAIR) sequences, with corresponding hypointense signal on T1-weighted (T1W) sequences. Postcontrast T1W images are essential in the evaluation for infectious collections and meningeal enhancement. Magnetic resonance venography (MRV) sequences may detect associated venous sinus thromboses. Diffusion-weighted imaging (DWI) may assist in localizing abscess collections, infection associated with ischemia, or both and may at times help distinguish lymphoma from abscess, especially in immunocompromised patients. DWI may also demonstrate lesions earlier than conventional sequences in viral infections such as herpes and West Nile virus (e-Fig. 34-1). Magnetic resonance spectroscopy has shown promise in distinguishing pyogenic abscesses from those caused by atypical organisms, with the former often demonstrating the presence of amino acids and lack of choline.
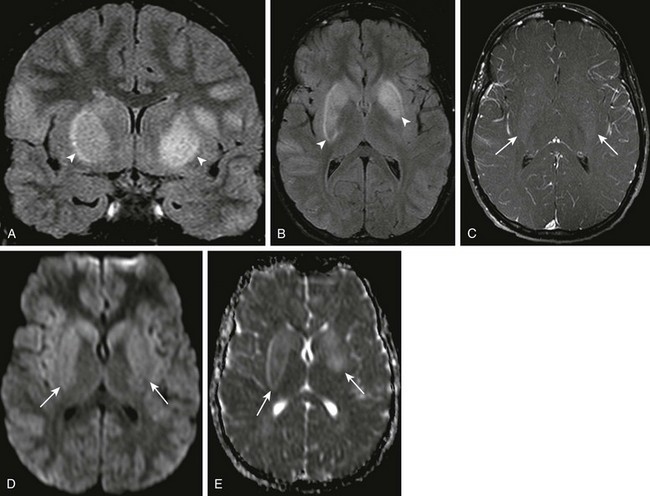
e-Figure 34-1 West Nile virus.
A patient with loss of consciousness and questionable history of mosquito bite. Coronal and axial fluid-attenuated inversion recovery (A and B, respectively), axial postcontrast spin echo T1 (arrows in C), and axial diffusion-weighted imaging (DWI) and apparent diffusion coefficient (ADC) map (D and E, respectively) were obtained. Note the T2 prolongation within the basal ganglia bilaterally (arrowheads in A and B), with some questionable contrast enhancement or magnetization transfer effect as seen on the postcontrast images (C). Increased signal on DWI as well as ADC maps (arrows in D and E), in keeping with T2 shine-through.
Bacterial Infections
Nearly two thirds of cases of bacterial meningitis in the United States occur in children. Routes of transmission include hematogenous, direct traumatic, congenital routes, as well as direct extension from adjacent sinus or mastoid disease (Figs. 34-2 through 34-4 and e-Fig. 34-5). Imaging plays a key role in determining the course of treatment for bacterial infection. It is essential to distinguish between focal cerebritis (Fig. 34-6), which tends to respond to antibiotics, and abscess, which often requires surgical intervention. Hypoattenuation on CT, indicative of edema, and corresponding hyperintense T2W and hypointense T1W signal on MRI, with patchy nonspecific postcontrast enhancement, are typical imaging characteristics of cerebritis. Mild to moderate mass effect is often present. Sequential imaging is essential in the assessment of the response to antibiotics as well as for progression to an abscess. Progression from cerebritis to abscess generally takes 1 to 2 weeks but may progress more quickly in neonates. Citrobacter, Serratia, and Proteus are the most common causes of neonatal brain abscess. Citrobacter and Serratia infection may cause medullary vein thrombosis and associated hemorrhage (Fig. 34-7). In general, abscesses tend to be situated at gray-white matter junctions, where the diameter of the end arterioles decreases (Fig. 34-8). Opportunistic organisms are common in immunocompromised neonates.
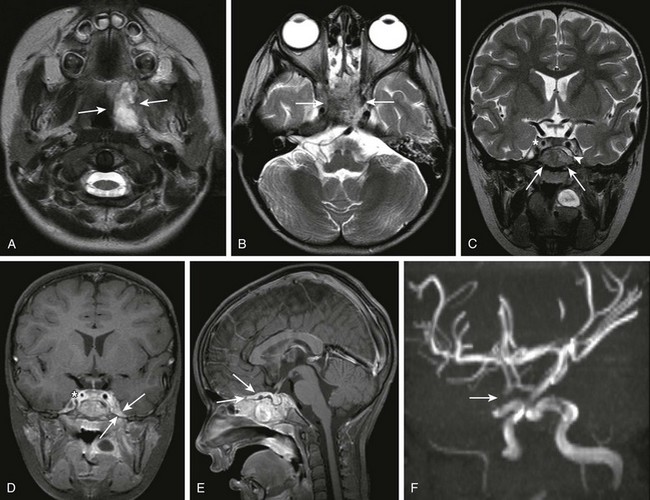
Figure 34-2 Parameningeal spread of retropharyngeal infectious process or abscess.
A 3-year-old female child with retropharyngeal abscess, now with fever, headache, emesis, and left sixth nerve palsy. Axial T2-weighted images at the level of the adenoids (A) and sphenoid bone (B) and coronal T2 (C) images, coronal (D) and sagittal (E) postcontrast T1, as well as three-dimensional time-of-flight magnetic resonance angiography (MRA) in the left anterior oblique projection (F) were obtained. Note the inflammatory process within the left retropharyngeal region (arrows in A). Note the abnormal marrow signal within the sphenoid bone (arrows in B and C). In addition, note the abnormal soft tissue seen extending superior to the sphenoid bone on the coronal T2 sequence (arrowhead in C). Corresponding abnormal contrast enhancement is seen along the region of the skull base and planum sphenoidale seen on the postcontrast images (arrows in D and E). Note the diminution in size of the right internal carotid artery (asterisks in C and D) with corresponding narrowing of the right supraclinoid carotid artery on the right on the MRA (arrows in F). (Case courtesy of Kim M. Cecil, Ph.D. Department of Radiology, Cincinnati Children’s Hospital.)
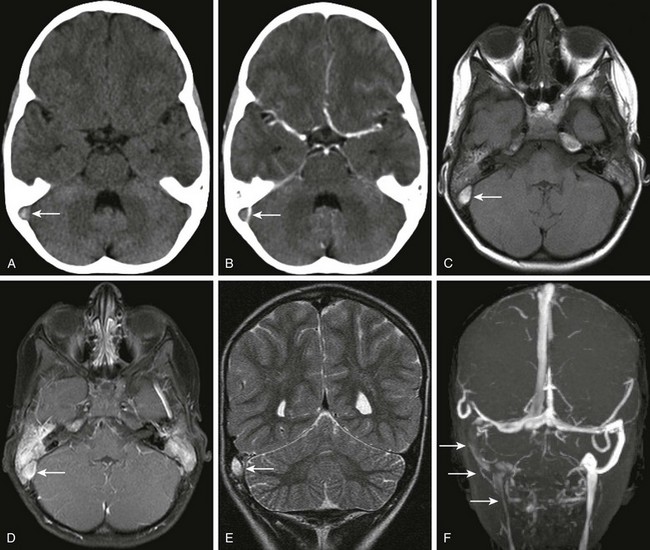
Figure 34-3 Transverse sinus thrombosis associated with otomastoiditis or middle ear disease.
A patient with otitis media, headache, and papilledema. Axial noncontrast (A) and contrast-enhanced (B) computed tomography (CT) of the head through the level of the posterior fossa, axial magnetization transfer T1 precontrast (C) and postcontrast (D) magnetic resonance imaging scans, coronal T2 (E) and coronal multiple intensity projection image from a three-dimensional time-of-flight magnetic resonance venogram (MRV) (F) were obtained. Note the dense appearance within the right transverse sinus on the noncontrast CT study (arrow in A), with corresponding lack of contrast filling on the postcontrast CT study (arrow in B). Corresponding T1 shortening is seen on the precontrast magnetic resonance image (arrow in C), with corresponding abnormal signal on the postcontrast images in keeping with clot or slow flow within the region of the right transverse sinus or sigmoid sinus (arrow in D). Corresponding T2 prolongation is seen on the coronal T2 image (arrow in E). Note the striking asymmetry of flow within the right posterior fossa dural venous system or internal jugular vein on the right on the three-dimensional time-of-flight MRV (arrows F).
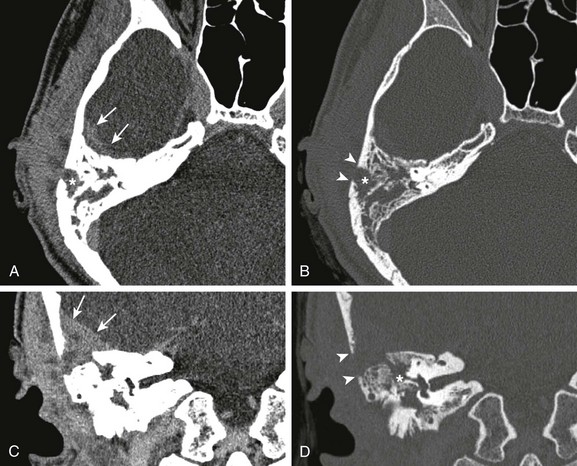
Figure 34-4 Mastoiditis with associated epidural abscess.
A 17-year-old male with 5-month history of otitis media, now with severe right-sided mastoid pain. Axial postcontrast computed tomography images through the right mastoid region, including soft tissue (A) and bone windows (B), and direct coronal images from the same study obtained on soft tissue (C) and bone windows (D) were obtained. Note the abnormal soft tissue opacification within the right mastoid region (asterisks in A and B). Associated abnormal soft tissue swelling is seen along the external surface of the skull or scalp, with an abnormal soft tissue component seen extending intracranially (arrows), corresponding to epidural abscess formation. Bony resorption or breakdown is seen within the mastoid cortex laterally (arrowheads). In addition, note the erosion of the lateral semicircular canal (asterisk in D).
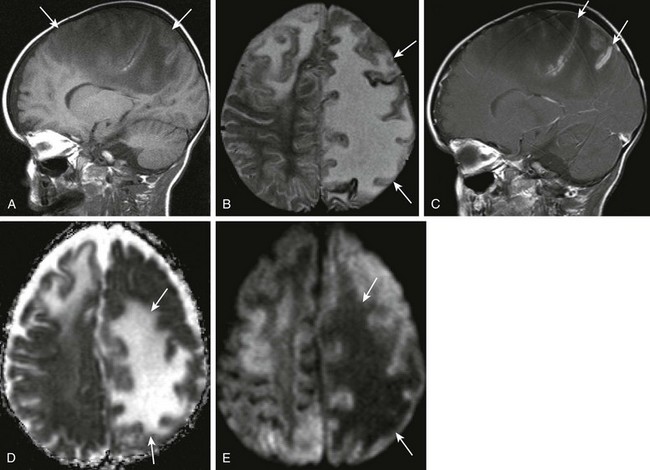
Figure 34-6 Cerebritis.
A 2-year-old male with Staphylococcus aureus bacteremia, persistent fevers, and new-onset of hypertension. A and B, Sagittal T1-weighted and axial T2-weighted images demonstrate T1 and T2 prolongation (arrows). C, Sagittal postcontrast spin echo images show mild cortical enhancement (arrows) D, An axial diffusion-weighted imaging shows increased signal (arrows). E, The corresponding decreased signal indicates restricted diffusion on apparent diffusion coefficient image.
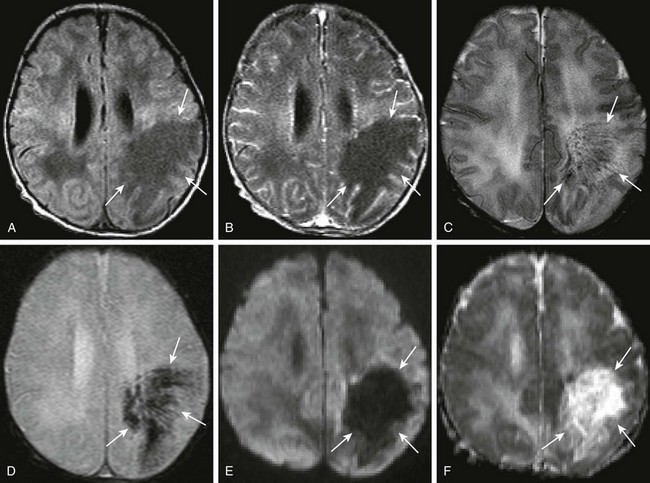
Figure 34-7 Citrobacter infection with secondary venous thrombosis.
A 7-day-old full-term female neonate with seizures, and gram-negative sepsis, as well as increased white blood cell count on lumbar puncture. Axial precontrast and postcontrast T1, (A and B, respectively), axial T2 (C), axial gradient echo (D), as well as axial diffusion-weighted imaging and apparent diffusion coefficient maps (E and F, respectively) were obtained. Note the area of T1 prolongation within the left posterior frontal parietal region (arrows A and B), corresponding to areas with linear signal voids on both T2 and gradient echo sequences (arrows in C and D), corresponding to distended medullary veins. Note the absence of diffusion restriction and the presence of increased diffusion in the corresponding area on the diffusion-weighted sequences (arrows in E and F).
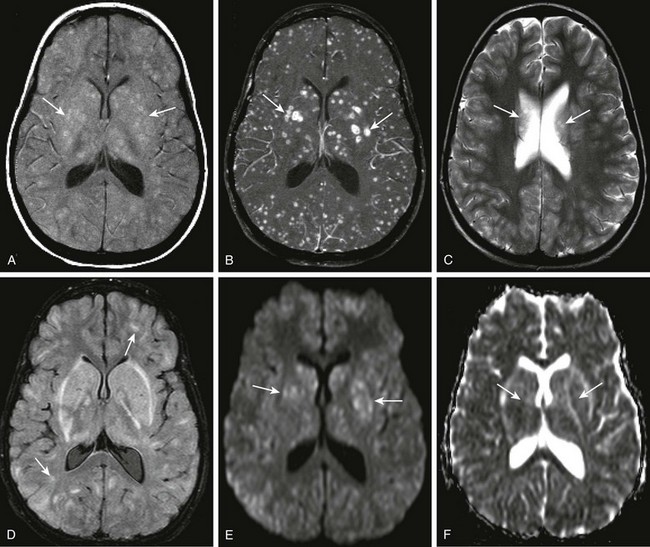
Figure 34-8 Streptococcus viridans abscesses.
A 12-year-old female child with acute myelogenous leukemia and mental status changes. Axial T1 magnetization transfer (MT) images, precontrast and post contrast (A and B), axial T2 and fluid-attenuated inversion recovery (FLAIR) (C and D), and axial diffusion-weighted imaging with apparent diffusion coefficient maps (E and F) were obtained. Note the areas of T1 shortening on the precontrast MT image (arrows in A), and the corresponding marked gadolinium enhancement within multiple bilateral intraparenchymal nodules of differing size (arrows in B). T2 prolongation is noted on the axial T2 and FLAIR sequences in some corresponding areas (arrows in C and D), but this is markedly less conspicuous than on the postcontrast images. Subtle restricted diffusion is noted in some of the nodular areas, specifically within the region of the basal ganglia bilaterally corresponding to the largest lesions seen on postcontrast images (arrows in E and F).
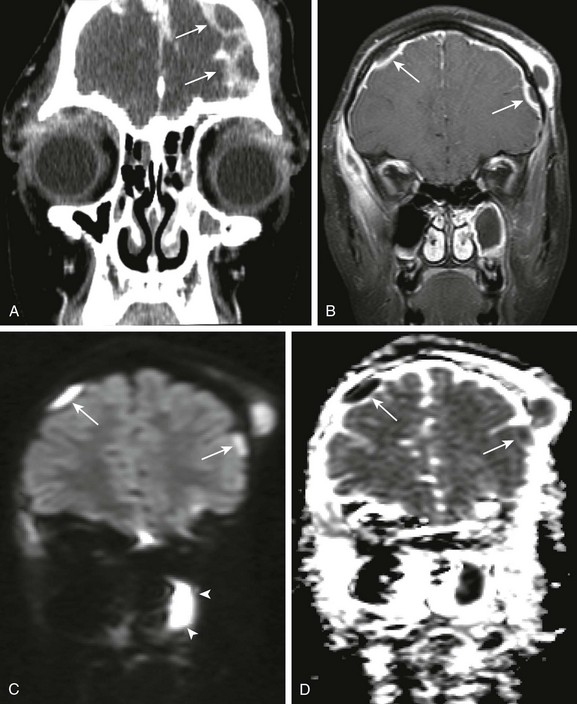
e-Figure 34-5 Pott puffy tumor, with associated intracranial, extra axial pus.
An 11-year old female child with orbital swelling, preseptal cellulitis, and increase in forehead swelling associated with pan-sinusitis. The patient initially presented with syncope, fever, and bilateral orbital swelling. Coronal postcontrast computed tomography (A), coronal postcontrast fat saturated T1 magnetic resonance image through the frontal region (B), and coronal diffusion-weighted imaging with apparent diffusion coefficient map (C and D, respectively) were obtained. Note the abnormal extraaxial collections (arrows in A and B). Corresponding restricted diffusion is seen in the extraaxial space over the right cerebral hemisphere (arrows in C and D). Note also that corresponding to the area of apparent fluid collection within the left maxillary sinus (arrowheads B), an area of corresponding restricted diffusion is present (arrowheads in C and D), corresponding to pus within the left maxillary sinus.
Differential diagnostic considerations of a peripherally contrast-enhancing fluid-filled structure in the brain includes infectious abscess and tumor. On DWI, abscesses will appear hyperintense (and dark on apparent diffusion coefficient, indicating restricting material within the capsule. On both MRI and CT, abscesses tend to have smooth regular inner margins and are often thinner walled along their medial edge than along their lateral margins. Intraventricular rupture of an abscess portends a poor outcome. Spectroscopy of abscesses is notable for the presence of amino acids and lactate (Fig. 34-9) and the absence of normal metabolite peaks. In neonates, ultrasonography may depict a hypoechoic abscess with peripheral hyperechogenicity, which may contain dependent echogenic debris.
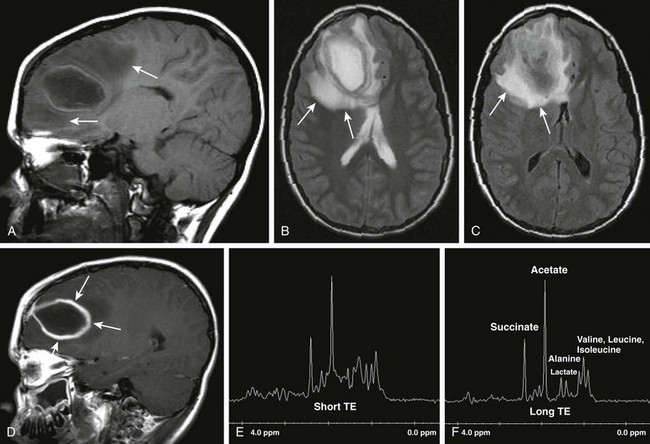
Figure 34-9 Cerebral abscess.
Patient with seizures and fever. Sagittal T1 (A), axial T2 (B), axial fluid-attenuated inversion–recovery (C), postcontrast sagittal spin echo images (D), as well as short TE and long TE spectroscopic images (E and F, respectively) were obtained. Note the areas of T2 prolongation (B and C), with some central low signal intensity (C) in the region of abscess with surrounding vasogenic edema. Thick, rindlike enhancement of the periphery of the right frontal abscess is seen (arrows in D). Spectroscopic images demonstrate abnormal amino acid peaks at around 1 part per million (ppm), and a doublet lactate peak deflected upward at 1.33 ppm.
Bacterial meningitis is the most common form of pediatric CNS infection. Although not diagnosed by imaging, imaging is warranted if a diagnosis is unclear, persisting seizures are present, and symptoms persist despite treatment. It is more common in preterm infants and full-term infants within the first month of life. The subarachnoid space tends to resist infection in older children, making meningitis in this age group a rarity. Most cases of neonatal meningitis in the United States are caused by group B Streptococcus (Fig. 34-10) and Escherichia coli. Other less common organisms (e.g., Serratia, enterococci, and Listeria) tend to inflict more extensive destruction. In infants older than 1 month, the most common causative organisms are Haemophilus influenza type B, Streptococcus pneumonia (Fig. 34-11), Neisseria meningitides, and Escherichia coli. Complications of meningitis include cerebritis, abscess, empyema, hydrocephalus, venous thrombosis, infarction (venous and arterial), ventriculitis (e-Fig. 34-12), mycotic aneurysms (Fig. 34-13), and sensorineural hearing loss (Fig. 34-14).
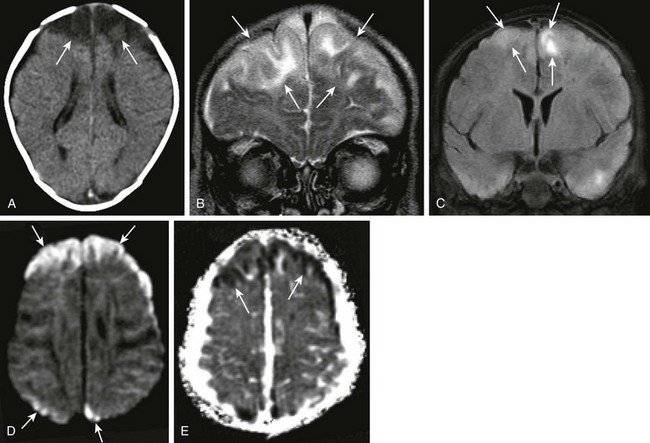
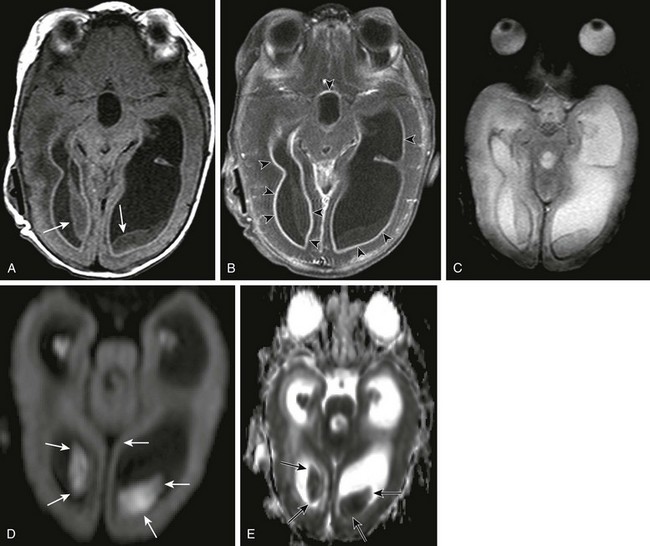
Figure 34-10 Group B Streptococcus meningitis.
A 10-week-old female baby with group B Streptococcus sepsis and meningitis. Axial noncontrast computed tomography of the head (A), coronal T2 (B) and fluid-attenuated inversion recovery (FLAIR) (C) magnetic resonance imaging scans, diffusion-weighted imaging, and apparent diffusion coefficient map (D and E, respectively) were obtained. Note the low attenuation within the frontal lobes bilaterally (A). Corresponding T2 prolongation and abnormal increased FLAIR signal (arrows) are seen (B and C, respectively). In addition, restricted diffusion is evident within the frontal and parietal regions bilaterally (arrows in D and E), indicating ischemic changes secondary to meningitis.
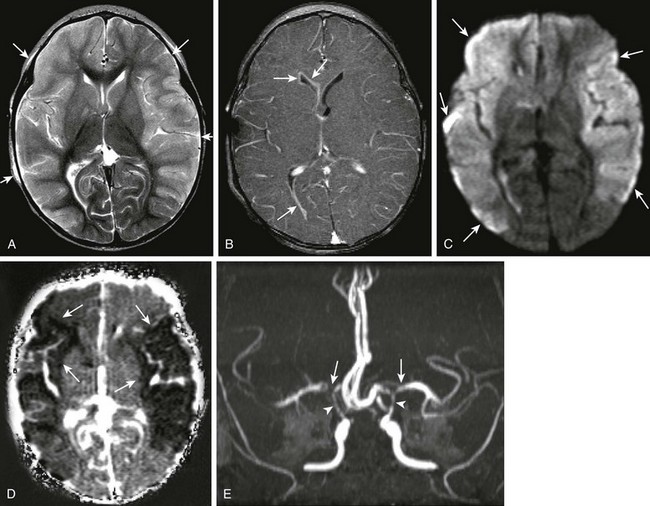
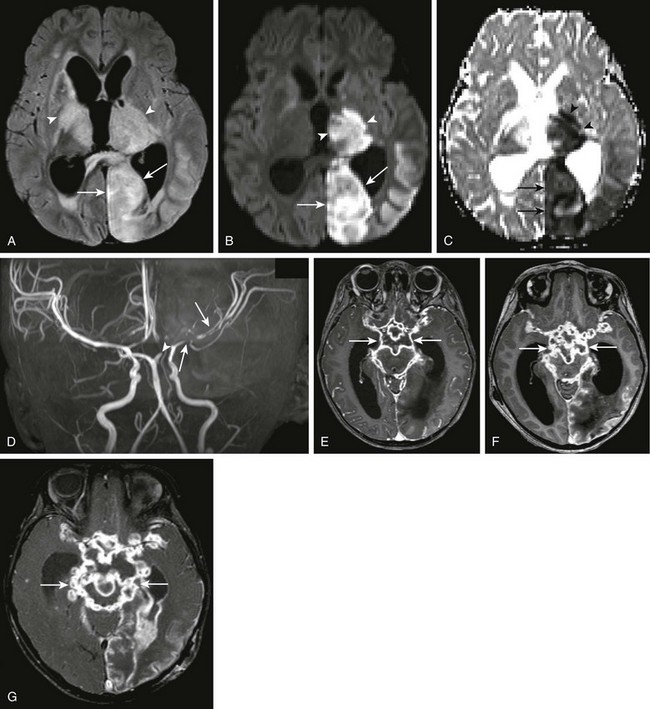
Figure 34-11 Pneumococcal meningitis with infarctions.
An 11-month-old female with ventriculostomy and mental status changes, with suspected meningitis. Axial T2 (A), axial postcontrast T1 (B), axial diffusion-weighted imaging, apparent diffusion coefficient maps (D and E, respectively), and three-dimensional time of flight (TOF) magnetic resonance angiogram (E) were obtained. Diffuse T2 prolongation is seen within the cerebral cortex bilaterally (arrows in A), with associated abnormal enhancement along the ventricular lining (arrows in B) in keeping with ventriculitis. Note the marked restricted diffusion within both hemispheres (arrows in C and D), indicating cytotoxic edema secondary to infection. Bilateral middle cerebral artery narrowing, right greater than left (arrows in E), and narrowing of the supraclinoid carotid arteries bilaterally (arrowheads in E) are seen.
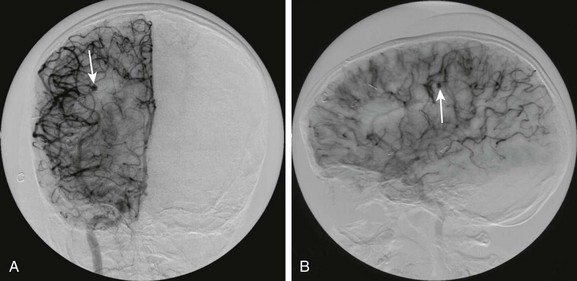
Figure 34-13 Mycotic aneurysm of right middle cerebral artery distribution.
A 9-year-old male child with complex congenital heart disease and subacute bacterial endocarditis who presented with hemorrhage and left-sided hemiparesis and a normal angiogram 2 weeks prior to the present study. Frontal (A) and lateral (B) views from digital subtraction angiography demonstrate a small outpouching from a right middle cerebral artery branch on the right (arrows), indicating a mycotic aneurysm.
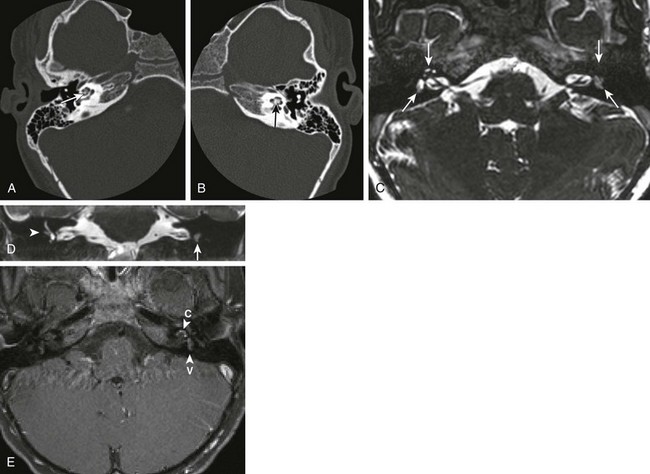
Figure 34-14 Labyrinthitis ossificans.
A patient with bilateral sensorineural hearing loss following bacterial meningitis. Axial high-resolution computed tomography images through the right (A) and left (B) temporal bones were obtained. In addition, high-resolution magnetic resonance imaging constructive interference in steady-state images were obtained through the region of the internal auditory canals bilaterally (C) and were reconstructed in the coronal plane (D). In addition, high-resolution fat-suppression T1-weighted postcontrast images were obtained through the region of the internal auditory canals (E). Note the ossification of the membranous labyrinth bilaterally, left greater than right (arrows in A and B). Corresponding T2 signal dropoff is most marked on the left side (arrows in C and D). Note the blunting of the right lateral semicircular canal (arrowhead in D). In addition, fairly avid contrast enhancement is seen within the membranous labyrinth of the cochlea and vestibule, left greater than right (arrowheads in E) (c, cochlea; v, vestibule).
e-Figure 34-12 Ventriculitis.
A 4-month-old, former 24-week premie with intraventricular hemorrhage, ventricular peritoneal shunt, status postshunt revision for Escherichia coli meningitis or ventriculitis. Axial T1 precontrast (A) and postcontrast (B) images, axial gradient echo (C), and axial diffusion-weighted imaging scan with apparent diffusion coefficient map (D and E, respectively) demonstrate intraventricular soft tissue masses (arrows), which fail to demonstrate contrast enhancement (B), and do not show significant T2* effect on the gradient echo (C). They do, however, demonstrate restricted diffusion on the diffusion-weighted sequences (arrows in D and E), in keeping with infected ependyma or clot. Avid contrast enhancement is seen along the lining of the ventricles (arrowheads in B), in keeping with ventriculitis.
Tuberculosis Infection
On CT, exudate within the cisterns is manifested by its greater than CSF attenuation. On contrast-enhanced MRI, marked subarachnoid and cisternal enhancement is seen on T1W sequences (e-Fig. 34-15), with T2W images demonstrating obscuration of the cisterns caused by the hyperintense signal within these affected regions. Microinfarctions are not uncommon. Tuberculomas often occur at gray-white junctions and are more common above the tentorium cerebelli. On CT, they demonstrate high attenuation and ring enhancement (Fig. 34-16), whereas on MRI, they demonstrate hyperintense T1W and hypointense T2W signals and enhance uniformly or peripherally when less than and greater than approximately 2 cm, respectively. The rare tuberculous abscess may be differentiated from a tuberculoma by its central hyperintense T2W signal and more pronounced associated vasogenic edema. Although DWI is not particularly helpful in making a diagnosis, lipid detection on spectroscopy has been reported in some cases.
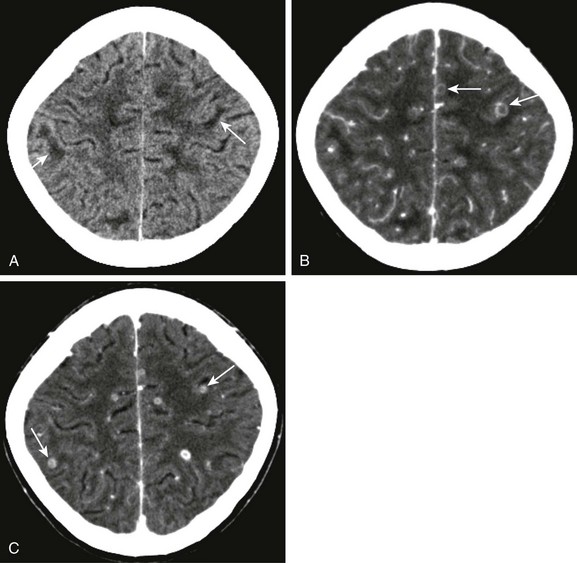
Figure 34-16 Tuberculosis microabscesses.
A 13-year-old female child with headaches, vomiting, and vertigo. The purified protein derivative test was positive, and chest radiography was abnormal. Axial noncontrast computed tomography (CT) of the head (A) and corresponding contrast- enhanced CT from the same date (B), as well as postcontrast image from 1 month follow-up (C) were obtained. Note the areas of low attenuation at the gray-white matter junction (arrows in A). Multiple ring enhancing lesions are noted at the gray-white matter junction (arrows in B and C), corresponding to multiple tuberculosis microabscesses.
e-Figure 34-15 Tuberculous meningitis.
A 2-year-old female with suspected tuberculous meningitis and left-sided posterior cerebral artery territory stroke. Axial fluid-attenuated inversion recovery (FLAIR) (A), axial diffusion-weighted imaging (DWI) and apparent diffusion coefficient maps (B and C, respectively), three-dimensional time-of-flight magnetic resonance angiogram (D), as well as sequential contrast-enhanced T1-weighted images through the level of the brain stem (E, F, and G) were obtained over time. Note the abnormal FLAIR signal seen within the left occipital lobe (arrows) and bilateral thalami (arrowheads) on the axial FLAIR sequence (A). Corresponding restricted diffusion is seen within the left thalamus (arrowheads) and occipital lobes (arrows) as seen on DWI sequences (B and C). Marked irregularity of the left middle cerebral artery (arrows in D), as well as cutoff of the left posterior cerebral artery (arrowhead in D) are seen. Note the marked abnormal contrast enhancement along the basal meninges bilaterally, outlining the base of the brain (arrows in E, F and G), demonstrating worsening changes of tuberculous meningitis over time.
Lyme Disease
CT scans are usually normal in Lyme disease, although focal areas of hypoattenuation have been reported. Focal T2W hyperintense white matter lesions are seen in about 1 in 4 neurologically affected patients. Contrast-enhanced MRI may show leptomeningeal enhancement, with or without enhancement of the affected nerves, in children with cranial neuropathy (Fig. 34-17).
Cysticercosis
Although cysticercosis is not very common in the United States, it often presents in immigrants from endemic regions. Presenting symptoms of neurocysticercosis include seizures, developmental delay, and hydrocephalus. The most common form, parenchymal cysticercosis, is caused by an inflammatory reaction secondary to the death of the parasite. Focal lesions are cystic and solid, and demonstrate peripheral enhancement and calcification, respectively. They are most often situated in the cortex, the gray-white matter junction, or both areas (Fig. 34-18). Parenchymal lesions follow CSF signal intensity on DWI, which helps differentiate them from pyogenic abscesses. The typical calcification seen in adults is not always seen in children. Surrounding inflammatory reaction demonstrates hyperintense signal abnormality on T2W imaging. Intraventricular cysterci often cause obstructive hydrocephalus, and thin-slice T1W imaging best depicts the causative intraventricular scolex (Fig. 34-19). The leptomeningeal form of cysticercosis mimics the radiographic appearance of TB, with marked subarachnoid postcontrast enhancement. Subarachnoid granulomata mimic their parenchymal counterparts. Hydrocephalus and vasculitis are common associated findings. Large racemose cysts are most often found in the cerebellopontine angle, Sylvian fissures, and in the basilar and suprasellar cisterns. Multiple coexisting forms of cysticercoids are a clue to the diagnosis. On MRI, clusters of cysts are most commonly depicted.
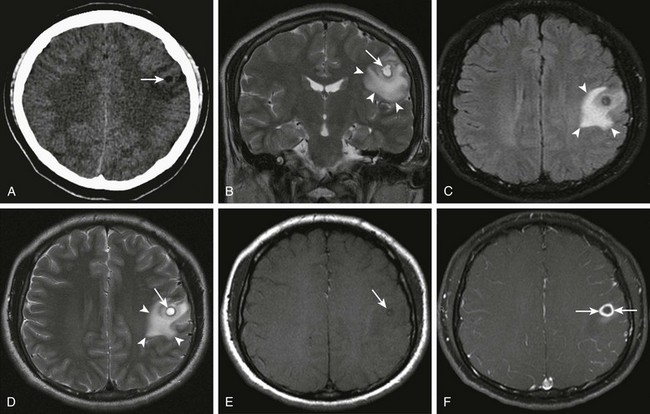
Figure 34-18 Cysticercosis.
History of ingestion of uncooked pork. Axial noncontrast computed tomography (A) shows an area of decreased attenuation (arrows). Coronal T2 (B), axial fluid-attenuated inversion recovery and T2 sequences (C and D, respectively), and axial precontrast and postcontrast magnetization transfer T1-weighted magnetic resonance images (E and F) were obtained. Corresponding cystlike T2 prolongation is seen within the center of this region identified on coronal and axial T2 images (arrows in B and D), with surrounding vasogenic edema (arrowheads in B, C and D). In addition, a subtle area of T1 shortening is seen within the center of the lesion (arrow in E) corresponding to the scolex. Note the thick reactive rim enhancement around the area of the parasite (arrows in F).
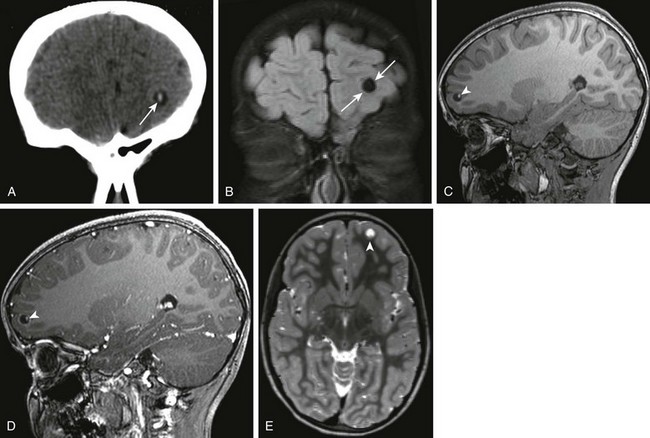
Figure 34-19 Cysticercosis.
A 7-year-old female child with left frontal cystic lesion. Coronal non-contrast computed tomography of the head (A), coronal fluid-attenuated inversion–recovery (B), sagittal precontrast and postcontrast three-dimensional (3D) spoiled gradient images through the level of the left frontal lobe (C and D), and reconstructed axial 3D T2 weighted magnetic resonance images through the same area (E) were obtained. Note the area of high attenuation within the center of the lesion (arrows in A), corresponding to the scolex. This is seen to be within a cystic rim (arrows in B). Note the bright appearance of the scolex (arrowheads in C and D) and the subtle area of T2 shortening at the base of the cyst within the frontal lobe (arrowheads in E).
Viral Infections
All viral CNS infections produce inflammation and neuronal necrosis to a greater or lesser extent. Some viruses such as herpes simplex and Coxsackie may also produce white matter necrosis, whereas the primary inflammatory process involves the parenchyma. Usually, a meningeal inflammatory reaction or even ventriculitis occurs. In general, acute viral infection typically causes marked edema, causing hyperechogenicity on ultrasonography, hypoattenuation on CT, and hyperintense signal on T2W and FLAIR sequences. Restricted diffusion is the earliest imaging sign of viral encephalitis, and DWI should be performed when viral infection is suspected. Fortunately, differences in presentation and location help suggest one viral etiology over another. Viral-like syndromes with autoimmune associations such as acute disseminated encephalomyelitis (ADEM) and posttransplantation lymphoproliferative disorders (Fig. 34-20) often demonstrate imaging characteristics similar to those of viral infections.
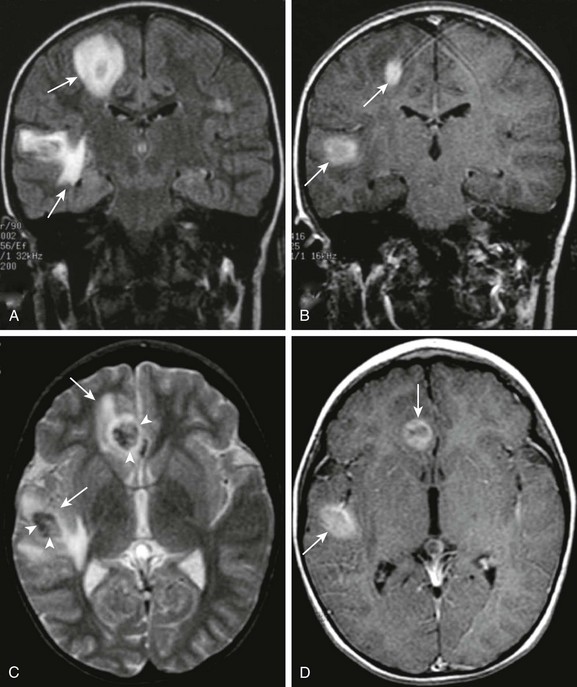
Figure 34-20 Posttransplantation lymphoproliferative disease.
A 7-year-old male child, following heart transplantation, now with headache and visual changes. Coronal fluid-attenuated inversion recovery (A), coronal postcontrast T1 (B), axial T2 (C), and axial postcontrast T1 images (D) were obtained. Note the multiple areas of T2 prolongation within the right cerebral hemisphere (arrows in A and C). Central T2 shortening suggests an element of hemorrhage (arrowheads in C). In addition, avid contrast enhancement is evidenced on the postcontrast images (arrows in B and D).
Herpes Simplex Virus Type I
Herpes simplex virus type 1 (HSV-1), as opposed to the prenatally or perinatally acquired HSV type 2 (HSV-2), is a spontaneous infection most often caused by reactivation of an orofacial herpes infection. HSV-1 CNS infection occurs in all ages but has a pediatric predominance. Early symptoms of fever and malaise may progress to seizures and hemiparesis. Restricted diffusion on MRI is the earliest radiologic manifestation, with unilateral or bilateral medial temporal lobe hyperintense signal on T2W and FLAIR sequences and more heterogeneous restricted diffusion appearing several days later (Fig. 34-21). CT findings of low attenuation within the temporal lobe and insular cortex do not manifest until several days following the onset of symptoms. Leptomeningeal and cortical contrast enhancement, as well as foci of calcification hemorrhage, or both, may also be present.
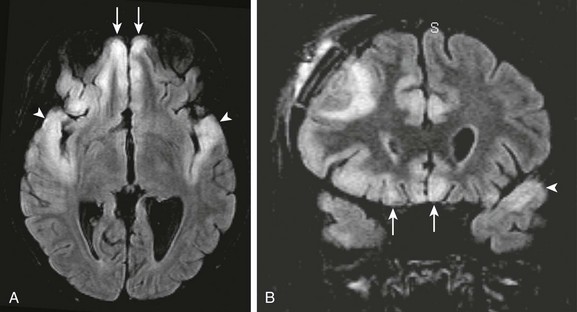
Figure 34-21 Herpes simplex virus (HSV).
A patient with seizures and decreased level of consciousness. Axial (A) and coronal fluid-attenuated inversion recovery (B) images show abnormal signal intensity within both frontal lobes (arrows) and temporal lobes (arrowheads) indicative of HSV encephalitis. The bilateral temporal lobe involvement is a clue to the underlying causative agent.
Human Immunodeficiency Syndrome
In the United States, greater than 90% of children with human immunodeficiency virus (HIV) are infected as a result of maternal transmission to the fetus. CNS imaging manifestations of congenital HIV include atrophy as well as basal ganglia and subcortical calcifications (Fig. 34-22). Superinfection and neoplasm, not uncommon in adults with HIV, are seldom seen in children. Progressive multifocal leukoencephalitis (PML) caused by the John Cunningham polyomavirus, is radiologically identical to its presentation in adults. PML demonstrates white matter hypoattenuation on CT, as well as hyperintense signal on T2W and FLAIR sequences. These lesions characteristically lack mass effect and do not enhance following contrast administration. HIV infection may also lead to vasculitis (Fig. 34-23).
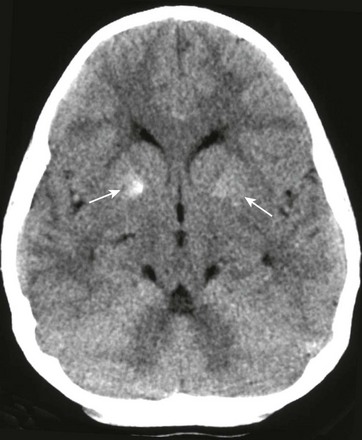
Figure 34-22 Human immunodeficiency virus (HIV) calcifications on computed tomography.
A 9-year-old male child with known HIV infection. Noncontrast computed tomography of the head was obtained to the level of the basal ganglia. Note the calcific areas within the basal ganglia bilaterally (arrows), right greater than left, not uncommonly seen in patients with HIV.
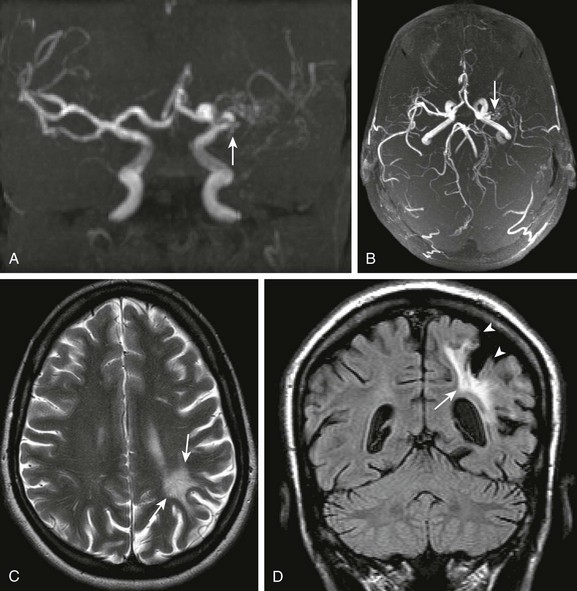
Figure 34-23 Human immunodeficiency virus (HIV) vasculitis.
An 18-year-old female with HIV and right hemiplegia. Coronal and collapsed cranio-caudad view of the intracranial circulation from a three-dimensional time-of-flight magnetic resonance angiogram (MRA) (A and B, respectively), axial T2 (C), and coronal fluid-attenuated inversion recovery (D) magnetic resonance imaging scans were obtained. Note the marked narrowing of the left middle cerebral artery on the time-of-flight MRA (arrows in A and B). Corresponding T2 prolongation is seen within the left parietal subcortical white matter (arrows in C and D), corresponding to gliosis. Associated overlying cortical volume loss is also seen (arrowheads in D).
Acute Disseminated Encephalomyelitis
ADEM is a monophasic perivascular inflammatory and demyelinating disorder that often affects both the brain and the spinal cord, following a vaccination or viral infection. Lesions are generally hyperintense on T2W sequences and have corresponding hypointensity or isointensity on T1W sequences. MRI characteristics of ADEM (Fig. 34-24) are variable, with enhancement patterns, ranging from solid or ringlike enhancement to no enhancement at all, in lesions that range from small to large and which affect gray matter, white matter, or both. A clinical history of a recent viral illness, vaccination, or both is the key to properly diagnosing these lesions.
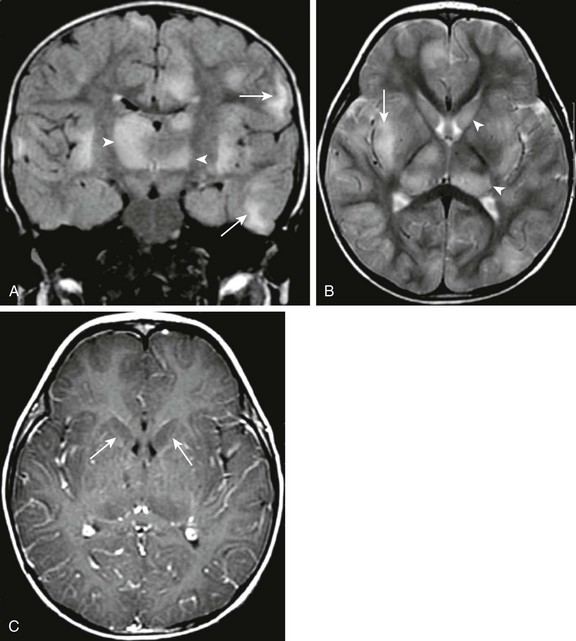
Figure 34-24 Acute disseminated encephalomyelopathy.
A 22-month old male child with lethargy, hypotonia, ataxia, and decreased righting reflexes preceded by an antecedent upper respiratory illness. Coronal fluid-attenuated inversion recovery (A), axial T2 (B), and axial postcontrast T1 (C) magnetic resonance images were obtained. Note the patchy bilateral subcortical white matter T2 prolongation (arrows in A and B), as well as abnormal T2 prolongation within the central gray structures (arrowheads in B). No significant contrast enhancement, however, is seen, and the central gray structures appear to standout in relief on the postcontrast images (arrows in C) likely secondary to abnormal T1 prolongation.
Congenital Infections
Transplacental and less often transvaginal transfer of infection to the fetus is often the result of TORCH (toxoplasmosis, other, rubella, cytomegalovirus, herpes) infection (Fig. 34-25). Insults occurring during the first two trimesters most often manifest as severe congenital malformations. Those occurring during the third trimester often result in destructive lesions.
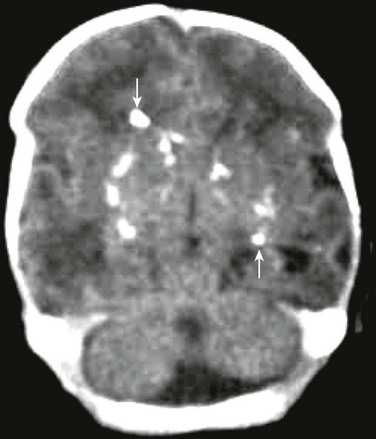
Figure 34-25 TORCH (toxoplasmosis, other, rubella, cytomegalovirus, herpes) infection on computed tomography.
A female neonate with seizures and questionable intracranial hemorrhage. Noncontrast computed tomography of the head demonstrates multiple scattered punctate calcifications (arrows) seen bilaterally, slightly greater on the right than on the left, in a more random fashion than is expected with cytomegalovirus infection. This likely represents calcification from another TORCH type infection, such as toxoplasmosis.
Cytomegalovirus
Cytomegalovirus (CMV) is the most common serious viral infection to affect newborns in the United States, occurring in nearly 1% of all live births. Up to 25% of infected infants develop neurologic or developmental abnormalities, including microcephaly, hearing impairment, chorioretinitis, and seizures, in the first year of life. Neonatal ultrasonography in affected patients often demonstrates nonspecific mineralizing vasculopathy of the basal ganglia (e-Fig. 34-26). MRI and CT demonstrate the sequelae of infection in the third trimester as periventricular calcification, hemorrhage, or both; ventricular and sulcal prominence; and periventricular and subcortical white matter changes (Figs. 34-27 and 34-28). Intrauterine infection with this virus is associated with polymicrogyria, especially in the region of the Sylvian fissures.
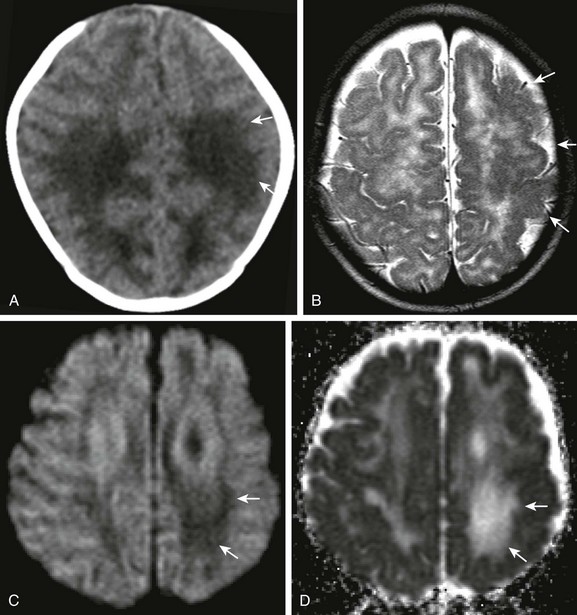
Figure 34-27 Cytomegalovirus (CMV).
Child with congenital CMV, pale left optic nerve, and failed hearing test. Axial noncontrast computed tomography of the head (A), axial T2 magnetic resonance imaging (B), and axial diffusion-weighted imaging and apparent diffusion coefficient map (C and D, respectively) were obtained. Note the abnormal low attenuation within the white matter (arrows in A). Abnormal sulcation of the left hemisphere indicates associated polymicrogyria (arrows in B). Note the increased diffusion within the corresponding white matter, left greater than right (arrows in C and D).
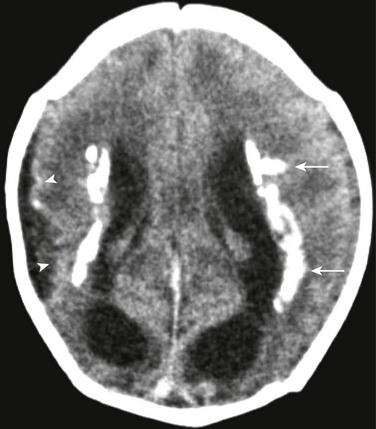
Figure 34-28 Cytomegalovirus.
A 1-day-old infant with congenital with cytomegalovirus infection. Noncontrast computed tomography of the head demonstrates bilateral areas of periventricular confluent calcifications (arrows). Note the abnormal sulcal pattern of the right hemisphere indicating associated polymicrogyria (arrowheads).
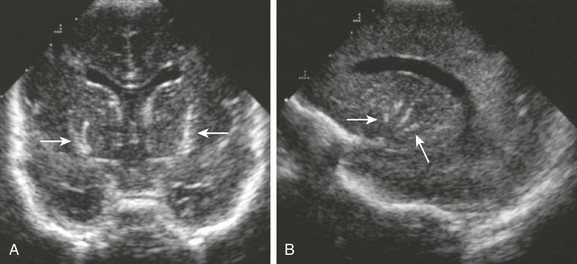
e-Figure 34-26 Lenticulostriate vasculopathy.
A 3-week-old infant, who was a 33-week premie with positive cytomegalovirus titers. Coronal (A) and sagittal (B) ultrasonographic images through the anterior fontanel were obtained. Note the linear branching areas of increased echogenicity seen within the distribution of the perforating vessels (arrows).
Herpes Simplex Virus Type 2
Most cases of neonatal HSV-2 are contracted transvaginally as the baby passes through the birth canal. Neonatal CNS herpetic infection is believed to occur in approximately 1 in 10,000 births. CNS manifestations generally present between 2 to 4 weeks of life and include meningoencephalitis with seizures, lethargy, and fever. Sequelae include mental retardation, severe neurologic deficits, or even death, secondary to virulent destruction of the brain. The disease may produce ischemic infarction of parts or all of the brain, necrosis, atrophy, encephalomalacia, demyelination, and gliosis (Fig. 34-29). Watershed distribution ischemia is also fairly common in areas remote from the primary herpetic lesions. MRI-restricted diffusion, which may be multifocal or limited to the temporal lobes, brainstem, or cerebellum, is the first radiologic sign of herpetic brain destruction. CT in early disease is either normal or demonstrates subtle areas of low attenuation. Later, patchy white matter low attenuation on CT and corresponding hyperintense signal on T2W imaging with rapid progression is demonstrated. Meningeal enhancement reflects the extent of the disease. Also of note is classic persisting hyperattenuation of cortical gray matter on CT, and corresponding T1 and T2 shortening on MRI. Eventually, diffuse cerebral and cerebellar (in about 50% of cases) atrophy and encephalomalacia ensue (Fig. 34-30). It should be noted that HSV-1 encephalitis, which affects older children and adults, is different from neonatal herpes infection.
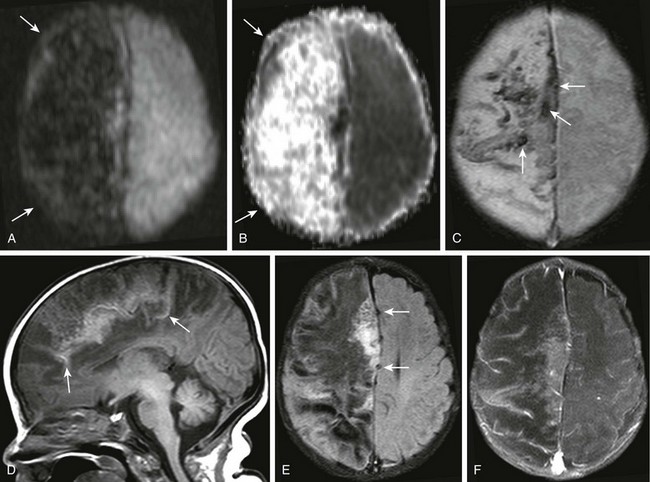
Figure 34-29 Herpes simplex virus (HSV) cerebritis or encephalitis (hemorrhagic type).
A 1-month-old female infant with several days’ history of seizures and positive HSV culture from recent cerebrospinal fluid sample. Diffusion-weighted imaging and apparent diffusion coefficient map (A and B, respectively), axial gadolinium-enhanced (C), sagittal T1 (D), axial fluid-attenuated inversion recovery (E), and axial postcontrast fat-suppression T1-weighted (F) images were obtained. Note the increased diffusion throughout the right cerebral hemisphere (arrows in A and B). Corresponding T2* effect is seen within the superior right cerebral hemisphere corresponding to hemorrhage (arrows in C). Corresponding T1 shortening is seen near midline sagittal T1-weighted image (arrows in D) corresponding to mineralization. Note the mass effect caused by edema of the right cerebral hemisphere (arrows in E), and the paucity of contrast enhancement (F).
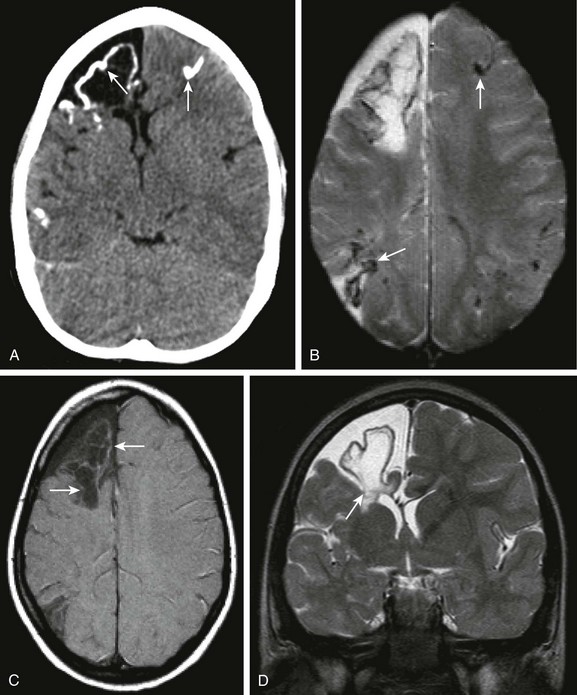
Figure 34-30 Herpes simplex virus (HSV) (chronic changes).
A 5-year-old female child with fulminant hepatic failure, renal failure, and lethargy with a prior history of HSV encephalitis. Axial noncontrast computed tomography of the head (A), axial gadolinium-enhanced sequence from magnetic resonance imaging (B), axial magnetization transfer (MT) T1-weighted (C) and coronal T2 magnetic resonance image (D) were obtained. Note the bilateral calcification seen within both hemispheres (arrows in A), with corresponding areas of T2* effect within both cerebral hemispheres (arrows in B) indicating mineralization. Note the slight T1 shortening effect on the MT T1 sequence (arrows in C), corresponding to mineralization. Volume loss is seen within the frontal lobe and associated T2 prolongation on the coronal T2 sequence (arrows in D).
Barkovich, AJ, Raybaud, C. Pediatric neuroimaging, 5th ed. Philadelphia, PA: Lippincott Williams and Wilkins; 2011.
Gasparetto, EL, Cabral, RF, da Cruz, LC, Jr., et al. Diffusion imaging in brain infections. Neuroimaging Clin North Am. 2011;21(1):89–113.
Hedlund, GL, Boyer, RS. Neuroimaging of postnatal pediatric central nervous system infections. Semin Pediatr Neurol. 1999;6:299–317.
Murthy, SN, Faden, HS, Cohen, ME, et al. Acute disseminated encephalomyelitis in children. Pediatrics. 2002;110:E21.
Nickerson, JP, Richner, B, Santy, K, et al. Neuroimaging of pediatric intracranial infection—part 2: TORCH, viral, fungal, and parasitic infections. J Neuroimag. 2012;22(2):e52–e63.
[/level-membership-for-pediatrics-category][not-level-membership-for-pediatrics-category]Chapter 34
Infection and Inflammation
Imaging of central nervous system (CNS) infection is most often initially performed by means of computed tomography (CT) to assess for the possibility of hydrocephalus or increased intracranial pressure prior to the preparation of a lumbar puncture. Nonspecific parenchymal hypoattenuation indicative of edema on CT is sometimes appreciated in cases of more focal infection. CT is superior in the evaluation of bone erosion and destruction. Magnetic resonance imaging (MRI) is warranted in the assessment of infectious complications such as abscess, empyema, vasculitis, and ischemia in the setting of a worsening clinical condition or lack of clinical improvement despite appropriate therapy. Infection is most often manifested on MRI by abnormal hyperintense signal on T2-weighted (T2W), proton density, and fluid-attenuated inversion–recovery (FLAIR) sequences, with corresponding hypointense signal on T1-weighted (T1W) sequences. Postcontrast T1W images are essential in the evaluation for infectious collections and meningeal enhancement. Magnetic resonance venography (MRV) sequences may detect associated venous sinus thromboses. Diffusion-weighted imaging (DWI) may assist in localizing abscess collections, infection associated with ischemia, or both and may at times help distinguish lymphoma from abscess, especially in immunocompromised patients. DWI may also demonstrate lesions earlier than conventional sequences in viral infections such as herpes and West Nile virus (e-Fig. 34-1). Magnetic resonance spectroscopy has shown promise in distinguishing pyogenic abscesses from those caused by atypical organisms, with the former often demonstrating the presence of amino acids and lack of choline.
e-Figure 34-1 West Nile virus.
A patient with loss of consciousness and questionable history of mosquito bite. Coronal and axial fluid-attenuated inversion recovery (A and B, respectively), axial postcontrast spin echo T1 (arrows in C), and axial diffusion-weighted imaging (DWI) and apparent diffusion coefficient (ADC) map (D and E, respectively) were obtained. Note the T2 prolongation within the basal ganglia bilaterally (arrowheads in A and B), with some questionable contrast enhancement or magnetization transfer effect as seen on the postcontrast images (C). Increased signal on DWI as well as ADC maps (arrows in D and E), in keeping with T2 shine-through.
Bacterial Infections
Nearly two thirds of cases of bacterial meningitis in the United States occur in children. Routes of transmission include hematogenous, direct traumatic, congenital routes, as well as direct extension from adjacent sinus or mastoid disease (Figs. 34-2 through 34-4 and e-Fig. 34-5). Imaging plays a key role in determining the course of treatment for bacterial infection. It is essential to distinguish between focal cerebritis (Fig. 34-6), which tends to respond to antibiotics, and abscess, which often requires surgical intervention. Hypoattenuation on CT, indicative of edema, and corresponding hyperintense T2W and hypointense T1W signal on MRI, with patchy nonspecific postcontrast enhancement, are typical imaging characteristics of cerebritis. Mild to moderate mass effect is often present. Sequential imaging is essential in the assessment of the response to antibiotics as well as for progression to an abscess. Progression from cerebritis to abscess generally takes 1 to 2 weeks but may progress more quickly in neonates. Citrobacter, Serratia, and Proteus are the most common causes of neonatal brain abscess. Citrobacter and Serratia infection may cause medullary vein thrombosis and associated hemorrhage (Fig. 34-7). In general, abscesses tend to be situated at gray-white matter junctions, where the diameter of the end arterioles decreases (Fig. 34-8). Opportunistic organisms are common in immunocompromised neonates.
Figure 34-2 Parameningeal spread of retropharyngeal infectious process or abscess.
A 3-year-old female child with retropharyngeal abscess, now with fever, headache, emesis, and left sixth nerve palsy. Axial T2-weighted images at the level of the adenoids (A) and sphenoid bone (B) and coronal T2 (C) images, coronal (D) and sagittal (E) postcontrast T1, as well as three-dimensional time-of-flight magnetic resonance angiography (MRA) in the left anterior oblique projection (F) were obtained. Note the inflammatory process within the left retropharyngeal region (arrows in A). Note the abnormal marrow signal within the sphenoid bone (arrows in B and C). In addition, note the abnormal soft tissue seen extending superior to the sphenoid bone on the coronal T2 sequence (arrowhead in C). Corresponding abnormal contrast enhancement is seen along the region of the skull base and planum sphenoidale seen on the postcontrast images (arrows in D and E). Note the diminution in size of the right internal carotid artery (asterisks in C and D) with corresponding narrowing of the right supraclinoid carotid artery on the right on the MRA (arrows in F). (Case courtesy of Kim M. Cecil, Ph.D. Department of Radiology, Cincinnati Children’s Hospital.)
Figure 34-3 Transverse sinus thrombosis associated with otomastoiditis or middle ear disease.
A patient with otitis media, headache, and papilledema. Axial noncontrast (A) and contrast-enhanced (B) computed tomography (CT) of the head through the level of the posterior fossa, axial magnetization transfer T1 precontrast (C) and postcontrast (D) magnetic resonance imaging scans, coronal T2 (E) and coronal multiple intensity projection image from a three-dimensional time-of-flight magnetic resonance venogram (MRV) (F) were obtained. Note the dense appearance within the right transverse sinus on the noncontrast CT study (arrow in A), with corresponding lack of contrast filling on the postcontrast CT study (arrow in B). Corresponding T1 shortening is seen on the precontrast magnetic resonance image (arrow in C), with corresponding abnormal signal on the postcontrast images in keeping with clot or slow flow within the region of the right transverse sinus or sigmoid sinus (arrow in D). Corresponding T2 prolongation is seen on the coronal T2 image (arrow in E). Note the striking asymmetry of flow within the right posterior fossa dural venous system or internal jugular vein on the right on the three-dimensional time-of-flight MRV (arrows F).
Figure 34-4 Mastoiditis with associated epidural abscess.
A 17-year-old male with 5-month history of otitis media, now with severe right-sided mastoid pain. Axial postcontrast computed tomography images through the right mastoid region, including soft tissue (A) and bone windows (B), and direct coronal images from the same study obtained on soft tissue (C) and bone windows (D) were obtained. Note the abnormal soft tissue opacification within the right mastoid region (asterisks in A and B). Associated abnormal soft tissue swelling is seen along the external surface of the skull or scalp, with an abnormal soft tissue component seen extending intracranially (arrows), corresponding to epidural abscess formation. Bony resorption or breakdown is seen within the mastoid cortex laterally (arrowheads). In addition, note the erosion of the lateral semicircular canal (asterisk in D).
Figure 34-6 Cerebritis.
A 2-year-old male with Staphylococcus aureus bacteremia, persistent fevers, and new-onset of hypertension. A and B, Sagittal T1-weighted and axial T2-weighted images demonstrate T1 and T2 prolongation (arrows). C, Sagittal postcontrast spin echo images show mild cortical enhancement (arrows) D, An axial diffusion-weighted imaging shows increased signal (arrows). E, The corresponding decreased signal indicates restricted diffusion on apparent diffusion coefficient image.
Figure 34-7 Citrobacter infection with secondary venous thrombosis.
A 7-day-old full-term female neonate with seizures, and gram-negative sepsis, as well as increased white blood cell count on lumbar puncture. Axial precontrast and postcontrast T1, (A and B, respectively), axial T2 (C), axial gradient echo (D), as well as axial diffusion-weighted imaging and apparent diffusion coefficient maps (E and F, respectively) were obtained. Note the area of T1 prolongation within the left posterior frontal parietal region (arrows A and B), corresponding to areas with linear signal voids on both T2 and gradient echo sequences (arrows in C and D), corresponding to distended medullary veins. Note the absence of diffusion restriction and the presence of increased diffusion in the corresponding area on the diffusion-weighted sequences (arrows in E and F).
Figure 34-8 Streptococcus viridans abscesses.
A 12-year-old female child with acute myelogenous leukemia and mental status changes. Axial T1 magnetization transfer (MT) images, precontrast and post contrast (A and B), axial T2 and fluid-attenuated inversion recovery (FLAIR) (C and D), and axial diffusion-weighted imaging with apparent diffusion coefficient maps (E and F) were obtained. Note the areas of T1 shortening on the precontrast MT image (arrows in A), and the corresponding marked gadolinium enhancement within multiple bilateral intraparenchymal nodules of differing size (arrows in B). T2 prolongation is noted on the axial T2 and FLAIR sequences in some corresponding areas (arrows in C and D), but this is markedly less conspicuous than on the postcontrast images. Subtle restricted diffusion is noted in some of the nodular areas, specifically within the region of the basal ganglia bilaterally corresponding to the largest lesions seen on postcontrast images (arrows in E and F).
e-Figure 34-5 Pott puffy tumor, with associated intracranial, extra axial pus.
An 11-year old female child with orbital swelling, preseptal cellulitis, and increase in forehead swelling associated with pan-sinusitis. The patient initially presented with syncope, fever, and bilateral orbital swelling. Coronal postcontrast computed tomography (A), coronal postcontrast fat saturated T1 magnetic resonance image through the frontal region (B), and coronal diffusion-weighted imaging with apparent diffusion coefficient map (C and D, respectively) were obtained. Note the abnormal extraaxial collections (arrows in A and B). Corresponding restricted diffusion is seen in the extraaxial space over the right cerebral hemisphere (arrows in C and D). Note also that corresponding to the area of apparent fluid collection within the left maxillary sinus (arrowheads B), an area of corresponding restricted diffusion is present (arrowheads in C and D), corresponding to pus within the left maxillary sinus.
Differential diagnostic considerations of a peripherally contrast-enhancing fluid-filled structure in the brain includes infectious abscess and tumor. On DWI, abscesses will appear hyperintense (and dark on apparent diffusion coefficient, indicating restricting material within the capsule. On both MRI and CT, abscesses tend to have smooth regular inner margins and are often thinner walled along their medial edge than along their lateral margins. Intraventricular rupture of an abscess portends a poor outcome. Spectroscopy of abscesses is notable for the presence of amino acids and lactate (Fig. 34-9) and the absence of normal metabolite peaks. In neonates, ultrasonography may depict a hypoechoic abscess with peripheral hyperechogenicity, which may contain dependent echogenic debris.
Figure 34-9 Cerebral abscess.
Patient with seizures and fever. Sagittal T1 (A), axial T2 (B), axial fluid-attenuated inversion–recovery (C), postcontrast sagittal spin echo images (D), as well as short TE and long TE spectroscopic images (E and F, respectively) were obtained. Note the areas of T2 prolongation (B and C), with some central low signal intensity (C) in the region of abscess with surrounding vasogenic edema. Thick, rindlike enhancement of the periphery of the right frontal abscess is seen (arrows in D). Spectroscopic images demonstrate abnormal amino acid peaks at around 1 part per million (ppm), and a doublet lactate peak deflected upward at 1.33 ppm.
Bacterial meningitis is the most common form of pediatric CNS infection. Although not diagnosed by imaging, imaging is warranted if a diagnosis is unclear, persisting seizures are present, and symptoms persist despite treatment. It is more common in preterm infants and full-term infants within the first month of life. The subarachnoid space tends to resist infection in older children, making meningitis in this age group a rarity. Most cases of neonatal meningitis in the United States are caused by group B Streptococcus (Fig. 34-10) and Escherichia coli. Other less common organisms (e.g., Serratia, enterococci, and Listeria) tend to inflict more extensive destruction. In infants older than 1 month, the most common causative organisms are Haemophilus influenza type B, Streptococcus pneumonia (Fig. 34-11), Neisseria meningitides, and Escherichia coli. Complications of meningitis include cerebritis, abscess, empyema, hydrocephalus, venous thrombosis, infarction (venous and arterial), ventriculitis (e-Fig. 34-12), mycotic aneurysms (Fig. 34-13), and sensorineural hearing loss (Fig. 34-14).
[/not-level-membership-for-pediatrics-category]
