Improving cardiovascular imaging diagnostics by using patient-specific numerical simulations and biomechanical analysis
Overview
Ultrasound is the only imaging modality, apart from magnetic resonance imaging (MRI), that provides real-time functional and structural information on the beating heart. However, modeling moving cardiovascular structures is a complex process that requires three- dimensional (3D) reconstruction of two-dimensional (2D) data by fast imaging techniques (e.g., MRI) to thus yield dynamic four-dimensional (4D) views of cardiovascular pulsations. The unique 3D geometry of the cardiovascular system is partially responsible for the diversity of physiologic interactions between blood flow and cardiovascular structures. Recent advances in 3D echocardiography, cardiac computed tomography (CT), and MRI techniques have improved cardiovascular diagnostics considerably. In addition, with the advances achieved in graphics techniques for surface rendering, the potential for attaining useful information from graphics in medical imaging has emerged. Several techniques have been developed, such as the maximum intensity projection, shaded surface display, volumetric rendering, and others. The visualization tool kit (VTK) and the insight tool kit (ITK) are two examples of packages developed for performing image registration and segmentation based on ITK and VTK libraries. These open-source tool kits have an active development community that includes laboratories, institutions, and universities from around the world.1,2
Computational fluid dynamics model of normal aortic flow
CFD models were used to describe the fine diversities in normal 3D rotational aortic flow: the aortic vortex.3–5 The aortic geometry (curved-shaped vessel) and preformed asymmetric flow originating from the left ventricle enable the formation of counterrotating helical vortices with associated secondary flow, which are characterized by the dimensionless Dean number. Also, the pulsatility of cardiovascular flow leads to rapid changes in inertia, limited boundary layer development, and the promotion of unstable flow.
Recently, our group used previous CFD models3–5 and patient-derived hemodynamic and transesophageal echocardiography data, which were used as boundaries, to run aortic vortex numerical simulations.6 An example of a simplified CFD model of normal aortic flow that integrates a swirling component of the inlet velocity at the root of the ascending aorta is illustrated in Figure 35-1. CFD flow patterns were calculated according to aortic topography (ascending aorta, aortic arch, descending aorta), whereas the vessel was modeled as a simple curved tube without any peripheral branches. Flow patterns at late systole (0.28 second) and early diastole (0.42 second) were recorded in a normal aorta. During systole, a predominant clockwise rotational flow component in the ascending aorta was documented. In the aortic arch, a pair of fused counterrotating vortices that were further amplified downstream was observed (see Figure 35-1, systole, planes D, E, and F). During diastole, the fused counterrotating vortices decomposed to a pair of distinct vortices with secondary flow phenomena when moving toward the descending aorta (see Figure 35-1, diastole, planes D, E, and F). This example shows that 3D aortic flow tends to be even more polymorphic than previously hypothesized, which is in accordance with in-vivo MRI data.4 Complex intraventricular flow phenomena may at least partially be responsible for the generation of this normal polymorphic 3D aortic vortex, which in turns “feeds” the peripheral arteries. Indeed, left ventricular muscle fibers have complex 3D configurations consisting of internal and external loops that go from without to within in a clockwise and from within to without in a counterclockwise spiral (vortex cordis). The vortex cordis and associated intraventricular flow phenomena, the pulsatility of cardiovascular flow, the distinct structural and functional features of the cardiac valves, and the curved-shaped aorta may all contribute to creation of the aortic vortex. The latter may in fact exist as a result of natural optimization of fluid transport processes in the cardiovascular system that are intended to achieve efficient end-organ perfusion.
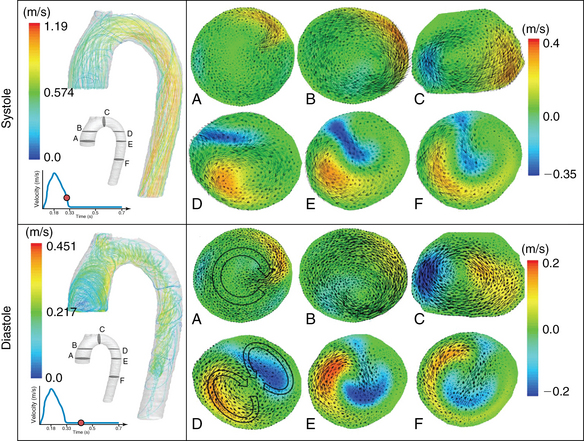
Figure 35-1 Normal aortic vortex phenomena at late systole and early diastole. Path lines reflect aortic blood flow, whereas cross sections of velocity vectors at the ascending aorta (A and B), aortic arch (C and D), and descending aorta (E and F) correspond to a clockwise rotational component (ascending aorta) and complex helical flow (aortic arch), which are gradually transformed to a pair of counterrotating vortices with retrograde flow (descending aorta).
Fluid-structure interaction models of abdominal aortic aneurysms
FSI simulations, in which the dynamic interaction between AAA hemodynamics and wall deformation is modeled, were previously conducted to simulate the biomechanical behavior of the aortic wall.7,8 Past studies were based on the isotropic assumption that the directional ambiguities associated with the mechanical response of abdominal aortic tissue to stress, which may play a major role in the behavior of the tissue under elevated stress, cannot be resolved. Bluestein et al performed FSI numerical studies in which patient-specific 3D geometries were reconstructed from CT scans of AAAs with different configurations, both with and without intraluminal thrombus (ILT).7,9 The complex flow trajectories within the AAA lumen suggested a putative mechanism for ILT formation and growth. The resulting magnitude and location of the peak wall stress were dependent on the shape of the AAA. Currently, our numerical data suggest that although a thrombus does not significantly change the location of maximal stress in the aneurysm, its presence may reduce some of the stress on the wall. Inclusion of ILT and calcifications in AAA stress analysis may increase the accuracy of predicting risk for rupture. A model for accurate prediction of the stress developing within the AAA wall requires detailed information, including (1) patient-specific AAA geometry, (2) blood flow parameters and flow patterns (including flow rates and pressure at the various phases of the cardiac cycle and wall thickness and its variability), and (3) appropriate material models that can describe the mechanical tissue response of AAAs. Rissland et al9 fitted the experimental data of AAA wall specimens to an exponential strain energy orthotopic material model10,11 and further applied the orthotropic material model of Holzapfel et al,12 which models the tissue as a fiber-reinforced composite material with the fibers corresponding to the collagenous component of the material. This material formulation was previously applied successfully to various arterial walls, such as the aorta, coronary arteries, and carotid arteries.12
An example of FSI simulation performed in a patient with a ruptured AAA in which the highest stress was found along the actual rupture line with excellent agreement between the two is illustrated in Figure 35-2. In this configuration the highest stress occurred on the distal side of the spinal cord, whereas the ILT seemed to offer a significant protective effect by reducing the stress (colored purple) in the surrounding wall region (see Figure 35-2). Two major locations of stress concentrations were predicted: one at the location of the actual rupture and one close to the neck of the aneurysm. The calcifications (colored green) embedded along the rupture line created a stress concentration, unlike the larger calcifications that appear to be deposited (not embedded) on the wall. Though indicating that the neck area could have been a potential location for a secondary rupture, the peak stress values were prominent in the rupture area.13 The combination of calcifications and a thinner wall, which was observed by CT in the rupture area of AAAs, presumably contributed to the weakening wall strength at the point where the rupture actually occurred. Biomechanical analysis and patient-specific numerical simulations are functional imaging techniques that may improve cardiovascular diagnostics.
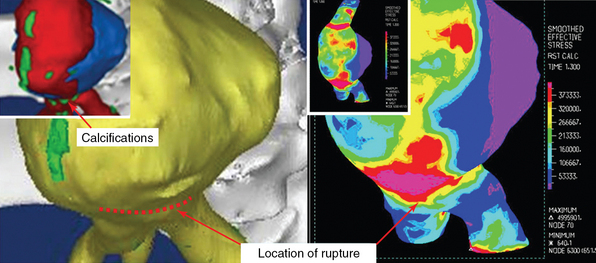
Figure 35-2 Fluid-structure interaction simulation of a ruptured abdominal aortic aneurysm. The location of maximal wall stress overlaps the actual rupture region. The inner top panel (left) shows the lumen with calcifications above the bifurcation and the iliac branch. The actual rupture is depicted on the wall surrounding it (yellow). The right panel shows the wall stress contours, with concentration of stress along the rupture line. (Used with permission of the Annals of Biomedical Engineering from Xenos M, Rambhia SH, Alemu Y, et al: Patient-based abdominal aortic aneurysm rupture risk prediction with fluid structure interaction modeling, Ann Biomed Eng 38:3323-3337, 2010; permission conveyed through the Copyright Clearance Center, Inc.).
Pearls and highlights
• CFD models provide additional information over conventional imaging methods on complex intraventricular and intraaortic flow phenomena. Such analysis may be applied in diverse physiologic and cardiovascular disease states.
• FSI simulations are used to develop models for predicting the development of stress within the aortic aneurysmal wall and for analyzing hemodynamically driven vessel wall abnormalities in other disorders.
References
1. Antiga, L, Ene-Iordochi, B, Caverni, L, et al. Geometric reconstruction for computational mesh generation of arterial bifurcations from CT angiography. Comput Med Imaging Graph. 2002; 26:227–235.
2. Steinman, DA, Thomas, JB, Ladak, HM, et al. Reconstruction of carotid bifurcation hemodynamics and wall thickness using computational fluid dynamics and MRI. Magn Reson Med. 2002; 47:149–159.
3. Kim, HJ, Vignon-Clementel, IE, Figueroa, CA, et al. On coupling a lumped parameter heart model and a three-dimensional finite element aorta model. Ann Biomed Eng. 2009; 37:2153–2169.
4. Kilner, PJ, Yang, GZ, Mohiaddin, RH, et al. Helical and retrograde secondary flow patterns in the aortic arch studied by three-directional magnetic resonance velocity mapping. Circulation. 1993; 88:2235–2247.
5. Frazin, LJ, Lanza, G, Vonesh, M, et al. Functional chiral asymmetry in descending thoracic aorta. Circulation. 1990; 82:1985–1994.
6. Xenos, M, Karakitsos, D, Labropoulous, N, et al. Comparative study of flow in right-sided and left-sided aortas-numerical simulations in patient based models, computer methods in biomechanics and biomedical engineering. DOI: 10.1080/10255842.2013.805210, 2013.
7. Bluestein, D, Dumont, K, De Beule, M, et al. Intraluminal thrombus and risk of rupture in patient specific abdominal aortic aneurysm—FSI modelling. Comput Methods Biomech Biomed Eng. 2008; 12:73–81.
8. Fillinger, MF, Marra, SP, Raghavan, MK, Kennedy, FE, Prediction of rupture risk in abdominal aortic aneurysm during observation: wall stress versus diameter. J Vasc Sur. 2003; 37:724–732.
9. Rissland, P, Alemu, Y, Einav, S, et al. Abdominal aortic aneurysm risk of rupture—patient specific FSI simulations using anisotropic model. J Biomech Eng. 2009; 13:1001–1010.
10. Papaharilaou, Y, Ekaterinaris, JA, Manousaki, E, Katsamouris, AN. A decoupled fluid structure approach for estimating wall stress in abdominal aortic aneurysms. J Biomech. 2007; 40:367–377.
11. Geest, JPV, Sacks, MS, Vorp, DA. The effects of aneurysm on the biaxial mechanical behavior of human abdominal aorta. J Biomech. 2006; 39:1324–1334.
12. Holzapfel, GA, Gasser, TC, Ogden, RW. A new constitutive framework for arterial wall mechanics and a comparative study of material models. J Elasticity. 2000; 61:1–48.
13. Xenos, M, Rambhia, SH, Alemu, Y, et al. Patient-based abdominal aortic aneurysm rupture risk prediction with fluid structure interaction modeling. Ann Biomed Eng. 2010; 38:3323–3337.