Chapter 16 Immunophenotyping
Introduction
This chapter includes descriptions of the following:
Methods for the study of immunological markers
There are several techniques for identifying antigens expressed by leucocytes:
Preparation of the Specimens and Cell Separation
Ficoll-Gradient Method of Separation
Dilute 10 ml of anticoagulated (e.g. heparinized or ethylenediaminetetra-acetic acid, EDTA-anticoagulated) blood with an equal volume of phosphate buffered saline (PBS), pH 7.3 (see p. 622) or Hanks’ solution. Add 10 ml of the diluted blood, drop by drop, to 7.5 ml of Lymphoprep (Nycomed) and then centrifuge for 30 min at 2000 rpm (approx. 500 g). This results in three visible layers: a top layer of plasma; an interphase layer of mononuclear cells; and a layer of red cells and neutrophils at the bottom. After removing the plasma, pipette the mononuclear cell layer into another tube and wash three times with Hanks’ solution or tissue culture medium.
Multicolour Flow Cytometry Methods
At the same time, the introduction of a large number of novel fluorochromes and the application of new McAbs has led to multiparametric immunophenotyping of cells, facilitating the accurate identification of normal and abnormal cell populations. Such advances have led to an increase in the complexity of data obtained and a subsequent increase in the comprehensiveness of the knowledge obtained by the flow cytometrist interpreting such data.1
Detection of membrane antigens
Detection of Surface Immunoglobulin
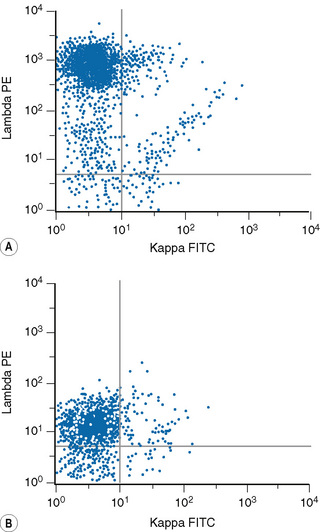
Lymphoproliferative disorders of mature B cells are distinguished from their normal counterparts by the identifications of two main types of phenotypic abnormalities: surface immunoglobulin light chain restriction and aberrant B-cell antigen expression (Fig. 16.2).
Method 1: Wash–Stain–Lyse–Wash
Method 2: Lyse–Stain–Wash
Detection of Intracellular Antigens
There are several commercially available kits containing solutions to fix and permeabilize cells to detect cytoplasmic or nuclear antigens. Overall, these reagents have little or no effect on the light scatter pattern, although their reliability and consistency for detecting particular nuclear and cytoplasmic antigens may vary.2,3
The methods follow the manufacturer’s kit instructions. Details that follow are for the method using Fix and Perm (Invitrogen).4
Simultaneous Detection of Cytoplasmic/Nuclear and Membrane Antigens
Method
Data Analysis Strategies with Multiparametric Flow Cytometry
Until recently, advances made in computing capabilities, and the increased availability in fluorochrome conjugates, had not been matched by the developments in analysis software. However, new independent targeted analysis programmes to deal with these limitations have now been developed, which include novel tactics for the analysis of multiparametric flow cytometry data such as the software developed by the Euroflow consortium.5
Quantification of Antigens
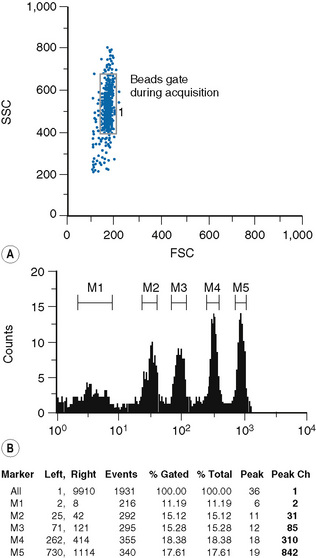
Fluorescence quantification is defined as the measurement of the intensity of staining of cells by flow cytometry to provide an absolute value for the light intensity it measures.6,7
Staining of cells and beads
The type of bead depends on the procedure used for the sample preparation. The beads are commercially available in kits, which usually comprise two tubes. One tube contains four types of beads with four different levels of fluorescence uptake: one very dim, one very bright and two intermediate; the other tube contains blank (non-fluorescent beads) (Fig. 16.4).
Immunocytochemistry
The most common immunocytochemical techniques are the immunoperoxidase (IP) and the alkaline phosphatase antialkaline phosphatase (APAAP) methods.8,9 These detect both membrane and intracellular antigens prior to fixation of the preparation. The APAAP method is suitable for use on blood and bone marrow films and permits good preservation of cell morphology. IP is simpler than APAAP and is useful for the study of mature and immature lymphoid cells, but bone marrow samples containing myeloid cells with endogenous peroxidase may give a false-positive reaction unless steps are taken to inhibit the endogenous peroxidase activity. Unfortunately, these procedures may affect cell morphology and thus defeat one of the purposes of the test.
Method
Method
Preparation of buffers and solutions
To prepare the working solution, dilute the stock solution 1:10 in 9 g/l NaCl.
Store in glass flasks at −20°C in 5 ml aliquots.
Thaw immediately before use; add 5 mg of fast red TR salt (Sigma-Aldrich) per vial and filter.
The developing solution is also available commercially as a kit.
Immunological Markers in Acute Leukaemia
Panel of McAb Useful for Diagnosis and Classification
Although there are a large number of McAb-recognizing antigens of haemopoietic cells, for practical reasons a well-defined set of reagents needs to be selected for the study of cases of acute leukaemia. The set of markers described here have been largely selected in accordance with the recommendations of the European Group for the Immunological Classification of Leukaemias (EGIL), the British Committee for Standards in Haematology and the World Health Organization (WHO) classification.10–12
An initial McAb panel should help to distinguish acute myeloid leukaemia (AML) from acute lymphoblastic leukaemia (ALL) and further classify ALL into B- or T-cell lineage (Table 16.1). This panel is constituted as follows:
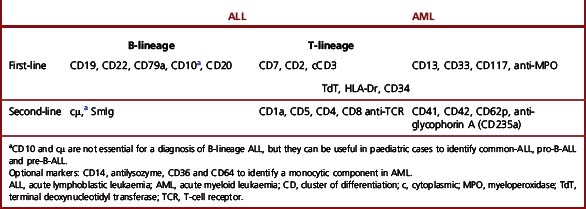
Two aspects that need to be considered are the lineage specificity of the antigen and whether it is expressed in the membrane or the cytoplasm. Some markers are highly specific and sensitive for a particular lineage (e.g. CD3 for T cells and anti-MPO for myeloid cells), whereas others (e.g. CD10, CD13 and CD7) are less lineage specific. Nevertheless, the latter may support a lymphoid or myeloid commitment in cases that are negative with the most specific markers or when results are equivocal. The second aspect to take into account is that the most specific markers are either expressed earlier in the cytoplasm than in the membrane during cell differentiation (e.g. CD3),13 or they are only detectable in the cytoplasm (e.g. MPO). Markers of haemopoietic precursors such as TdT or CD34, although not essential, are helpful when problems of differential diagnosis arise between acute leukaemias and lymphomas in leukaemia phase.
Immunological Classification of Acute Leukaemias
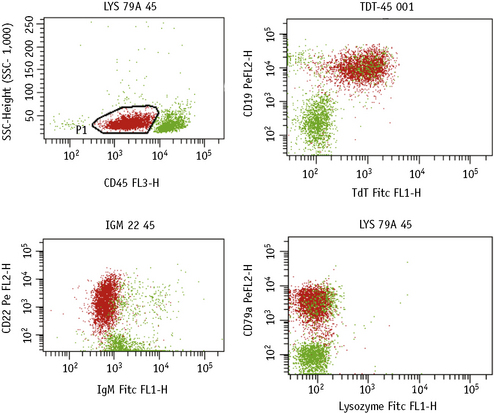
There are two major differentiation lineages in the lymphoid system, B and T, and lymphoblastic leukaemias arise from B- or T-precursor cells. Table 16.2 illustrates that only a few McAbs react positively with the most immature lymphoblasts; with maturation, however, more McAbs become reactive. Thus, to demonstrate all cases of leukaemia of a particular lineage, it is always important to include in the battery of McAbs those that will detect the most immature cells. B-lineage ALL is defined by the expression of at least two B-cell antigens, CD79a, CD19, CD10 and/or CD22; T-lineage ALL is defined by the expression of nuclear TdT and CD3. CD7 is also consistently positive in T-ALL. However, the expression of CD7 does not by itself define T-ALL because this McAb is positive in about 20% of cases of AML.
Table 16.2 Immunological classification of acute leukaemiasa
| Lymphoblastic leukaemia/lymphomas (ALL) (TdT+) |
| B-cell precursor (CD19+ and/or CD79a+ and/or CD22+) |
| pro-B-ALL (no expression of other B-cell markers) |
| common-ALL (CD10+, cytoplasmic μ−) |
| pre-B-ALL (cytoplasmic μ+) |
| T-cell precursor (cytoplasmic CD3+, CD7+)b |
| pro-T-ALL (no expression of other T-cell markers) |
| pre-T-ALL (CD2+ and/or CD5+) |
| cortical T-ALL (CD1a+) |
| mature T-ALL (membrane CD3+) |
| Acute myeloid leukaemias (AML) |
| AML (French-American-British [FAB] M0–M5) (anti-MPO+ and/or CD13+ and/or CD33+ and/or CD117+) |
| Pure erythroid leukaemia (anti-glycophorin A+, anti-blood group antigen+, CD36+) |
| Megakaryoblastic leukaemias (CD41+, CD42+, CD62P+). |
| Blastic plasmacytoid dendritic cell neoplasm |
| Miscellaneous |
| Mixed phenotype acute leukaemias (MPAL) (coexpression of myeloid and lymphoid markers)c |
| Myeloid antigen positive ALL |
| Lymphoid antigen positive AML |
| Natural killer (NK) cell lymphoblastic leukaemia/lymphoma |
| Acute undifferentiated leukaemia |
TdT, terminal deoxynucleotidyl transferase; MPO, myeloperoxidase.
a Adapted from the European Group for the Immunological Characterization of Leukemias (EGIL) classification.
b CD4 and CD8 are variably expressed.
c Definition of MPAL is described below.
B- and T-lineage ALL can be further subclassified on the basis of cell differentiation or maturation (Table 16.2). Although this subclassification is not essential for diagnosis, it can be useful because of the correlation between certain B-lineage subtypes and molecular cytogenetic and clinical features.
B-lineage ALL can be classified into three subtypes: pro-B-ALL (previously designated null-ALL), common-ALL and pre-B-ALL (Table 16.2). There is some correlation between these immunological subtypes and molecular genetics and prognosis. The majority of infant ALL with t(4;11)(q21;q23) and/or rearrangement of the MLL gene at 11q23 are pro-B-ALL and often express CD15, whereas the common-ALL phenotype is associated with hyperdiploidy or t(12;21) involving the ETV6 (TEL) gene, both associated with a good prognosis. The t(1;19)(q23;p13) is more common in the subset of pre-B-ALL. ‘Mature B-ALL’ (French-American-British, FAB, L3 ALL) is not classified as ALL in the WHO classification but is included in the group of high-grade, non-Hodgkin lymphomas (NHL) because it corresponds to the leukaemic manifestation of Burkitt lymphoma.12
T-lineage ALL can also be subdivided into several subgroups according to the stage of differentiation of the lymphoblasts. In the most immature form, or pro-T-ALL, blasts only express CD7 and cytoplasmic CD3; in pre-T-ALL, there is also expression of CD2 or CD5; cortical T-ALL is defined by the expression of CD1a; and in the rare mature T-ALL, blasts express membrane as well as cytoplasmic CD3 (Table 16.2). T-cell-associated antigens such as CD2, CD5, CD4, CD8 and TCR are expressed with variable frequency in the cortical and mature T-ALL; for instance, coexpression of CD4 and CD8, a phenotype characteristic of normal cortical thymocytes, is frequent in cortical T-ALL. In addition, mature T-ALL can be subclassified in two subgroups on the basis of the membrane expression of the T-cell receptor (TCR) complex molecules, αβ or γδ.
AML can be defined immunologically by the expression of two or more myeloid markers: CD13, CD33, CD117 and anti-MPO in the absence of lymphoid markers.10 The most specific marker for the myeloid lineage is MPO followed by CD117; as a rule, both are negative in ALL.19 There is no marker that allows the distinction between the various FAB subtypes of AML.20 However, some McAb may be preferentially positive in certain AML subtypes such as CD14, CD64 and antilysozyme in cases with monocytic differentiation, absence of HLA-Dr and CD34 expression in M3 AML or expression of CD19 in M2 AML. Furthermore, immunological markers are essential for the diagnosis of poorly differentiated myeloid leukaemias or M0 AML in which blasts do not show myeloid features by morphology or cytochemistry.21
In poorly differentiated leukaemias in which the first panel of lymphoid and myeloid markers does not show positive results, McAb against platelet glycoproteins Ib, the complex IIb/IIIa and IIIa (e.g. CD41, CD42 and CD62P) should be tested to confirm or exclude the diagnosis of acute megakaryoblastic leukaemia,10 and McAb to glycophorin A or to the red blood cell groups such as Gerbich should be used to confirm or exclude erythroid leukaemias. In addition, the WHO classification now considers a rare form designated blastic plasmacytoid dendritic neoplasm, previously included in the group of blastoid NK neoplasms, under the umbrella of AML. The neoplastic cells are CD4+, CD56+ and CD123+ and 50% of cases are CD68+. Rarely, they express T or myeloid associated markers.12
Immunophenotyping facilitates the diagnosis of an unusual form of acute leukaemia designated mixed phenotype acute leukaemia (MPAL). This leukaemia accounts for <5% of cases and is characterized by the coexpression of a constellation of myeloid and lymphoid antigens in the blast cells. The lack of agreement among various workers on the definition of MPAL has made it difficult to establish whether this constitutes a distinct clinicopathological entity. Until recently, the diagnosis of MPAL was based on a scoring system22,23 proposed by the EGIL group,10 which aimed to distinguish MPAL from cases of ALL or AML with aberrant expression of a marker from another lineage. In the 2008 WHO classification, the definition of this leukaemia was changed. The myeloid component is defined exclusively by positivity with anti-MPO or a positive cytochemical reaction for MPO and/or by clear evidence of a monocytic component by cytochemistry or immunophenotyping and the T-lymphoid component is defined by the expression of CD3 whether cytoplasmic or membrane. Since there is no marker specific for the B-lymphoid lineage, evidence of B-lymphoid differentiation should be based on the expression of CD19 plus another B-cell marker (CD10, CD22 or CD79) or weak/negative CD19 and strong expression of two of the specified B-cell markers. The WHO does not distinguish cases with co-expression of lymphoid and myeloid antigens (‘biphenotypic’) from those with two separate populations (‘bilineal’). Emphasis is made that some AML with recurrent chromosome abnormalities and those with a background of dysplasia should not be diagnosed as MPAL.12
In addition to MPAL, the WHO considers natural killer (NK) cell lymphoblastic leukaemia/lymphoma and acute undifferentiated leukaemia under the umbrella of acute leukaemias of ambiguous lineage.12 NK cell lymphoblastic leukaemia/lymphoma is a provisional entity. The lack of specific NK markers has made establishing a diagnosis difficult in such cases. However, this diagnosis should be considered in cases that are CD56+, CD94+ and CD161+ that may express immature T-cell-associated antigens such as CD7 and even c CD3 epsilon chain but lack Ig and TCR gene rearrangement and provided blastic plasmacytoid dendritic cell neoplasm has been excluded.12,24 The other rare subgroup is acute undifferentiated leukaemia in which the blasts lack T and myeloid specific markers, do not express B-lymphoid-associated markers and do not have features of other lineages (i.e. megakaryoblastic, erythroid or plasmacytoid dendritic cells). An extensive panel of McAb needs to be used for the diagnosis of this leukaemia. The blasts usually are HLA-Dr+, CD34+ and CD38+ and may be TdT+.
Immunological Markers in Chronic Lymphoproliferative Disorders
Panel of McAb for Diagnosis and Classification
The diagnosis of a B- or T-cell disorder requires a small but comprehensive battery of McAb. It is convenient to use a two-step procedure with an initial panel applicable to all cases and a second panel based on the results with the first panel and the tentative diagnosis by clinical features and/or cell morphology (Table 16.3).11,25
Table 16.3 Panel of monoclonal antibodies for the diagnosis of lymphoid disorders
| B cell | T cell | |
|---|---|---|
| First-line | SmIg (kappa/lambda), CD19, CD23, FMC7, SmCD79b, SmCD22, CD5a, CD20b | CD2, CD5a |
| Second-line | CD11c, CD25, CD103, CD123, CD38, CD138, cIg | CD3, CD4, CD7, CD8, CD57 |
a B-cell subset and T-cell marker. Optional markers: CD79a and natural killer associated (e.g. CD16, CD56 and CD11b).
b Not in initial panel but added because of relevance to treatment. c, cytoplasmic; Ig, immunoglobulin; Sm, surface membrane.
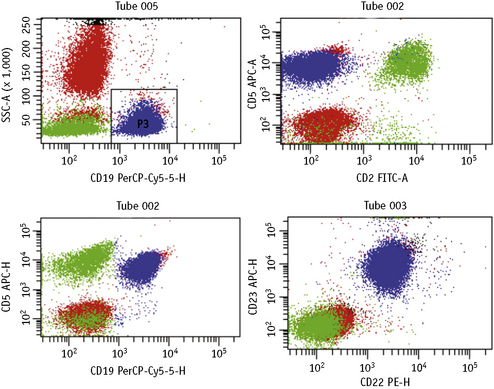
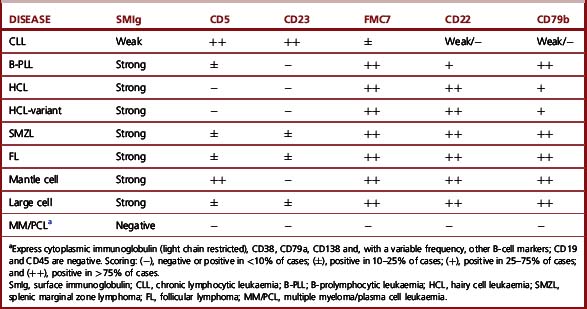
The first panel of markers is intended to distinguish B-cell from T-cell disorders, to demonstrate B-cell clonality, to confirm the diagnosis of CLL and to confirm or exclude a non-CLL B-cell neoplasm. It comprises immunostaining with anti-kappa and anti-lambda, CD2 or CD3 (T-cell marker), CD5 (a marker of T cells and a subset of B cells) and four McAbs that detect antigens in subsets of B cells: CD23, FMC7, CD79b against the β chain of the B-cell receptor and membrane CD22. With the two latter reagents, as well as surface Ig, assessment of the fluorescence intensity is important to distinguish between CLL and other B-cell disorders (Fig. 16.4). The results obtained with this set of McAbs can be combined into a scoring system (Table 16.4) to establish the diagnosis of CLL and to distinguish CLL cases with atypical morphology and CLL with increased numbers of prolymphocytes (CLL/PL) from other B-cell diseases such as B-cell prolymphocytic leukaemia (B-PLL) and B-cell lymphomas in leukaemic phase.25–27 The characteristic profile of CLL is that of a clonal B-cell with weak surface immunoglobulin (SmIg) usually IgM+IgD±, CD5+, CD23+, FMC7− and weak or negative CD79b and CD22.25–27 FMC7 has been shown to recognize an epitope of CD20 and it has been suggested that this marker could be replaced by CD20 in the diagnostic scoring system for CLL. However, data show that replacement of FMC7 by CD20 results in a decrease in sensitivity of the scoring because most cases of CLL express CD20 weakly.28 Nevertheless, although CD20 is not particularly useful for diagnosis, it should be incorporated into the panel of markers for chronic lymphoid disorders because it is used increasingly as a therapeutic tool in these conditions. Other markers that may be used include CD200, which appears to be useful in the CD5+ B-cell disorders to distinguish cases of CLL (CD200+) from mantle-cell lymphomas (CD200-),29 and Ki-67, which allows the estimation of the proliferative rate in cases of high-grade lymphoma.
Table 16.4 Scoring system for the diagnosis of chronic lymphocytic leukaemia (CLL)a
| Marker | Points | |
|---|---|---|
| 1 | 0 | |
| CD5 | Positive | Negative |
| CD23 | Positive | Negative |
| FMC7 | Negative | Positive |
| SmIgb | Weak | Moderate/strong |
| CD22/CD79bb | Weak/negative | Moderate/strong |
a Scores for CLL range from 3 to 5, whereas in the other B-cell disorders they range from 0 to 2.
When the marker profile using the first-line panel of McAb yields a B-cell phenotype not typical of CLL, a second panel of McAb can be used. This is selected in light of the review of the cell morphology, clinical information or other laboratory features. For example, estimation of the cell reactivity with four McAbs (CD11c, CD25, CD103 and CD123) is useful to distinguish hairy cell leukaemia (HCL) from other disorders with circulating villous cells that may be confused with HCL, such as splenic marginal zone lymphoma (SMZL) and the HCL variant. Cells from the majority of HCL cases coexpress three or four of the markers mentioned earlier, whereas SMZL and cells from HCL variant are positive with one or at most two of these markers.30 Among the four HCL-associated markers, CD123, which recognizes the β chain of the interleukin 3 receptor is the most useful in distinguishing HCL from SMZL and the variant form of HCL. CD123 is consistently expressed in HCL cells, whereas it is negative in the other two conditions.31
Unusual situations may occur in the case of plasma cell leukaemia and myeloma, in which the cells are negative with all T-cell and the majority of B-cell markers including surface Ig expression; clonal plasma cells express Ig only in the cytoplasm (with light chain restriction) and are positive with two common antigens, i.e. CD38 bright and CD138 in conjunction with negativity for CD45.32 The best approach to differentiate normal from neoplastic plasma cells is a multicolour methodology using CD45 negativity versus CD138 strong positivity as gating strategy. Multicolour flow cytometry staining using CD45, CD38, CD138, CD19, CD56, CD20 and cytoplasmic Ig light chains provides the most sensitive and specific method to distinguish normal from clonal plasma cells. Normal plasma cells are characterized by the expression of CD45, CD19, CD38 and CD138 with polyclonal expression of light chains. Clonal plasma cells are characterized by the expression of CD38, CD138, CD56 and intracytoplasmic light chain restriction with no detection of surface light chains and lack of expression of CD45 and CD19 and often no expression of CD20.
p53 protein
The p53 protein can be detected in cells by immunocytochemistry and flow cytometry with specific antibodies. There is a good correlation between p53 expression point mutation with or without deletion of TP53 genes. It therefore appears that there is no need for gene sequencing to be done on a routine basis because flow cytometry, fluorescence in situ hybridization (FISH) or both provide accurate information of the p53 status.33 Although not essential for diagnosis, this test may be useful as a prognostic indicator because of its correlation with resistance to purine analogue therapy and disease progression in patients with B-cell disorders, particularly CLL.33–35
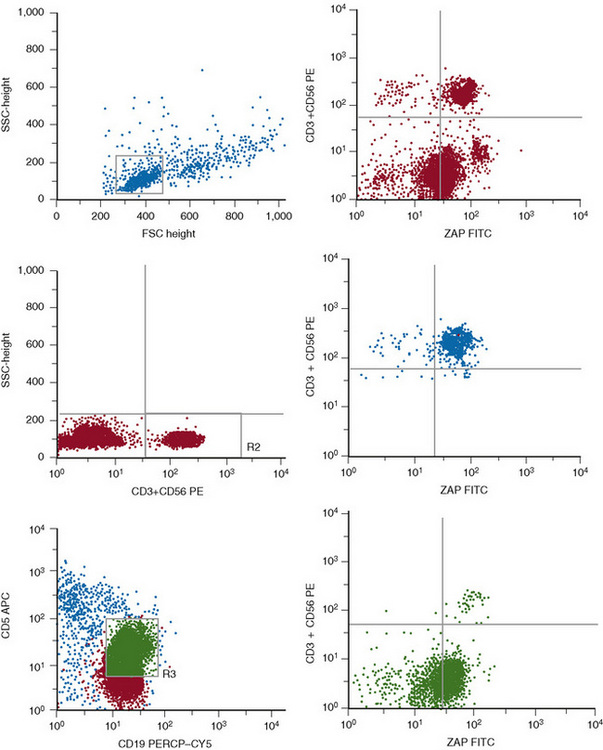
CD38 and ZAP70 expression
CD38 and ZAP70 are two markers shown to have a major prognostic impact in CLL. The expression of CD38 has emerged as a prognostic factor independent of the immunoglobulin heavy chain (IgHV) mutational status.36,37 CD38 should be assessed by a triple colour flow cytometry method to ensure that the expression is evaluated in the leukaemic cells. Although the first reports used thresholds of 20–30% CD38+ cells to consider this marker as positive, it has become apparent that there is intra-clonal diversity and that a threshold of 7% is the most reliable and informative in terms of prognosis.38,39 ZAP70 encodes a tyrosine kinase that is expressed in normal T cells, NK cells and a few B cells. Microarray studies in CLL have shown that the pattern of gene expression is very similar in cases with mutated or unmutated IgHV genes with only minor differences in a few genes. Among these, ZAP70 is preferentially expressed in the cases with unmutated IgHV; thus it was suggested that ZAP70 could be used as a surrogate marker for the IgHV mutational status. To this end, it is important to estimate its expression in purified B-CLL cells by RNA analysis or by a multicolour flow cytometric method that allows the simultaneous assessment of ZAP70 expression in T, NK and CLL cells (Fig. 16.5).39,40 At present, it is uncertain which is the best threshold (10% or 20%) for ZAP70+ CLL cells to consider that this marker is positive. There is now evidence that ZAP70 is not a surrogate marker for the unmutated IgVH. Discrepant results are seen in up to 30% of cases and the combination of CD38, ZAP70 and IgVH mutations is needed to establish the prognosis of CLL more precisely.39
McAb against the Variable Regions of the β TCR and Killer Immunoglobulin Receptors
There is a set of McAb that identifies T lymphocytes that bear the various variable regions of the TCR β and hence might be useful to demonstrate clonality of the T-cell population, particularly in cases with large granular lymphocyte (LGL) lymphocytosis, when molecular studies (e.g. polymerase chain reaction, PCR) cannot easily be performed. There is also a potential role in identifying T-cell clones in patients with hypereosinophilia. A good correlation between flow cytometry and PCR has been demonstrated with flow cytometry able to predict clonality with a sensitivity of 93% and specificity of 80%.41 McAb that recognize molecules belonging to the Ig superfamily, essentially the killer immunoglobulin receptors (KiRs) clustered under CD158a, CD158b, CD158c and CD158e, can also potentially recognize clonal LGL disorders and are particularly useful in those derived from NK cells in which clonality cannot be established by molecular tests.42
Immunological Profiles of Chronic Lymphoproliferative Disorders
The most common immunophenotypes of the B- and T-cell disorders are shown in Tables 16.5 and 16.6. CLL has a phenotype that clearly distinguishes this disease from the other B-cell leukaemias. By contrast, there is overlap on the marker expression in the other B-cell malignancies; for this reason, in cases with a B-cell marker profile different from CLL, the immunophenotypic analysis needs to be interpreted in the light of morphology and other clinical and laboratory information such as histology or genetic analysis to establish the precise diagnosis.27
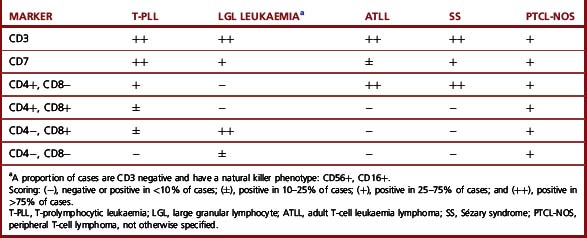
There is no specific immunological profile that distinguishes the various T-cell diseases (Table 16.6). However, expression of CD8 and CD57, with or without expression of NK-associated markers such as CD16 or CD56, is characteristic of T-cell LGL leukaemia, whereas such expression is rarely seen in other conditions.42 By contrast, coexpression of CD4 and CD8 is almost exclusively seen in approximately 25% of T-cell prolymphocytic leukaemia (T-PLL) (Table 16.6).43,44 Other markers may also be differentially expressed in various T-cell malignancies. Thus, for example, there is expression of CD25 in adult T-cell leukaemia lymphoma (ATLL); strong reactivity with CD7 in T-PLL;43–45 expression of granzyme B, TIA-1 or perforins in T-cell or NK-cell LGL leukaemias and TCR γδ in hepatosplenic T-cell lymphoma.42
Immunological Markers for the Detection of Minimal Residual Disease
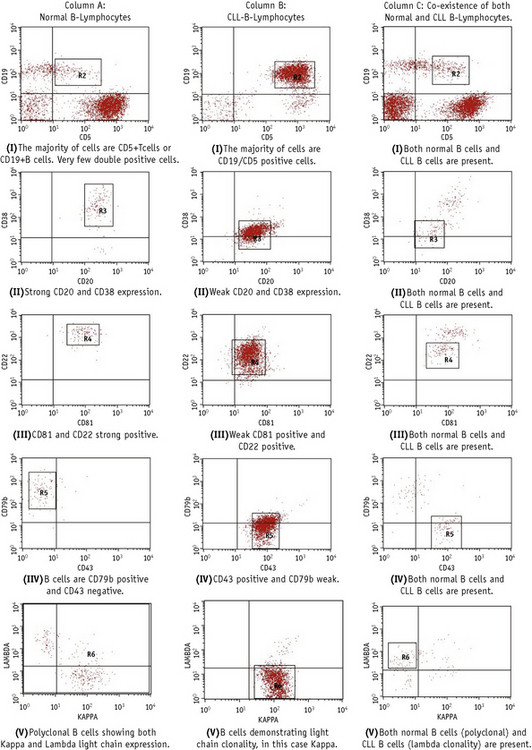
This is carried out by multicolour immunofluorescent methods with a combination of McAbs aimed at identifying ‘aberrant’ phenotypes not present in normal haemopoietic cells and/or by considering the different density in normal and leukaemic cells.46–48 For example, although normal bone marrows, particularly in infants or when regenerating after therapy, have a minor cell population with a B-cell precursor phenotype (e.g. TdT+, CD10+, CD19+), similar to that of ALL blasts, quantitative studies provide discrimination between the normal precursors (strong TdT and weak CD10 and CD19) and ALL blasts (weak TdT, strong CD10/CD19).47,48 Similarly, there is a small B-cell population in normal blood and bone marrow that coexpresses CD5, a phenotype characteristic of CLL. However, by estimating the proportions of CD5+ cells within the whole B-cell population (CD19+), it is possible to demonstrate whether cells represent residual leukaemia or normal B-lymphocytes. More recently a standardized multiparameter flow cytometry method has been described for CLL minimal residual disease (MRD). This combines sequential gating, i.e. lymphocytes (G1), CD19+ lymphocytes (G2) and CD5+/CD19+ (G3), with a comparison of the pattern of expression of the following McAbs: CD79b, CD20, CD38, CD81 and CD43 between normal and CLL cells (Fig. 16.6); this has been shown to have a sensitivity of 0.01%.49
In bone marrow tissue sections, occasional residual abnormal leukaemic cells can be highlighted and easily recognized using immunohistochemistry with markers known to react with the leukaemic cells, e.g. CD72 (DBA44) in HCL.50
1 Wood B.L., Arroz M., Barnett D., et al. Bethesda International Consensus 2006 recommendations on the immunophenotypic analysis of hematolymphoid neoplasia by flow cytometry: optimal reagents and reporting for the flow cytometric diagnosis of hematopoietic neoplasia. Cytometry B Clin Cytom. 2007;72(suppl 1):S41-S42.
2 Groeneveld K., Temarvelde J.G., van den Beemd M.W., et al. Flow cytometry detection of intracellular antigens for immunophenotyping of normal and malignant leukocytes. BTS Technical Report. Leukemia. 1996;10:1383-1389.
3 Pizzolo G., Vincenzi C., Nadali G., et al. Detection of membrane and intracellular antigens by flow cytometry following ORTHO PermeaFix fixation. Leukemia. 1995;9:226-228.
4 da Costa E.S., Peres R.T., Almeida J., et al. Harmonization of light scatter and fluorescence flow cytometry profiles obtained after staining peripheral blood leucocytes for cell surface-only versus intracellular antigens with the Fix & Perm reagent. Cytometry B Clin Cytom. 2010;78:11-20.
5 Pedreira C.E., Costa E.S., Barrena S., et alEuroFlow Consortium. Generation of flow cytometry data files with a potentially infinite number of dimensions. Cytometry A. 2008;73:834-846.
6 Bikoue A., George F., Poncelet L.W., et al. Quantitative analysis of leukocyte membrane antigen expression: normal adult values. Cytometry. 1996;26:137-147.
7 Poncelet P., George F., Papa S., et al. Quantitation of haemopoietic cell antigens in flow cytometry. Eur J Histochem. 1996;40(suppl 1):15-32.
8 Erber W.N., Mynheer L.C., Mason D.Y. APAAP labelling of blood and bone-marrow samples for phenotyping leukaemia. Lancet. 1986;i:761-765.
9 Mason D.Y., Erber W.N. Immunocytochemical labeling of leukemia samples with monoclonal antibodies by the APAAP procedure. In: Catovsky D., editor. The Leukemic Cell. Edinburgh: Churchill Livingstone; 1991:196.
10 Bene M.C., Castoldi G., Knapp W., et al. Proposals for the immunological classification of acute leukemias. Leukemia. 1995;9:1783-1786.
11 Bain B.J., Barnett D., Linch D., et al. Revised guideline on immunophenotyping in acute leukaemias and chronic lymphoproliferative disorders. Clin Lab Haematol. 2002;24:1-13.
12 Swerdlow S.H., Campo E., Harris N.L., et al, editors. World Health Organization (WHO) Classification of Tumours of Haemopoietic and Lymphoid Tissues. Lyon: IARC Press, 2008.
13 Janossy G., Coustan-Smith E., Campana D. The reliability of cytoplasmic CD3 and CD22 antigen expression in the immunodiagnosis of acute leukemia: a study of 500 cases. Leukemia. 1989;3:170-181.
14 O’Connor S.J., Forsyth P.D., Dalal S., et al. The rapid diagnosis of acute promyelocytic leukaemia using PML (5E10) monoclonal antibody. Br J Haematol. 1997;99:597-604.
15 Behm F.G., Smith F.O., Raimondi S.C., et al. Human homologue of the rat chondroitin sulfate proteoglycan, NG2, detected by monoclonal antibody 7.1 identifies childhood acute lymphoblastic leukemias with t(4;11)(q21;q23) or t(11;19)(q23;p13) and MLL rearrangements. Blood. 1996;87:1134-1139.
16 Wutchter C., Schnittger S., Schoch C., et al. Detection of acute leukemia cells with 11q23 rearrangements by flow cytometry: sensitivity and specificity of monoclonal antibody 7.1. Blood. 1998;92(suppl 1):228a.
17 Smith F.O., Rauch C., Williams D.E., et al. The human homologue of rat NG2, a chondroitin sulfate proteoglycan, is not expressed on the cell surface of normal hematopoietic cells but is expressed by acute myeloid leukemia blasts from poor-prognosis patients with abnormalities of chromosome band 11q23. Blood. 1996;87:1123-1133.
18 Mauvieux L., Delabesse E., Bourquelot P., et al. NG2 expression in MLL rearranged acute myeloid leukaemia is restricted to monoblastic cases. Br J Haematol. 1999;107:674-676.
19 Bene M.C., Bernier M., Casasnovas R.O., et al. The reliability and specificity of c-kit for the diagnosis of acute myeloid leukemias and undifferentiated leukemias. Blood. 1998;92:596-599.
20 Bennett J.M., Catovsky D., Daniel M.T., et al. Proposed revised criteria for the classification of acute myeloid leukemia. Ann Intern Med. 1985;103:620-625.
21 Bennett J.M., Catovsky D., Daniel M.T., et al. Proposals for the recognition of minimally differentiated acute myeloid leukaemia (AML-MO). Br J Haematol. 1991;78:325-329.
22 Buccheri V., Matutes E., Dyer M.J.S., et al. Lineage commitment in biphenotypic leukemia. Leukemia. 1993;7:919-927.
23 Matutes E., Morilla R., Farahat N., et al. Definition of acute biphenotypic leukemia. Haematologica. 1997;82:64-66.
24 Feulliard J., Jacob M.C., Valensi F., et al. Clinical and biological features of CD4+ CD56+ malignancies. Blood. 2002;99:1556-1563.
25 Matutes E., Owusu-Ankomah K., Morilla R., et al. The immunological profile of B-cell disorders and proposal of a scoring system for the diagnosis of CLL. Leukemia. 1994;8:1640-1645.
26 Moureau E.J., Matutes E., A’Hern R.P., et al. Improvement of the chronic lymphocytic leukemia scoring system with the monoclonal antibody SN8 (CD79b). Am J Clin Pathol. 1997;108:378-382.
27 Matutes E., Attygale A., Wotherspoon A., et al. Diagnostic issues in chronic lymphocytic leukaemia (CLL). Best Pract Res Clin Haematol. 2010;23:3-20.
28 Delgado J., Matutes E., Morilla A., et al. Diagnostic significance of CD20 and FMC7 expression in B cell disorders. Am J Clin Pathol. 2003;120:754-759.
29 Palumbo G.A., Parrinello N., Fargione G., et al. CD200 expression may help in differential diagnosis between mantle-cell lymphoma and B-cell chronic lymphocytic leukaemia. Leuk Res. 2009;33:1212-1216.
30 Matutes E., Morilla R., Owusu-Ankomah K., et al. The immunophenotype of hairy cell leukemia (HCL): proposal for a scoring system to distinguish HCL from B-cell disorders with hairy or villous lymphocytes. Leuk Lymphoma. 1994;14(suppl 1):57-61.
31 del Giudice I., Matutes E., Morilla R., et al. The diagnostic value of CD123 in B-cell disorders with hairy or villous lymphocytes. Haematologica. 2004;89:303-308.
32 Craig F.E., Foon K.A. Flow cytometric immunophenotyping for hematologic neoplasms. Blood. 2008;111:3941-3967.
33 Thornton P.D., Gruzka-Westwood A.M., Hamoudi R.A., et al. Characterization of TP53 abnormalities in chronic lymphocytic leukaemia. Hematol J. 2004;5:47-54.
34 Lens D., Dyer M.J., Garcia Marco J.A., et al. p53 abnormalities in CLL are associated with excess of prolymphocytes and poor prognosis. Br J Haematol. 1997;99:848-857.
35 Dohner H., Fischer K., Bentz M., et al. p53 gene deletion predicts for poor survival and non-response to therapy with purine analogs in chronic B-cell leukemias. Blood. 1995;85:1580-1589.
36 Damle R.N., Walie T., Fais F., et al. Immunoglobulin V gene mutation status and CD38 expression as novel prognostic indicators in chronic lymphocytic leukemia. Blood. 1999;94:1840-1847.
37 Ibrahim S., Keating M., Do K.-A., et al. CD38 expression as an important prognostic factor in B-cell chronic lymphocytic leukaemia. Blood. 2001;98:181-186.
38 Thornton P.D., Fernandez C., Giustolisi G., et al. CD38 as a prognostic indicator in chronic lymphocytic leukaemia. Hematol J. 2004;5:145-151.
39 Morilla A., Gonzalez de Castro D., Del Giudice I., et al. Combinations of ZAP-70, CD38 and IGHV mutational status as predictors of time to first treatment in CLL. Leuk Lymphoma. 2008;49:2108-2115.
40 Crespo M., Bosch F., Villamor N., et al. ZAP-70 expression as a surrogate for immunoglobulin-variable-gene region mutations in chronic lymphocytic leukemia. N Engl J Med. 2003;348:1764-1775.
41 Lima M., Almeida J., Santos A.H., et al. Immunophenotypic analysis of the TCR-Vbeta repertoire in 98 persistent expansions of CD3(+)/TCR-alphabeta(+) large granular lymphocytes: utility in assessing clonality and insights into the pathogenesis of the disease. Am J Pathol. 2001;159:1861-1868.
42 Matutes E. Immunological and clinical features of T-cell large granular lymphocyte leukaemia. The education programme for the annual congress of European Hematology Association. Haematologica. 2009;3:302-307.
43 Matutes E. Chronic T-cell lymphoproliferative disorders. Rev Clin Exp Hematol. 2003;6:401-420.
44 Matutes E., Brito-Babapulle V., Swansbury J., et al. Clinical and laboratory features of 78 cases of T-prolymphocytic leukemia. Blood. 1991;78:3269-3274.
45 Ginaldi L., Matutes E., Farahat N., et al. Differential expression of CD3 and CD7 in T-cell malignancies: a quantitative study by flow cytometry. Br J Haematol. 1996;93:921-927.
46 Bene M.C., Kaeda J.S. How and why minimal residual disease studies are necessary in leukaemia: a review from WP10 and WP12 of the European Leukaemia Net. Haematologica. 2009;94:1135-1150.
47 Farahat N., Lens D., Zomas A., et al. Quantitative flow cytometry can distinguish between normal and B-cell precursors. Br J Haematol. 1995;91:640-646.
48 Campana D., Counstan-Smith E. Advances in the immunological monitoring of childhood acute lymphoblastic leukaemia. Best Pract Res Clin Haematol. 2002;15:1-19.
49 Rawston A.C., Villarmor N., Ritgen M., et al. International standardized approach for flow cytometric residual disease monitoring in chronic lymphocytic leukaemia. Leukemia. 2007;21:956-964.
50 Matutes E., Meeus P., McLennan K., et al. The significance of minimal residual disease in hairy cell leukaemia treated with deoxycoformycin: a long-term follow-up study. Br J Haematol. 1997;98:375-383.