CHAPTER 5 Imaging techniques in gynaecology
Introduction
Since the discovery of X-rays by Roentgen in 1895, there has been an explosion in technology for imaging the human body; in addition to ionizing radiation, high-frequency sound (Wade 1999), radiolabelled pharmaceuticals and non-ionizing radiation in strong magnetic fields are used. The parallel expansion in computer technology has enabled the development of cross-sectional imaging using computed tomographic (CT) techniques, and three-dimensional imaging using magnetic resonance imaging (MRI) data.
Methodology
Ultrasound
In Glasgow in 1950, Ian Donald used an industrial flaw detector, designed for testing the integrity of steel boilers, to demonstrate that the massive abdominal swelling of one of his patients was fluid and not solid (Kurjak 2000). A large ovarian cyst that proved to be benign was subsequently removed. Since then, the rapid and continuing evolution of ultrasound technology has led to a proliferation of applications in almost all aspects of medicine and surgery.
The choice of frequency is a compromise between the spatial resolution and the depth of penetration required. The higher the frequency, the better the resolution, but the greater the attenuation of the beam within the tissues. Hence, for abdominal scanning, frequencies of between 3.5 and 5 MHz are commonly employed. Probes designed for intracavitary and intraoperative use employ higher frequencies (8–15 MHz) because the organs of interest are closer to the transducer. This enables higher resolution images to be obtained, and also allows study of the movement of structures when pressure is applied to the probe, which gives important diagnostic clues on their relative mobility. The drawbacks of transvaginal scanning are practical (intolerance of the probe by the very young and old, and in the presence of scarring) and diagnostic (the depth of view is limited to approximately 70 mm) (Bennett and Richards 2000). By sweeping an array through the tissues, a three-dimensional scan can be created; while most useful in obstetrics to visualize complex structures such as the fetal face, it also displays uterine anatomy well (Alcazar and Galvan 2009).
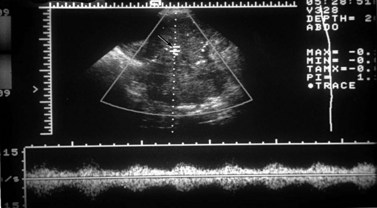
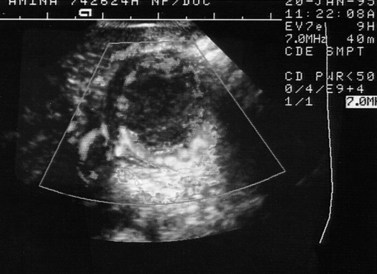
Doppler operates by detecting the change in frequency of ultrasound echoes caused by movement of the target. In the simplest system, this is done continuously with only minimal control of the beam direction. Continuous wave Doppler is well suited to fetal heart monitoring, especially because movements of the fetus do not interrupt the signal. In gynaecology, the vessels of interest are small so precise placement of the Doppler sample is a prerequisite. This can be achieved with pulsed Doppler. The Doppler gate is superimposed on a real-time image that allows the target to be pinpointed (Figure 5.1). The Doppler signal depicts a range of blood velocities occurring in the selected vessel over time. Output can be audio or as a strip chart on which intensity indicates the strength of the signal at each velocity in the spectrum. A variety of measurements can be made from these tracings, the most useful of which are systolic/diastolic velocity ratios. These are measures of the arteriolar resistance to flow, with a low value indicating low vasomotor tone, typical of the placenta and the corpus luteum. This pattern also occurs in inflammation and malignancy. High indices are typical of inactive tissue, such as the resting uterus. Doppler can be used to measure fetal and uteroplacental blood flow, thereby producing physiological information (Brinkman and Wladimiroff 2000).
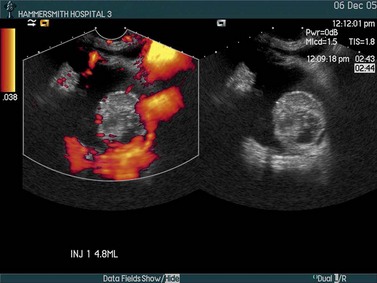
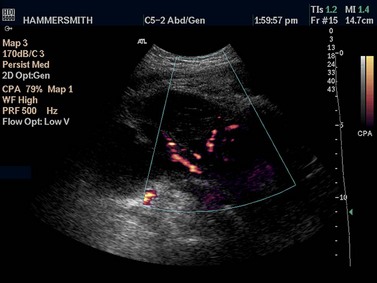
In colour Doppler scanning, the same process is applied across an area of interest. The velocity signals are presented as a colour-coded overlay, superimposed on the real-time scan (Figure 5.2). Although the Doppler information is less rich than with spectral Doppler (only the mean velocity or the amount of flow is depicted), the angiogram-like map provides information on the morphological arrangement of the vascular tree, and its sensitivity allows vessels as small as approximately 1 mm in diameter to be detected. Colour Doppler is often used to locate a vessel to guide placement of the spectral Doppler gate for haemodynamic analysis.
Magnetic resonance imaging
The female pelvis is suitable for MRI examination because of the minimal effect of respiratory motion on the pelvic organs. By placing the receiver coil adjacent to the tissue of interest (e.g. endovaginally to maximize signal from the cervix), very-high-resolution images of an area of interest may be obtained. However, as the data to produce a set of images are accumulated over 5–10 min, patients are required to remain still during this time. If multiple sequences and multiple planes are employed, the total imaging time may exceed 30 min which reduces patient tolerance. However, newer faster pulse sequences with breath-hold techniques and improved computer software are greatly reducing scan times. Recently, open design MR scanners and production of MR-compatible equipment has produced an explosion in the field of ‘interventional MRI’. This has expanded the applications of MRI from being purely diagnostic to its use during treatment, such as for placing brachytherapy implants (Popowski et al 2000) or monitoring thermal ablative therapy.
Radionuclide imaging
The purity and specificity of monoclonal antibodies gives them an important role in tumour detection and possibly in the targeting of antitumour agents. Different anticytokeratin antibodies may help in distinguishing a primary ovarian adenocarcinoma from a metastatic adenocarcinoma, especially of colorectal origin (McCluggage 2000). These antibodies have also helped to clarify the origin of the peritoneal disease in most cases of pseudomyxoma peritonei. In recent years, several studies have also investigated the value of a variety of monoclonal antibodies in the diagnosis of ovarian sex cord stromal tumours, and in the distinction between these neoplasms and their histological mimics. Of these, anti-alpha-inhibin and CD99 appear to be of most diagnostic value (Choi et al 2000). Antibodies should always be used as part of a larger panel and not in isolation.
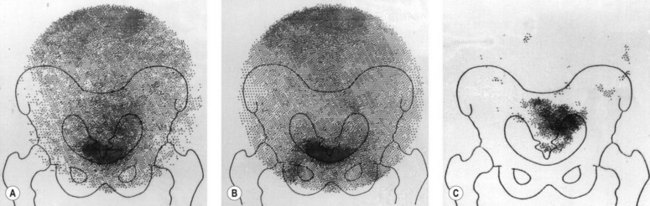
Following injection of the antibody, a gamma camera provides serial images of the distribution and uptake of radiolabelled antibody between 18 and 72 h after the antibody has been administered. The radionuclide 111In is ideally suited for tomographic studies using images produced by a gamma camera mounted on a gantry which rotates through 360°. The images are reconstructed by computer in the same manner as X-ray CT. 111In-labelled antibody is taken up into the liver, spleen, bone marrow and, occasionally, adrenal glands but is a more suitable radiolabel than 131I. Excretion of 111In into the bladder has not been a problem, although non-specific bowel uptake may account for false-positive results. An example of an 111In study is shown in Figure 5.3. A central area of increased uptake is apparent at the site of a primary ovarian cancer.
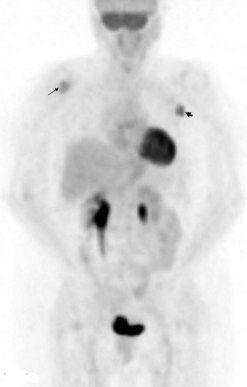
18FDG (18fluorodeoxyglucose) is a non-specific positron-emitting tracer. It is an analogue of glucose, thereby reflecting metabolism and detecting the increased glycolysis associated with several tumour types. It gains entry into cells by membrane transporter proteins, such as Glut-1, which are expressed in many tumours. It is phosphorylated intracellularly to FDG-6-phosphate and retained within malignant cells. Tumour hypoxia may also increase 18FDG accumulation via activation of glycolysis. The quantitative parameter used is typically a standardized uptake value (SUV), which represents the tissue activity within a region of interest corrected for the injected activity and the patient’s body weight. A new lesion (Figure 5.4) or a rise in SUV within a lesion indicates disease progression. Whether this can be used as a marker for early therapy remains to be proven.
Clinical Applications
Normal anatomy and variations
Uterus
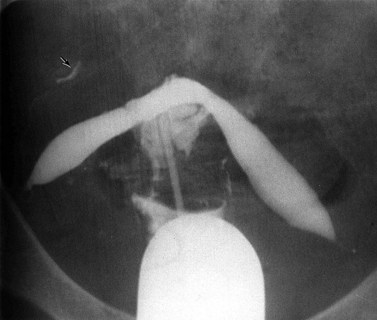
The normal uterine cavity is delineated as a triangular structure on hysterosalpingography, with the cornua and the internal cervical os as the corners. Intracavitary abnormalities, both congenital and acquired, such as internal septations and divisions may be defined using this technique (Figure 5.5). Similar information can be acquired with ultrasound following instillation of saline into the uterine cavity (hysterosonography) (van den Brule et al 1998).
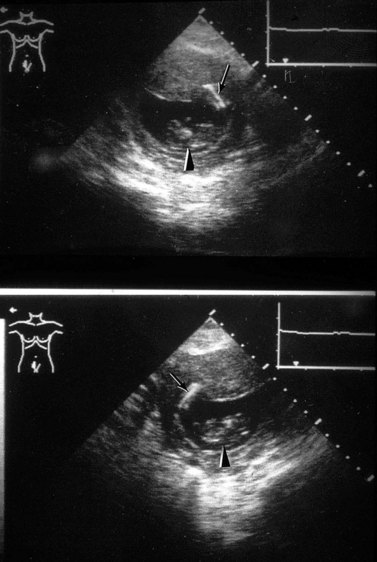
On ultrasound, the uterine cavity is normally represented by a bright line of apposition of the endometrial layers, although occasionally a trace of fluid can be seen at menstruation. Persistent fluid or fluid in a non-menstruating woman is abnormal. In adolescence, it may be caused by vaginal atresia, where the upper vagina dilates more than the uterus so that haematocolpos dominates the picture, while in postmenopausal women, cervical stenosis, either fibrotic or malignant, must be considered. Ultrasound is also useful in detecting the position of an intrauterine device; provided the coil lies in the uterus, it is easy to locate, but a coil that has penetrated through the myometrium is obscured by echoes from bowel gas (Figure 5.6).
The entire uterus can be imaged using ultrasound (Figure 5.7) and its size measured accurately. This is useful in precocious or delayed puberty and in planning brachytherapy. The endometrium is seen as an echogenic layer of uniform texture, often with a fine echo-poor margin. Its thickness varies through the menstrual cycle from 12 mm premenstrually (double-layer thickness) to a thin line after menstruation. The endometrium gradually thins after menopause unless supported by hormones.
The morphology of the normal uterus, however, is best defined on MRI where its zonal architecture may be recognized (Hricak et al 1983). On T2-weighted images, the endometrium is seen as a central high-signal stripe which increases in thickness in the secretory phase of the menstrual cycle. The inner myometrium (junctional zone) is of lower signal intensity than the outer myometrium on T2 weighting, and correlates histologically with a layer of more densely packed smooth muscle.
Fallopian tubes
The patency of the fallopian tubes may be demonstrated on hysterosalpingography where filling and free spill into the peritoneal cavity may be seen (Figure 5.5). Ultrasound contrast salpingography is currently being evaluated to reduce the radiation dose to the ovaries in patients trying to conceive. Normal uterine tubes cannot be demonstrated on ultrasound, but instillation of microbubble contrast agents into the uterus and tubes permits their visualization and can be used as an initial screening test for tubal patency. Although the anatomical detail is less than that offered by conventional X-ray salpingography and false-positive results occur, this technique of ultrasound salpingography seems likely to find an important role as an initial screen; if the tubes are demonstrated to be patent, no further investigation is necessary and this should result in a reduction of radiation exposure (Van Voorhis 2008).
Ovaries
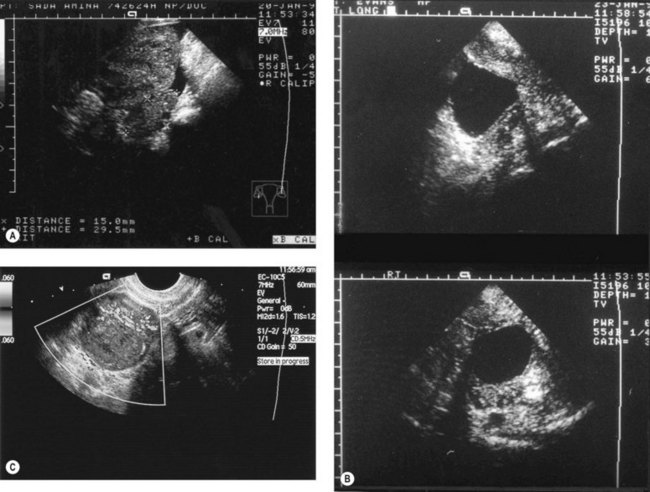
The ovaries are best imaged with ultrasound (either transabdominal or, preferably, transvaginal). Changes in their appearance can be correlated with their functional status. Infantile ovaries are small (except in the neonate when hypertrophy and follicles stimulated by maternal hormones may be a surprising finding) and they enlarge before puberty. Follicular development begins before menstruation, but these cycles and those at the menopause are often imperfect so that follicles may persist and continue enlarging for several months. Normally, ovulation occurs at a follicle size of 20–25 mm diameter and the echo-free follicle is replaced by a corpus luteum which can be cystic or solid. Corpora lutea produce a confusing variety of appearances, whose only consistent feature is their transience (Figure 5.8A–C). In doubtful cases, a rescan at 6 weeks to image them at a different phase of the cycle may be needed to resolve their identity. The postmenopausal ovary is usually too small to identify with ultrasound.
Ovarian varices
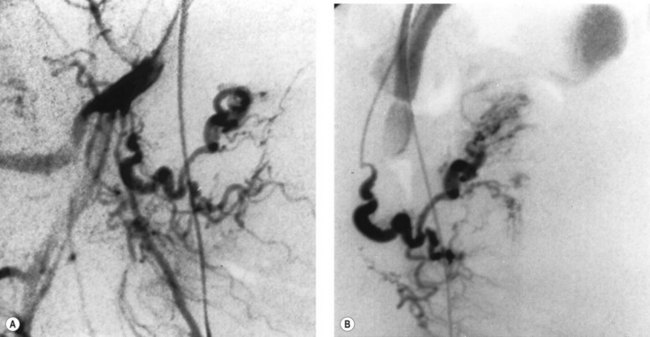
The pelvic congestion syndrome is one of many causes of chronic pelvic pain, and is associated with the presence of large varices within the broad ligaments (Liddle and Davies 2007). When pelvic symptoms are severe, there may be gross dilatation of the ovarian veins, with reflux down into the pelvis and often into the legs. These vessels are best demonstrated by selective ovarian venography, although they may also be imaged with Doppler ultrasound (Haag and Manhes 1999). Venography is performed via a femoral or internal jugular venous approach, and the ovarian veins are selectively catheterized with an appropriately shaped angiographic catheter. Satisfactory retrograde opacification of pelvic varices is achieved by injecting contrast medium through the selectively placed catheter with the patient almost upright on a tilting table, while the Valsalva manoeuvre is performed.
Treatment of this condition is primarily surgical and consists of venous ligation. Symptomatic relief has been reported following transcatheter ovarian vein embolization (Ganeshan et al 2007).
Investigation of female infertility
Transvaginal sonography has largely replaced the transabdominal approach in infertility practice because of the superior anatomical display and because it allows precisely guided aspiration of follicles and fluid in the pouch of Douglas. More precise measurement of follicles is possible, and the corpus luteum is easily recognized. In the midluteal phase, it appears as an oval structure 30–35 mm long and 20–25 mm wide with a wide variety of sonographic appearances (Baerwald et al 2005). Endometrial reflectivity patterns have been proposed as another way to assess ovulation (Randall et al 1989). Ultrasound can only provide presumptive evidence of ovulation/pregnancy. The collection of secondary oocytes constitutes definitive evidence of ovulation. The appearance of internal echoes before the follicle reaches 18 mm or continuous enlargement to 30–40 mm indicates follicular failure.
The waveforms of blood flow in vessels supplying the ovaries of women undergoing IVF have been studied using transvaginal power Doppler ultrasound (Palomba et al 2008). The observation of blood flow patterns did not improve any reproductive outcomes and is currently not advocated in IVF programmes.
MRI is valuable in the investigation of infertility where uterine pathology is suspected, and provides a particularly high diagnostic yield in patients with dysmenorrhoea and menorrhagia (deSouza et al 1995). It should be part of the investigation of patients with persistent unexplained infertility awaiting costly procedures such as gamete intrafallopian transfer and IVF. MRI should also be used before myomectomy in order to differentiate between leiomyoma and adenomyoma, as attempts to perform a myomectomy on a localized adenomyoma often result in extensive uterine damage.
Adenomyosis and endometriosis
The diagnosis of adenomyosis is often suggested by symptoms of hypermenorrhoea and dysmenorrhoea, but similar symptoms are also produced by leiomyomas. Hysterosalpingography may show multiple small tracks of contrast extending into the myometrium but is now obsolete. Ultrasound in skilled hands may be useful (Dueholm and Lundorf 2007).
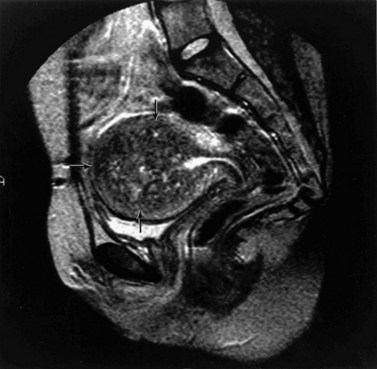
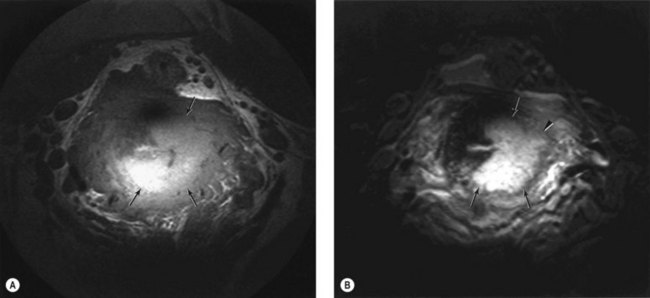
Adenomyosis is best demonstrated on T2-weighted MRI, with which two patterns (focal and diffuse) can be recognized (Hricak et al 1992, Byun et al 1999). In focal adenomyosis, there is a localized ill-defined mixed-signal-intensity mass (adenomyoma) within the myometrium (Figure 5.9). Diffuse adenomyosis presents with diffuse or irregular thickening of the junctional zone, often with underlying high-signal foci (Figure 5.10). Pathologically, this represents smooth muscle hypertrophy and hyperplasia surrounding a focus of basal endometrium. It is the smooth muscle changes that are easily recognized by MRI rather than the foci of heterotopic glandular epithelium. Values for junctional zone thickness from >5 to >12 mm have been suggested for the diagnosis of adenomyosis. In the authors’ experience, however, the thickening of the junctional zone that is described in adenomyosis (Reinhold et al 1999) is not diagnostic of adenomyosis on its own; it may be seen in hypermenorrhoea where no pathological evidence for adenomyosis has subsequently been shown. In these instances, absolute values for junctional zone widths are unhelpful (Hauth et al 2007), and ratios to the width of the outer myometrium or the cervical stroma may be more meaningful.
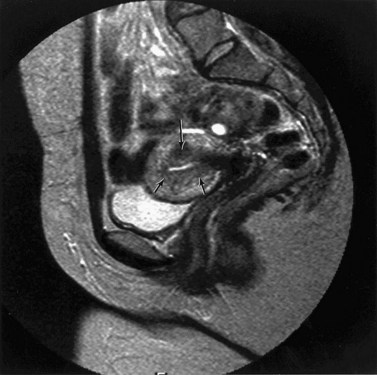
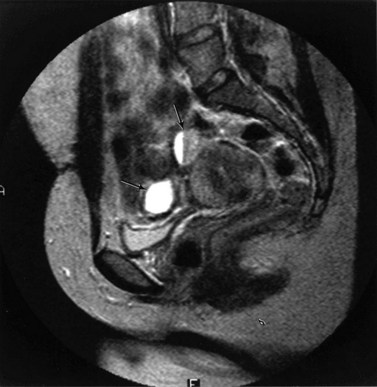
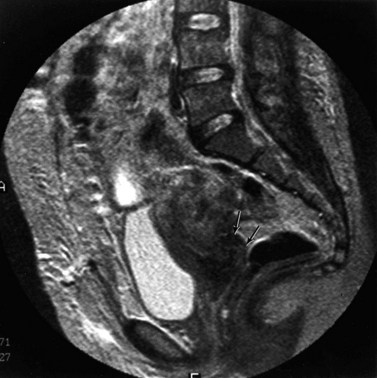
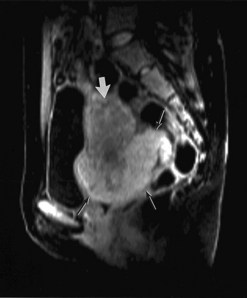
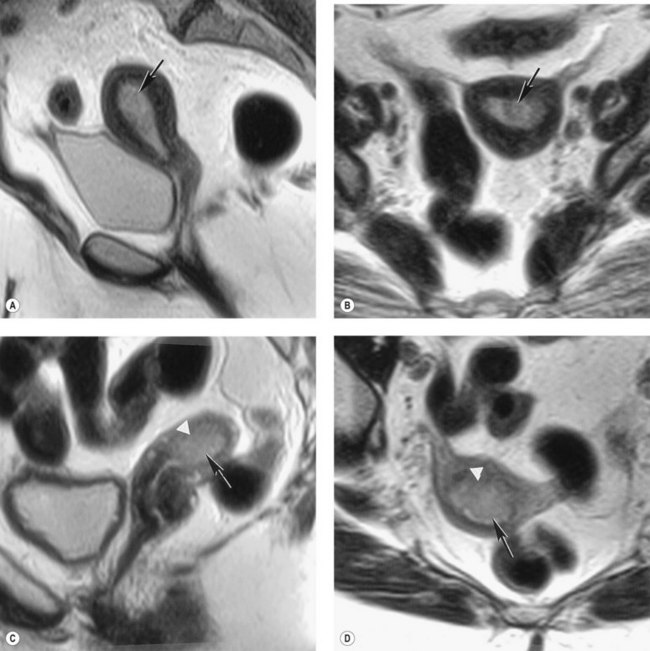
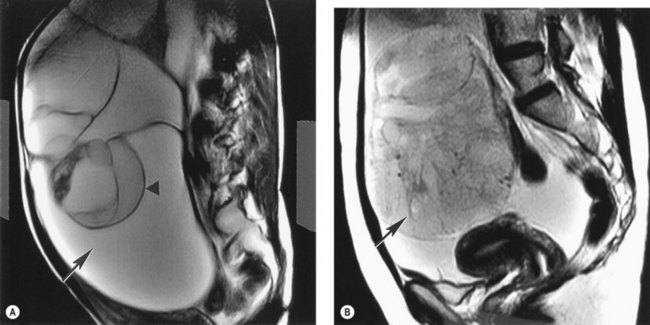
The lesions of endometriosis are difficult to detect with imaging techniques, mainly because of their small size. Only larger endometriomas can be detected on ultrasound and are seen as well-defined spaces, most commonly in the adnexal region (Figure 5.11). The role of MRI in the diagnosis of endometriosis also depends on the site of the endometriotic implants; deposits on the ovarian cortex are much more readily identified than small peritoneal deposits. The latter are recognized at laparoscopy but may be missed on MRI (Brosens et al 2004). Endoscopic ultrasound has been advocated to improve the diagnosis of endometriotic infiltration into the digestive tract (Dumontier et al 2000). MRI is particularly valuable in detecting deep enclosed endometriosis typically found in the uterosacral ligaments and rectovaginal septum (Figure 5.12) commonly associated with pelvic pain. Deep pelvic endometriosis consists mainly of fibromuscular rather than endometrial tissue (Del Frate et al 2006), and often goes undetected on visual inspection of the pelvic cavity because of its position. However, MRI lacks sensitivity in detecting rectal endometriosis if the rectum is not distended (Kinkel et al 1999). More recently, there have been isolated reports correlating an increased junctional zone thickness with endometriosis in patients with infertility (Kunz et al 2000).
Leiomyomas
MRI has been reported to be superior to ultrasound for the diagnosis of leiomyomas (Ascher et al 1994). Characteristic well-defined low-intensity masses are seen within the myometrium on T2-weighted scans, often with high-signal foci within them. There are no completely reliable features that distinguish fibroids from leiomyosarcomas on ultrasound or MRI, and even Doppler has proved disappointing here. In those patients presenting with more advanced disease, alterations in the lesion margins may suggest malignant change.
Ectopic pregnancy
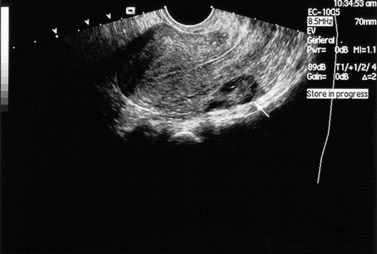
The role of ultrasound in the diagnosis of ectopic gestations has been strengthened by the use of transvaginal probes and the introduction of Doppler. A weakness of transabdominal scanning was the difficulty in demonstrating the sac itself, because of gas in overlying or adherent bowel. With transvaginal scanning, the adnexal sac can be demonstrated and women at high risk can be monitored through the first few weeks of pregnancy (Figure 5.13). Early ectopic sacs can be treated by injection of potassium chloride or methotrexate under ultrasound guidance. This approach is especially useful in IVF programmes where sparing the uterine tubes is important.
Infections
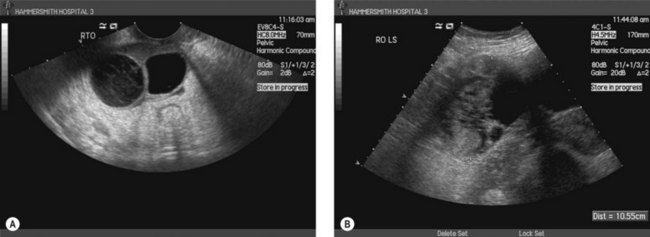
Ultrasound is useful in the diagnosis and management of ovarian abscesses, where shaggy walled cavities can be demonstrated in the adnexal region (Figure 5.14). They usually have a vascular pseudocapsule that can be demonstrated on colour Doppler. However, in pelvic inflammatory disease without abscess formation, the ultrasonic changes are too subtle to make this a useful technique. Monitoring the effects of antibiotic treatment on tubo-ovarian abscesses may be useful, although, in some cases, sterile cavities persist for many weeks after signs of infection have been controlled. The hydrosalpinx that complicates pelvic inflammatory disease is seen as a funnel-shaped cavity in the adnexal region with thin walls and no internal echoes.
Venous thrombosis
Inferior vena cava filter insertion
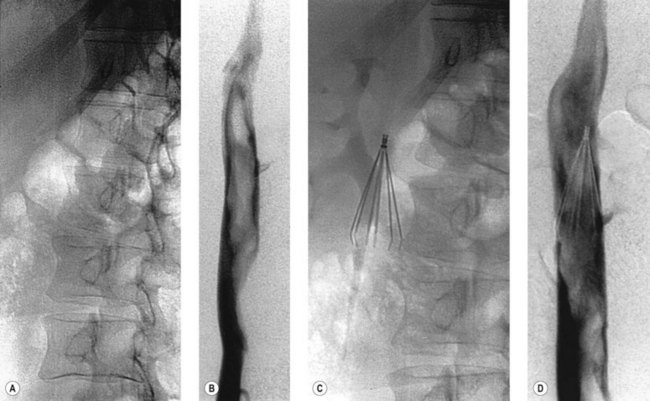
The indications for insertion of an inferior vena cava filter are listed in Box 5.1. The procedure is easily performed via femoral or jugular venous punctures, and some devices may even be inserted through a sheath introduced into an antecubital fossa vein. The majority of these filters are inserted permanently; short-term placement is possible, however, and is most commonly indicated in the late stages of pregnancy (when free-floating thrombus is demonstrated or when a recent pulmonary embolus has occurred), or prior to surgical removal of a large pelvic tumour which has caused compression and thrombosis of one or both iliac veins. Two types of short-term filter may be used: temporary and retrievable.
Haemorrhage
There is a strong argument in favour of angiography and embolization prior to arterial ligation or hysterectomy in hospitals having the necessary expertise. Bleeding sites are often impossible to localize at surgery (hence the necessity for non-specific ligation of the internal iliac artery), but are usually easily identified at angiography; selective occlusion of the haemorrhaging vessel can then be performed with a much higher likelihood of controlling bleeding (Figure 5.16). Previous internal iliac artery ligation does not necessarily prevent successful arterial embolization but may make the procedure technically more difficult (Collins and Jackson 1995).
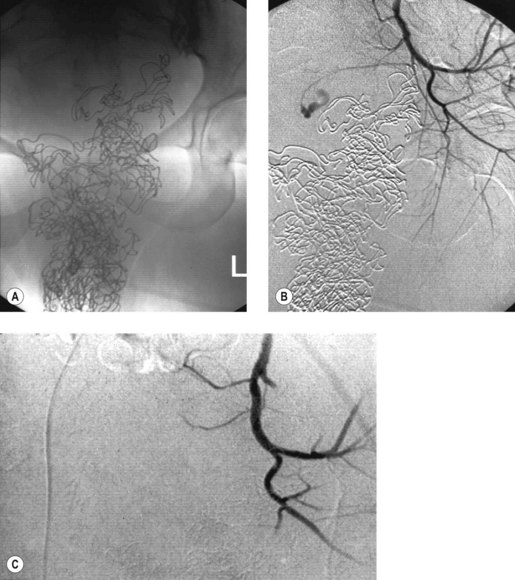
Embolization is very successful in a variety of gynaecological disorders complicated by bleeding. For certain conditions (e.g. uterine arteriovenous malformations, bleeding from recurrent cervical carcinoma), this should be considered as the procedure of first choice (Figure 5.17). In others, it may be life-saving when more conventional treatment has failed.
Cervical carcinoma
The cervix
In cervical carcinoma, precise staging of the primary disease provides a prognosis, allows the institution of correct treatment and permits comparison of different treatment protocols. Clinical staging, applied according to the system of the International Federation of Gynecology and Obstetrics, is subjective and is still widely used. Imaging with ultrasound does not improve the accuracy of clinical staging (Fotopoulou et al 2008), with poor image quality and difficulty in interpretation as the major problems. Although transrectal ultrasound produces clearer views of the cervix, definition of tumour from normal cervix is still poor. The same difficulty limits the value of CT because the normal cervix and cervical carcinomas have similar attenuation values, so the tumour can only be recognized if it alters the contour or size of the cervix (Subak et al 1995). MRI is now widely recognized as the staging modality of choice.
Several studies confirm the accuracy of MRI in the staging of early cervical cancer in comparison to surgical staging (Whitten and deSouza 2006). The primary tumour is best assessed using T2-weighted MRI, which is superior to CT in detection (sensitivity 75% vs 51%, P < 0.005) and staging (accuracy 75–77% vs 32–69%, P < 0.025) (Kim et al 1993, Ozsarlak et al 2003).
The resolution of the primary tumour on MRI may be further improved by using intracavitary receiver coils. Endorectal coils give high-resolution images of the posterior cervix, but the anterior margin of the tumour and its relation to the bladder base is often difficult to define because of drop-off of signal. Endovaginal coils give very-high-resolution images of the cervix and adjacent parametrium (deSouza et al 1996). The distortion of the low-signal ring of inner stroma may be apparent, and any breaks in the ring representing tumour extension may be identified (Figure 5.18A,B).
With MRI, the invasion of cervical cancer may be assessed in three planes: the coronal and axial planes are used for determining parametrial invasion, the axial plane is used for determining extension into the bladder and rectum, and the sagittal plane is used for extension into the uterine body, bladder and rectum (Sala et al 2007). Fast spin-echo T2-weighted sequences provide the best image contrast (Figure 5.19). MRI is also accurate in the prediction of myometrial tumour involvement and in showing the relationship of the tumour to the internal os, and hence the patient’s suitability for trachelectomy (Peppercorn et al 1999). Volume (three-dimensional) imaging also provides the information necessary to calculate tumour volumes, which is of prognostic significance. Volumes obtained with MRI correlate well with those obtained by histomorphometric methods, but only weakly with clinical stage (Burghardt et al 1989). The volumetry of the tumour also gives a more accurate prediction of parametrial invasion and lymph node involvement (Burghardt et al 1992). Measuring tumour volume on MRI is of paramount importance; it has been shown that it is the size of tumour burden that determines the outcome rather than invasion beyond the anatomical margins of the uterus (Soutter et al 2004). Dynamic contrast-enhanced studies have been used for assessment of tumour angiogenesis (Hawighorst et al 1999), and the rate of contrast uptake has been shown to correlate with microvessel density in the tumour. However, no correlation with tumour aggressiveness has been demonstrated (Postema et al 1999) and these images are not used routinely. Recently, diffusion-weighted MRI has shown higher accuracy than T2-weighted imaging alone for tumour detection (Charles-Edwards et al 2008).
Parametrium
CT and MRI have both been used to assess parametrial spread. False-positive diagnoses may arise from misinterpreting inflammatory parametrial soft tissue strands associated with a tumour as actual tumour invasion on both CT and MRI. A comparison of the assessment by these modalities with histological findings after radical hysterectomy showed an accuracy rate for parametrial involvement of 87–90% for MRI, 55–80% for CT and 82.5% for examination under anaesthesia (Kim et al 1993). Extracervical extension on MRI is best defined using T2-weighted fast spin-echo sequences transverse to the cervix (deSouza et al 1998). Fat-suppression techniques do not provide additional benefits (Lam et al 2000). Contrast enhancement has not proved beneficial; in a series of 73 patients, fast spin-echo T2-weighted images had an accuracy of 83% for determining parametrial extension (compared with 65% for T1-weighted gadolinium-enhanced images and 72% for T1-weighted gadolinium-enhanced fat-suppressed images). The high negative predictive value (95%) for the exclusion of parametrial tumour invasion was the principal contributor to the staging accuracy obtained with fast spin-echo T2-weighted imaging (Sironi et al 2002). MRI therefore yields valuable information for treatment planning and should be used routinely in conjunction with clinical staging to determine the appropriate therapy in patients with cervical carcinoma.
Nodal involvement
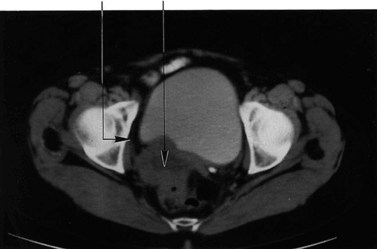
Some studies have shown an improvement in pelvic lymph node evaluation with MRI compared with CT (accuracy 88% vs 83%, P < 0.01) (Kim et al 1993). However, like CT, this relies on changes in the size of the lymph nodes (Figure 5.20) since the tumour deposits themselves are not highlighted.
A lymph-node-specific MR contrast agent has been developed that allows the identification of malignant nodal infiltration independent of the lymph node size. This novel MR contrast agent is classified as a nanoparticle (mean diameter 30 nm), and is composed of an iron oxide core, coated with low-molecular-weight dextran (ultrasmall particles of iron oxide, USPIO). The particles, administered intravenously, are taken up by macrophages in the reticuloendothelial system, predominantly within the lymph nodes. Uptake of USPIO results in marked loss of signal intensity (darkening) of the node on T2– and T2*-weighted sequences because of a susceptibility artifact caused by the iron. Metastatic tissue within a node displaces the normal macrophages, thus preventing uptake of contrast agent, and the node continues to remain high in signal intensity. A significant increase in sensitivity with no loss of specificity has been demonstrated for the detection of malignant lymph nodes with USPIOs in patients with cervical and endometrial cancer (Rockall et al 2005). On a node-by-node basis, the sensitivity increased from 29% using standard size criteria to 93% using USPIO criteria. On a patient-by-patient basis, sensitivity increased from 27% using standard size criteria to 100% using USPIO criteria.
The role of positron emission tomography (PET) for detecting metastatic pelvic lymph nodes remains unproven. Small single-centre studies claim 91–96% sensitivity and 96–100% specificity for detecting nodes involved with tumour (Reinhardt et al 2001, Loft et al 2007), while results from other studies are much poorer (Williams et al 2001). Urinary residues of 18FDG in the ureters remain a source of false-positive results. Quantitation suggests that a SUVmax ≥3.3 for lymph nodes is a significant adverse factor in those patients with nodal enlargement (Yen et al 2008).
Assessing response and recurrence
In conjunction with clinical examination, MRI can provide an objective assessment of the effects of surgery or radiotherapy. Serial MRI may be used before and after primary radiation therapy to assess tumour response (Akin et al 2007), and is increasingly important with the increased use of cytotoxic regimes. CT and ultrasound have limited ability to differentiate between fibrosis and tumour. While some say that infiltration of the parametrium may be easily recognizable, it is difficult to differentiate fibrosis after treatment from tumour recurrence. The use of contrast agents in detecting recurrent disease has proved disappointing; overall, diagnosis is best with unenhanced T2-weighted images, but particularly in patients with treatment complications (e.g. fistula formation), contrast enhancement does help (Hricak et al 1993).
PET-CT is increasingly used in identifying pelvic recurrence with sensitivity, specificity and accuracy of 92.0%, 92.6% and 92.3%, respectively (Kitajima et al 2008). PET-CT is also able to detect lung metastasis, local recurrence, peritoneal dissemination, para-aortic lymph node metastasis and pelvic lymph node metastasis, and is a useful complementary tool for obtaining good anatomical and functional localization of sites of recurrence during follow-up of patients with cervical cancer.
Endometrial carcinoma
Primary tumour
Thickening of the endometrium is characteristic of endometrial carcinoma and is well demonstrated on transvaginal ultrasound (Figure 5.21). However, specificity is low, although Doppler may help to distinguish hormonal causes of thickening (weak signals) and malignancy which gives marked colour and spectral Doppler signals (Weber et al 1998). Three-dimensional power Doppler has been reported to improve detection of endometrial carcinoma in patients with postmenopausal bleeding (Alcazar and Galvan 2009).
In patients already proven to have an endometrial cancer, myometrial extension has important prognostic and therapeutic implications. Myometrial invasion may be classified as absent, superficial or deep, and this can be assessed with high-resolution ultrasound probes. In a study of 75 patients, ultrasound had a diagnostic accuracy of 73% (Berretta et al 2008). Errors occurred when the tumour was exophytic and had significant extension into the uterine cavity. False-positive results also occur if the uterine cavity is distended with pus or blood when a subendometrial hypoechoic halo may be seen. Ultrasound assessment of the integrity of the echo-poor layer can be improved by the use of transvaginal or transrectal sonography. However, ultrasound has been superseded by MRI.
Changes in uterine blood flow have been used to detect endometrial cancer using endometrial thickness (including tumour), and the pulsatility index (PI) derived from flow velocity waveforms recorded from both uterine arteries and from within the tumour (Bourne et al 1991) found an overlap in endometrial thickness between women with endometrial cancer and those without, but the PI was invariably lower in women with postmenopausal bleeding caused by endometrial cancer than in those with other reasons for bleeding. Blood flow impedance is inversely related to the stage of the cancer. However, although PI values in healthy women increase slightly with age, they decrease with oestrogen replacement therapy, so although Doppler studies may be helpful in the detection of endometrial cancer, allowance must be made for oestrogen replacement therapy.
CT has been used to stage endometrial cancer which is seen as a hypodense lesion in the uterine parenchyma (Hardesty et al 2001), or as a fluid-filled uterus due to tumour obstruction of the endocervical canal or vagina. These findings, however, are non-specific and are easily confused with leiomyomata, intrauterine fluid collections and extension of a cervical carcinoma into the uterine body. In addition, a central lucency may occur in normal postmenopausal women.
MRI represents the best method of assessing a patient with an endometrial cancer, with advantages over other radiological techniques. Figure 5.22 is a series of MRI scans of patients with endometrial cancer. On the T2-weighted pulse sequence, the tumour has a signal intensity similar to that of normal endometrium, but showing some degree of variability. The high signal makes the tumour quite distinct from the surrounding myometrium, which possesses an intermediate-signal intensity. In a premenopausal uterus, however, it may be difficult to differentiate tumour from adenomatous hyperplasia or indeed from the high signal of normal endometrium. Contrast-enhanced T1-weighted MRI improves the ability to assess the depth of myometrial invasion by endometrial tumour (Koyama et al 2007, Sala et al 2009). MRI has been found to have a sensitivity of 57% and a specificity of 96% for tumour confined to the endometrium, a sensitivity and specificity of 74% for superficial invasion, and a sensitivity and specificity between 83–88% and 72–85%, respectively, for deep penetration (Sironi et al 1992, Cabrita et al 2008). However, the degree of invasiveness may be overestimated for exophytic polypoid tumours with significant extraluminal extension (Chung et al 2007, Sanjuan et al 2008). Powell et al (1986) first described the low-signal band of inner myometrium to be thinned or absent in those patients with deeply invasive tumours, and this correlated well with the pathological measurement of myometrial invasion.
The sagittal plane is the most appropriate for examination of a patient with primary endometrial cancer, as this provides a longitudinal view of the uterus which will include both corpus and cervix. Using the sagittal plane also provides the opportunity to assess anterior invasion of the tumour into the bladder and posteriorly to the rectum. Critical review and expert consensus of MRI protocols by the European Society of Urogenital Radiology, from 10 European institutions, and published literature between 1999 and 2008 indicated that high-field MRI should include at least two T2-weighted sequences in sagittal, axial oblique or coronal oblique orientation. High-resolution post-contrast images acquired at 2 min ± 30 s after intravenous contrast injection are optimal for the diagnosis of myometrial invasion. If cervical invasion is suspected, additional slice orientation perpendicular to the axis of the endocervical channel is recommended. Due to the limited sensitivity of MRI to detect lymph node metastasis without lymph-node-specific contrast agents, retroperitoneal lymph node screening with precontrast sequences up to the level of the kidneys is optional. The likelihood of lymph node invasion and the need for staging lymphadenectomy are indicated by high-grade histology at endometrial tissue sampling and by deep myometrial or cervical invasion detected by MRI (Kinkel et al 2009).
FDG-PET has been shown to display a higher sensitivity (96.7%) than CT/MRI (83.3%) for identifying primary and extrauterine (83.3% vs 66.7%) lesions, although no difference in specificity emerged between the two modalities (both 100%) (Suzuki et al 2007). For lymph node evaluation, MRI and FDG-PET are equivalent — sensitivity (91.5% vs 89.4%), specificity (33.3% vs 50.5%), accuracy (84.9% vs 84.9%), positive predictive value (91.5% vs 93.3%) or negative predictive value (33.3% vs 37.5%) (Park et al 2008) — which does not justify the use of PET-CT in disease staging.
Recurrent disease
Transrectal sonography has been investigated in cases where recurrent endometrial cancer is suspected (Savelli et al 2004). Physical examination may be difficult because of postsurgical fibrosis. Infiltration into the surrounding connective tissues and organs such as the rectum and bladder can be identified, and transrectal ultrasound can be used to guide transvaginal or transperineal fine-needle biopsy. As with recurrent cervical cancer, CT, MRI or PET-CT may be used to detect recurrent disease and metastatic carcinoma to omentum or lymph nodes.
Choriocarcinoma
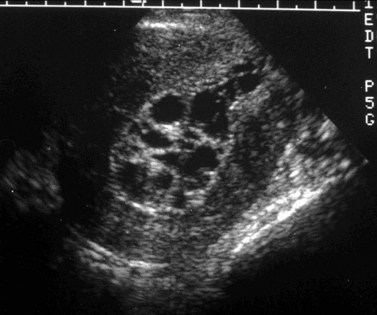
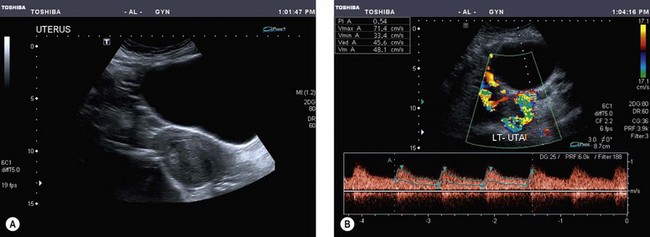
Choriocarcinomas (gestational trophoblastic tumours) are characteristically hypervascular and this can be detected with colour Doppler (Figure 5.23) (Sebire and Seckl 2008). On spectral Doppler, they have a very low resistance index and this is useful for monitoring response to chemotherapy, although ultrasound is not very sensitive in their initial diagnosis since the characteristic snow-storm appearance of the multiple cystic spaces is only present in 40% of cases.
Ovarian carcinoma
The ovary
Ultrasound has been explored as a screening method for carcinoma of the ovary in an attempt to detect early disease (Menon and Jacobs 2000, Sato et al 2000). Early studies demonstrated a poor yield: out of 5479 women screened, five women with primary stage I cancer and four women with metastatic disease of the ovary were diagnosed (Campbell et al 1989). The overall rate of false-positive results was 2.3% and the likelihood of a positive scan being a primary ovarian cancer was one in 67. A scoring system has been evolved which reduces the number of false-positive results which otherwise occur due to confusion with unusual-appearing corpora lutea and benign tumours (Timmerman et al 1999). The improved resolution of transvaginal scanning permits a more detailed morphological examination (Figure 5.24A,B). This has been tested in a study of 25,000 asymptomatic postmenopausal women, of whom 740 had raised CA125 levels and were referred for ultrasonography; an ovarian volume of 8.8 ml was used as a cut-off for normality. All 20 cancers had abnormal morphology consisting of complex cysts, although there were numerous false-positive results. The positive predictive value was approximately 20% (Menon et al 2000).
Benign lesions are unilocular or multilocular with thin septae and no nodules, whereas malignant lesions are often multilocular with thick septae and nodules. The use of transvaginal colour flow imaging has been advocated, but these studies have been variously reported as disappointing or useful (Varras 2004). Initially, a low resistance index (less than 0.4) was advocated as the best discriminator, but this has proved unreliable and a high peak velocity may be a better feature. At present, the role of ultrasound in screening, although attractive, remains unvalidated (Partridge et al 2009) and the results of larger trials are awaited. Additional specificity might be gained by adding contrast agents.
In ovarian cancer staging, MRI and CT are more sensitive than ultrasound (95%, 92% and 69%, respectively) for detecting peritoneal metastases, especially in the subdiaphragmatic spaces and hepatic surfaces (Tempany et al 2000). Either modality therefore can be used to stage advanced ovarian cancer. The potential of PET to identify metabolically active tumour that does not appear on morphological studies is promising. In one study, the PET-CT scan indicated a different disease distribution compared with CT alone in 55% of patients, and changed therapeutic management in 34% (Soussan et al 2008). Therefore, although current evidence for its utility is limited, PET-CT may be of major importance in staging ovarian cancer in the future.
As a tumour arising from a non-essential organ that is initially confined to the peritoneal cavity, ovarian cancer makes an attractive target for monoclonal antibodies. An antibody to CA125 has been assessed in monitoring the course of the disease (Sok et al 2009). However, antibodies are often limited by problems that include antibody specificity, stability and immunoreactivity, as well as patient reaction to the antibodies used. Antibodies coupled to drugs or biological toxins are also under investigation. Some antibodies may have direct antitumour effects through binding to biologically active receptors or through immune receptor functions. The use of antibody fragments, chimeric antibodies and genetically engineered antibodies is also under active investigation (Badgwell and Bast 2007).
Pelvic and abdominal spread
CT is the most useful imaging modality for demonstrating macroscopic recurrence, and can spare patients a second-look laparotomy. A variety of manifestations can be seen with CT, each of which can have a spectrum of appearances including ascites, peritoneal seeding, and visceral and nodal metastases (Forstner 2007). Ultrasound may also be used to detect ascites and liver metastases. MRI should be performed in women with questionable macroscopic recurrent tumour and negative CT examination (Figure 5.25), although neither modality can exclude microscopic disease. Newer whole-body diffusion-weighted MRI measurements are looking extremely promising in identifying peritoneal spread (Kyriazi et al 2009). PET-CT may also prove to be of benefit, although quoted accuracy reflects local expertise at image interpretation: lesion-based sensitivity and accuracy of FDG-PET/CT vs MRI has been recorded as 43% and 86%, and 75% and 94%, respectively (P < 0.05) (Kim et al 2007), indicating that FDG-PET/CT is not as useful as MRI for detecting local pelvic recurrence and peritoneal lesions in ovarian cancer recurrence. In contrast, in a recent meta-analysis of 34 studies comparing CA125, PET alone, PET-CT, CT and MRI, PET-CT had the highest pooled sensitivity (0.91, 95% confidence interval 0.88–0.94). The area under the curve (AUC) was 0.9219, 0.9297, 0.9555, 0.8845 and 0.7955, respectively. Results of pairwise comparison between each modality demonstrated that AUC of PET, whether interpreted with or without the use of CT, was higher than that of CT or MRI (P < 0.05) (Gu et al 2009).
Immunoscintigraphy of ovarian cancer lesions has been performed mainly with 99mTc, 111In and 123I labelled with HMFG1, HMFG2, OC-125, B72.3, H17E2, OVTL3, MoAb170, Mov18 and other monoclonal antibodies (MoAbs). Improved targeting has resulted in a highly sensitive and specific method. However, it is not yet known which type of MoAb most usefully supplements conventional diagnostic methods in staging or measurement of treatment response (Kalofonos et al 2001).
Safety Issues
As early as 1896, reports were made of a visual sensation of light flashes induced by exposure to changing magnetic fields. However, the main hazards associated with rapidly changing magnetic fields are those from magnetic implants. Patients with cardiac pacemakers or aneurysm clips constitute an absolute exclusion to being scanned. Other metallic implants must be considered on an individual basis. Other hazards arise from electroconvulsion and atrial fibrillation, hence caution should be exercised with epileptic patients and those who have recently suffered from myocardial infarction. Guidelines for the use of MRI have been laid down by the National British Radiological Protection Board (1984).
Conclusions
KEY POINTS
Akin O, Mironov S, Pandit-Taskar N, Hann LE. Imaging of uterine cancer. Radiologic Clinics of North America. 2007;45:167-182.
Alcazar JL, Galvan R. Three-dimensional power Doppler ultrasound scanning for the prediction of endometrial cancer in women with postmenopausal bleeding and thickened endometrium. American Journal of Obstetrics and Gynecology. 2009;200:44-46.
Ascher SM, Arnold LL, Patt RH, et al. Adenomyosis: prospective comparison of MR imaging and transvaginal sonography. Radiology. 1994;190:803-806.
Badgwell D, Bast RCJr. Early detection of ovarian cancer. Disease Markers. 2007;23:397-410.
Baerwald AR, Adams GP, Pierson RA. Form and function of the corpus luteum during the human menstrual cycle. Ultrasound in Obstetrics and Gynecology. 2005;25:498-507.
Bennett CC, Richards DS. Patient acceptance of endovaginal ultrasound. Ultrasound in Obstetrics and Gynecology. 2000;15:52-55.
Berretta R, Merisio C, Piantelli G, et al. Preoperative transvaginal ultrasonography and intraoperative gross examination for assessing myometrial invasion by endometrial cancer. Journal of Ultrasound in Medicine. 2008;27:349-355.
Bourne TH, Campbell S, Steer CV, Royston P, Whitehead MI, Collins WP. Detection of endometrial cancer by transvaginal ultrasonography with color flow imaging and blood flow analysis: a preliminary report. Gynecologic Oncology. 1991;40:253-259.
Brinkman JF, Wladimiroff J. A software tool for fetal blood flow analysis. Biomedical Instrumentation and Technology. 2000;34:55-60.
Brosens I, Puttemans P, Campo R, Gordts S, Kinkel K. Diagnosis of endometriosis: pelvic endoscopy and imaging techniques. Best Practice and Research Clinical Obstetrics and Gynaecology. 2004;18:285-303.
Burghardt E, Hofmann HM, Ebner F, Haas J, Tamussino K, Justich E. Magnetic resonance imaging in cervical cancer: a basis for objective classification. Gynecologic Oncology. 1989;33:61-67.
Burghardt E, Baltzer J, Tulusan AH, Haas J. Results of surgical treatment of 1028 cervical cancers studied with volumetry. Cancer. 1992;70:648-655.
Byun JY, Kim SE, Choi BG, Ko GY, Jung SE, Choi KH. Diffuse and focal adenomyosis: MR imaging findings. Radiographics. 1999;19:S161-S170.
Cabrita S, Rodrigues H, Abreu R, et al. Magnetic resonance imaging in the preoperative staging of endometrial carcinoma. European Journal of Gynaecological Oncology. 2008;29:135-137.
Campbell S, Bhan V, Royston P, Whitehead MI, Collins WP. Transabdominal ultrasound screening for early ovarian cancer. BMJ (Clinical Research Ed.). 1989;299:1363-1367.
Charles-Edwards EM, Messiou C, Morgan VA, et al. Diffusion-weighted imaging in cervical cancer with an endovaginal technique: potential value for improving tumor detection in stage Ia and Ib1 disease. Radiology. 2008;249:541-550.
Choi YL, Kim HS, Ahn G. Immunoexpression of inhibin alpha subunit, inhibin/activin betaA subunit and CD99 in ovarian tumors. Archives of Pathology and Laboratory Medicine. 2000;124:563-569.
Chung HH, Kang SB, Cho JY, et al. Accuracy of MR imaging for the prediction of myometrial invasion of endometrial carcinoma. Gynecologic Oncology. 2007;104:654-659.
Collins CD, Jackson JE. Pelvic arterial embolization following hysterectomy and bilateral internal iliac artery ligation for intractable primary post partum haemorrhage. Clinical Radiology. 1995;50:710-713.
Del Frate C, Girometti R, Pittino M, Del Frate G, Bazzocchi M, Zuiani C. Deep retroperitoneal pelvic endometriosis: MR imaging appearance with laparoscopic correlation. Radiographics. 2006;26:1705-1718.
deSouza NM, Brosens JJ, Schwieso JE, Paraschos T, Winston RM. The potential value of magnetic resonance imaging in infertility. Clinical Radiology. 1995;50:75-79.
deSouza NM, Scoones D, Krausz T, Gilderdale DJ, Soutter WP. High-resolution MR imaging of stage I cervical neoplasia with a dedicated transvaginal coil: MR features and correlation of imaging and pathologic findings. AJR American Journal of Roentgenology. 1996;166:553-559.
deSouza NM, McIndoe GA, Soutter WP, et al. Value of magnetic resonance imaging with an endovaginal receiver coil in the pre-operative assessment of stage I and IIa cervical neoplasia. BJOG: an International Journal of Obstetrics and Gynaecology. 1998;105:500-507.
Dueholm M, Lundorf E. Transvaginal ultrasound or MRI for diagnosis of adenomyosis. Current Opinion in Obstetrics and Gynecology. 2007;19:505-512.
Dumontier I, Roseau G, Vincent B, et al. [Comparison of endoscopic ultrasound and magnetic resonance imaging in severe pelvic endometriosis]. Gastroenterologie Clinique et Biologique. 2000;24:1197-1204.
Fleischer AC, Lyshchik A, Jones HWJr, et al. Contrast-enhanced transvaginal sonography of benign versus malignant ovarian masses: preliminary findings. Journal of Ultrasound in Medicine. 2008;27:1011-1018.
Forstner R. Radiological staging of ovarian cancer: imaging findings and contribution of CT and MRI. European Radiology. 2007;17:3223-3235.
Fotopoulou C, Sehouli J, Schefold JC, et al. Preoperative transvaginal ultrasound (TVS) in the description of pelvic tumor spread in endometrial cancer: results of a prospective study. Anticancer Research. 2008;28:2453-2458.
Ganeshan A, Upponi S, Hon LQ, Uthappa MC, Warakaulle DR, Uberoi R. Chronic pelvic pain due to pelvic congestion syndrome: the role of diagnostic and interventional radiology. Cardiovascular and Interventional Radiology. 2007;30:1105-1111.
Gu P, Pan LL, Wu SQ, Sun L, Huang G. CA 125, PET alone, PET-CT, CT and MRI in diagnosing recurrent ovarian carcinoma. A systematic review and meta-analysis. European Journal of Radiology. 2009;71:164-174.
Haag T, Manhes H. [Chronic varicose pelvic veins]. Journal des Maladies Vasculaires. 1999;24:267-274.
Hardesty LA, Sumkin JH, Hakim C, Johns C, Nath M. The ability of helical CT to preoperatively stage endometrial carcinoma. AJR American Journal of Roentgenology. 2001;176:603-606.
Hauth EA, Jaeger HJ, Libera H, Lange S, Forsting M. MR imaging of the uterus and cervix in healthy women: determination of normal values. European Radiology. 2007;17:734-742.
Hawighorst H, Knapstein PG, Knopp MV, Vaupel P, van Kaick G. Cervical carcinoma: standard and pharmacokinetic analysis of time-intensity curves for assessment of tumor angiogenesis and patient survival. Magma (New York, NY). 1999;8:55-62.
Hricak H, Alpers C, Crooks LE, Sheldon PE. Magnetic resonance imaging of the female pelvis: initial experience. AJR American Journal of Roentgenology. 1983;141:1119-1128.
Hricak H, Finck S, Honda G, Goranson H. MR imaging in the evaluation of benign uterine masses: value of gadopentetate dimeglumine-enhanced T1-weighted images. AJR American Journal of Roentgenology. 1992;158:1043-1050.
Hricak H, Swift PS, Campos Z, Quivey JM, Gildengorin V, Goranson H. Irradiation of the cervix uteri: value of unenhanced and contrast-enhanced MR imaging. Radiology. 1993;189:381-388.
Kalofonos HP, Karamouzis MV, Epenetos AA. Radioimmunoscintigraphy in patients with ovarian cancer. Acta Oncology. 2001;40:549-557.
Kim CK, Park BK, Choi JY, Kim BG, Han H. Detection of recurrent ovarian cancer at MRI: comparison with integrated PET/CT. Journal of Computer Assisted Tomography. 2007;31:868-875.
Kim SH, Choi BI, Han JK, et al. Preoperative staging of uterine cervical carcinoma: comparison of CT and MRI in 99 patients. Journal of Computer Assisted Tomography. 1993;17:633-640.
Kinkel K, Chapron C, Balleyguier C, Fritel X, Dubuisson JB, Moreau JF. Magnetic resonance imaging characteristics of deep endometriosis. Human Reproduction. 1999;14:1080-1086.
Kinkel K, Forstner R, Danza FM, et al. Staging of endometrial cancer with MRI: Guidelines of the European Society of Urogenital Imaging. European Radiology. 2009;19:1565-1574.
Kitajima K, Murakami K, Yamasaki E, Domeki Y, Kaji Y, Sugimura K. Performance of FDG-PET/CT for diagnosis of recurrent uterine cervical cancer. European Radiology. 2008;18:2040-2047.
Koyama T, Tamai K, Togashi K. Staging of carcinoma of the uterine cervix and endometrium. European Radiology. 2007;17:2009-2019.
Kunz G, Beil D, Huppert P, Leyendecker G. Structural abnormalities of the uterine wall in women with endometriosis and infertility visualized by vaginal sonography and magnetic resonance imaging. Human Reproduction. 2000;15:76-82.
Kurjak A. Ultrasound scanning — Prof. Ian Donald (1910–1987). European Journal of Obstetrics, Gynecology and Reproductive Biology. 2000;90:187-189.
Kyriazi S, Morgan VA, Collins DJ, deSouza NM 2009 Optimising diffusion-weighted imaging in the abdomen and pelvis: comparison of image quality between monopolar and bipolar single-shot spin-echo echo-planar sequences. European Journal of Radiology; in press.
Lam WW, So NM, Yang WT, Metreweli C. Detection of parametrial invasion in cervical carcinoma: role of short tau inversion recovery sequence. Clinical Radiology. 2000;55:702-707.
Liddle AD, Davies AH. Pelvic congestion syndrome: chronic pelvic pain caused by ovarian and internal iliac varices. Phlebology. 2007;22:100-104.
Loft A, Berthelsen AK, Roed H, et al. The diagnostic value of PET/CT scanning in patients with cervical cancer: a prospective study. Gynecologic Oncology. 2007;106:29-34.
McCluggage WG. Recent advances in immunohistochemistry in the diagnosis of ovarian neoplasms. Journal of Clinical Pathology. 2000;53:327-334.
Menon U, Jacobs IJ. Recent developments in ovarian cancer screening. Current Opinion in Obstetrics and Gynecology. 2000;12:39-42.
Menon U, Talaat A, Rosenthal AN, et al. Performance of ultrasound as a second line test to serum CA125 in ovarian cancer screening. BJOG: an International Journal of Obstetrics and Gynaecology. 2000;107:165-169.
National British Radiological Protection Board. Revised guidelines on acceptable limits of exposure during nuclear magnetic clinical imaging. British Journal of Radiology. 1984;56:974-977.
Ozsarlak O, Tjalma W, Schepens E, et al. The correlation of preoperative CT, MR imaging, and clinical staging (FIGO) with histopathology findings in primary cervical carcinoma. European Radiology. 2003;13:2338-2345.
Palomba S, Russo T, Orio FJr, Falbo A, Tolino A, Zullo F. Perifollicular vascularity assessment for selecting the best oocytes for in vitro fertilization programs in older patients. Fertility and Sterility. 2008;90:1305-1309.
Park JY, Kim EN, Kim DY, et al. Comparison of the validity of magnetic resonance imaging and positron emission tomography/computed tomography in the preoperative evaluation of patients with uterine corpus cancer. Gynecologic Oncology. 2008;108:486-492.
Partridge E, Kreimer AR, Greenlee RT, et al. Results from four rounds of ovarian cancer screening in a randomized trial. Obstetrics and Gynecology. 2009;113:775-782.
Peppercorn PD, Jeyarajah AR, Woolas R, et al. Role of MR imaging in the selection of patients with early cervical carcinoma for fertility-preserving surgery: initial experience. Radiology. 1999;212:395-399.
Popowski Y, Hiltbrand E, Joliat D, Rouzaud M. Open magnetic resonance imaging using titanium-zirconium needles: improved accuracy for interstitial brachytherapy implants? International Journal of Radiation Oncology, Biology, Physics. 2000;47:759-765.
Postema S, Pattynama PM, van Rijswijk CS, Trimbos JB. Cervical carcinoma: can dynamic contrast enhanced imaging help predict tumour aggressiveness? Radiology. 1999;213:617-618.
Powell MC, Womack C, Buckley J, Worthington BS, Symonds EM. Pre-operative magnetic resonance imaging of stage 1 endometrial adenocarcinoma. BJOG: an International Journal of Obstetrics and Gynaecology. 1986;93:353-360.
Randall JM, Fisk NM, McTavish A, Templeton AA. Transvaginal ultrasonic assessment of endometrial growth in spontaneous and hyperstimulated menstrual cycles. BJOG: an International Journal of Obstetrics and Gynaecology. 1989;96:954-959.
Reinhardt MJ, Ehritt-Braun C, Vogelgesang D, et al. Metastatic lymph nodes in patients with cervical cancer: detection with MR imaging and FDG PET. Radiology. 2001;218:776-782.
Reinhold C, Tafazoli F, Mehio A, et al. Uterine adenomyosis: endovaginal US and MR imaging features with histopathologic correlation. Radiographics. 1999;19:S147-S160.
Rockall AG, Sohaib SA, Harisinghani MG, et al. Diagnostic performance of nanoparticle-enhanced magnetic resonance imaging in the diagnosis of lymph node metastases in patients with endometrial and cervical cancer. Journal of Clinical Oncology. 2005;23:2813-2821.
Sala E, Wakely S, Senior E, Lomas D. MRI of malignant neoplasms of the uterine corpus and cervix. AJR American Journal of Roentgenology. 2007;188:1577-1587.
Sala E, Crawford R, Senior E, et al. Added value of dynamic contrast-enhanced magnetic resonance imaging in predicting advanced stage disease in patients with endometrial carcinoma. International Journal of Gynecological Cancer. 2009;19:141-146.
Sanjuan A, Escaramis G, Ayuso JR, et al. Role of magnetic resonance imaging and cause of pitfalls in detecting myometrial invasion and cervical involvement in endometrial cancer. Archives of Gynecology and Obstetrics. 2008;278:535-539.
Sato S, Yokoyama Y, Sakamoto T, Futagami M, Saito Y. Usefulness of mass screening for ovarian carcinoma using transvaginal ultrasonography. Cancer. 2000;89:582-588.
Savelli L, Testa AC, Ferrandina G, et al. Pelvic relapses of uterine neoplasms: transvaginal sonographic and Doppler features. Gynecologic Oncology. 2004;93:441-445.
Sebire NJ, Seckl MJ. Gestational trophoblastic disease: current management of hydatidiform mole. BMJ (Clinical Research Ed.). 2008;337:a1193.
Sironi S, Colombo E, Villa G, et al. Myometrial invasion by endometrial carcinoma: assessment with plain and gadolinium-enhanced MR imaging. Radiology. 1992;185:207-212.
Sironi S, Bellomi M, Villa G, Rossi S, Del Maschio A. Clinical stage I carcinoma of the uterine cervix value of preoperative magnetic resonance imaging in assessing parametrial invasion. Tumori. 2002;88:291-295.
Sok D, Clarizia LJ, Farris LR, McDonald MJ. Novel fluoroimmunoassay for ovarian cancer biomarker CA-125. Analytical and Bioanalytical Chemistry. 2009;393:1521-1523.
Soussan M, Wartski M, Cherel P, et al. Impact of FDG PET-CT imaging on the decision making in the biologic suspicion of ovarian carcinoma recurrence. Gynecologic Oncology. 2008;108:160-165.
Soutter WP, Hanoch J, D’Arcy T, Dina R, McIndoe GA, deSouza NM. Pretreatment tumour volume measurement on high-resolution magnetic resonance imaging as a predictor of survival in cervical cancer. BJOG: an International Journal of Obstetrics and Gynecology. 2004;111:741-747.
Subak LL, Hricak H, Powell CB, Azizi L, Stern JL. Cervical carcinoma: computed tomography and magnetic resonance imaging for preoperative staging. Obstetrics and Gynecology. 1995;86:43-50.
Suzuki R, Miyagi E, Takahashi N, et al. Validity of positron emission tomography using fluoro-2-deoxyglucose for the preoperative evaluation of endometrial cancer. International Journal of Gynecological Cancer. 2007;17:890-896.
Tempany CM, Zou KH, Silverman SG, Brown DL, Kurtz AB, McNeil BJ. Staging of advanced ovarian cancer: comparison of imaging modalities — report from the Radiological Diagnostic Oncology Group. Radiology. 2000;215:761-767.
Timmerman D, Bourne TH, Tailor A, et al. A comparison of methods for preoperative discrimination between malignant and benign adnexal masses: the development of a new logistic regression model. American Journal of Obstetrics and Gynecology. 1999;181:57-65.
van den Brule FA, Wery O, Huveneers J, Gaspard UJ. [Contrast hysterosonography: an efficient means of investigation in gynecology. Review of the literature]. Journal de Gynecologie, Obstetrique et Biologie de la Reproduction (Paris). 1998;27:655-664.
Van Voorhis BJ. Ultrasound assessment of the uterus and fallopian tube in infertile women. Seminars in Reproductive Medicine. 2008;26:232-240.
Varras M. Benefits and limitations of ultrasonographic evaluation of uterine adnexal lesions in early detection of ovarian cancer. Clinical and Experimental Obstetrics and Gynecology. 2004;31:85-98.
Wade RV. Images, imagination and ideas: a perspective on the impact of ultrasonography on the practice of obstetrics and gynecology. Presidential address. American Journal of Obstetrics and Gynecology. 1999;181:235-239.
Weber G, Merz E, Bahlmann F, Rosch B. Evaluation of different transvaginal sonographic diagnostic parameters in women with postmenopausal bleeding. Ultrasound in Obstetrics and Gynecology. 1998;12:265-270.
Whitten CR, deSouza NM. Magnetic resonance imaging of uterine malignancies. Topics in Magnetic Resonance Imaging. 2006;17:365-377.
Williams AD, Cousins C, Soutter WP, et al. Detection of pelvic lymph node metastases in gynecologic malignancy: a comparison of CT, MR imaging, and positron emission tomography. AJR American Journal of Roentgenology. 2001;177:343-348.
Yen TC, See LC, Lai CH, et al. Standardized uptake value in para-aortic lymph nodes is a significant prognostic factor in patients with primary advanced squamous cervical cancer. European Journal of Nuclear Medicine and Molecular Imaging. 2008;35:493-501.


