[level-membership-for-pediatrics-category]Chapter 112
Imaging Techniques
Radiographic Procedures
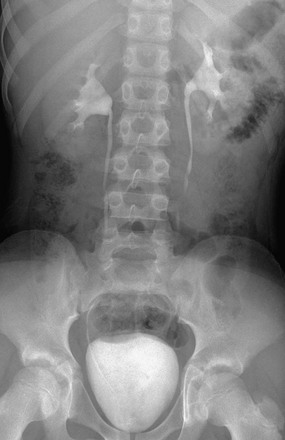
Imaging begins with a frontal radiograph of the abdomen to identify any calcifications or masses. After this preliminary radiograph is obtained, low osmolar contrast media with a high iodine content is administered intravenously at a dose of 2 mL/kg (maximum, 150 mL) to obtain adequate iodine concentration in the renal tubules and collecting system. The filming sequence is tailored to the individual examination. An initial frontal radiograph within 1 to 2 minutes of injection images the nephrographic phase. Assessment of this radiograph determines subsequent filming. Upon routine examination, a radiograph at approximately 5 to 10 minutes allows visualization of the kidneys and their collecting systems, including the bladder (e-Fig. 112-1). In the prone position, the higher specific gravity of the contrast material allows better visualization of the anteriorly positioned renal pelves and proximal ureters.
Voiding Cystourethrography
Antegrade voiding cystourethrography (VCUG) is the traditional examination of choice for detailed anatomic evaluation of the bladder, study of the anatomy of the male urethra, and identification of vesicoureteral reflux (VUR). The bladder is filled by gravity pressure, using dilute sterile contrast media with an iodine concentration of 80 to 100 mg/mL. The predicted bladder capacity (in milliliters) for children younger than 1 year is the child’s weight in kilograms multiplied by 7. In children older than 1 year, the predicted capacity is the child’s age in years plus 2, multiplied by 30.1,2
An early bladder filling image is obtained to evaluate for ureteroceles or masses. Images with a full urinary bladder are obtained in the lateral oblique projections to look for VUR. Voiding films are useful to evaluate the bladder and urethra (particularly the male urethra) and for the diagnosis of VUR, which may occur only during voiding. After voiding, an image of the bladder documents any postvoid residual, and an image of the kidneys documents any reflux that occurred during the examination. Neonates should undergo at least two filling and voiding cycles to increase the chance of detecting VUR.3–6 Pulsed fluoroscopy, last image hold recording, and videotaping are important imaging strategies for reducing radiation exposure.7–10
Ultrasound
Contrast-Enhanced Voiding Ultrasonography
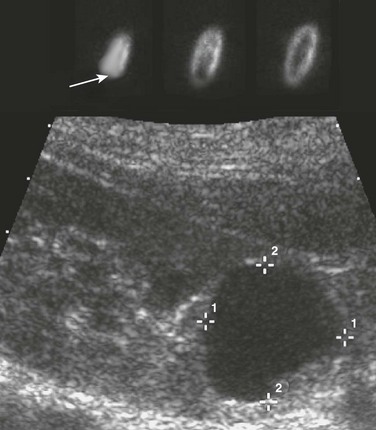
The intravesical instillation of ultrasound contrast agents in the urinary bladder allows the sonographic evaluation of VUR without the use of ionizing radiation.11–14 These microbubble contrast agents are composed of an outer shell of lipid, protein, or polymer that encases a gas, most commonly a perfluorocarbon.15 The gas is highly reflective on ultrasound imaging (Fig. 112-2) and can be detected even when administered in very small volumes. The ultrasound transducer is positioned intermittently over the bladder, ureters, and kidneys while the bladder is filled. On grayscale imaging, the microbubbles appear echogenic. Refluxed contrast material is easily detected in the ureters and kidneys (Fig. 112-3). Although this technique does not avoid catheterization, it does eliminate radiation exposure. Results indicate that the sensitivity for VUR detection is comparable with that of standard techniques. A reflux grading system for contrast-enhanced voiding ultrasonography has been developed and is similar to the international grading system for VCUG.12 Urethral visualization is possible with contrast-enhanced voiding ultrasonography but remains challenging.
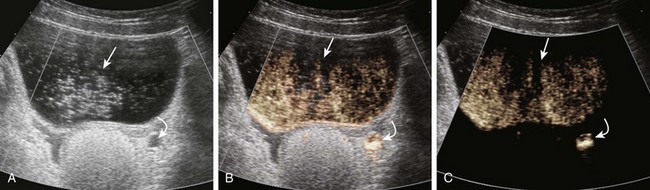
Figure 112-2 Contrast-enhanced cystosonography.
Transverse ultrasound images after instillation of an ultrasound contrast agent into the urinary bladder. A, On gray-scale imaging, the contrast agent appears as hyperechoic material in the bladder (straight arrow) surrounded by anechoic urine. Reflux into the distal left ureter (curved arrow) is present but somewhat difficult to appreciate. B, Color overlay technology shows the contrast agent to better advantage as bright orange material in the bladder (straight arrow) and distal ureter (curved arrow). C, Subtraction technology further accentuates the presence of contrast material by eliminating non–contrast-enhanced background tissue. Contrast material in the bladder (straight arrow) and ureter (curved arrow) are readily apparent. (Images courtesy Dr. Kassa Darge.)
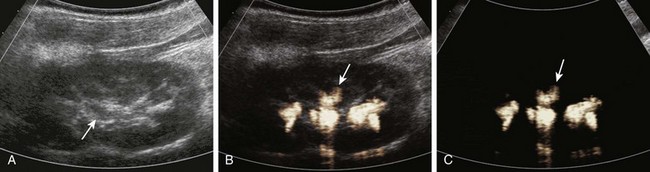
Figure 112-3 Contrast-enhanced cystosonography.
Longitudinal ultrasound images of the kidney, obtained during contrast-enhanced voiding ultrasonography, demonstrate reflux into the renal collecting system (arrows) on gray-scale (A), color-overlay (B), and subtraction (C) images. (Images courtesy Dr. Kassa Darge.)
Renal Ultrasonography
Ultrasonography is an ideal method for examining the kidneys and bladder in infants and children because of their small physical habitus and lack of abdominal fat and because ultrasonography does not utilize ionizing radiation. Variable transducer frequencies and transducer design (e.g., sector, phased, curvilinear, and linear array) allow for individualized approaches. Doppler ultrasound is valuable for the detection of blood flow, to confirm arterial perfusion, or to exclude venous thrombosis. Measurable blood flow parameters from spectral Doppler analysis include peak systolic velocity, end-diastolic velocity, and acceleration times. The normal renal artery has a prompt systolic upstroke with an acceleration time of 70 msec or less and a visible early systolic peak (e-Fig. 112-4). The normal resistive index depends on the patient’s age; it may be as high as 0.9 in a preterm infant and falls to around the adult value of 0.7 in the first few months of life.16–19
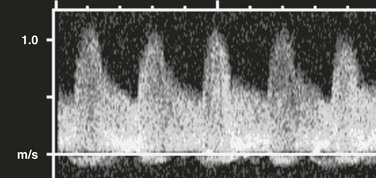
e-Figure 112-4 A normal renal Doppler waveform.
A prompt systolic upstroke and normal forward flow through diastole are present.
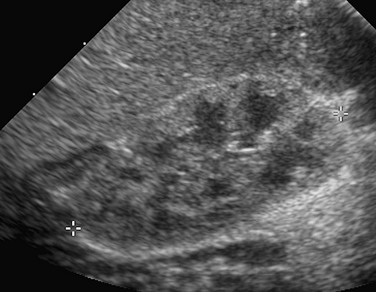
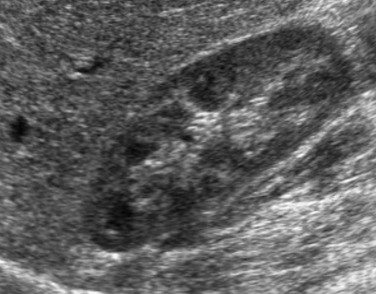
In young children, it is advisable to initiate the urogenital ultrasound examination with an examination of the bladder. The full bladder of an infant usually empties when the transducer is placed in the suprapubic region. Kidneys are imaged in the longitudinal and transverse planes. The kidneys are ovoid solid organs with fine, medium-level echoes arising from the cortex, a well-delineated corticomedullary junction with brightly echoic arcuate arteries, and pyramid-shaped, relatively large medullary rays that are hypoechoic. Cortical echogenicity in neonates and young infants is higher and the medullary pyramids are more hypoechoic than in older children (Fig. 112-5). The cortical echogenicity is increased compared with the liver and spleen in preterm infants, isoechoic in neonates and young infants, and diminishes progressively in older children. The transition from the infant renal echo pattern to that of the child typically occurs between 6 and 9 months (Fig. 112-6). Normal pediatric sonographic measurements of right and left kidney length, based on height and age, are provided in Table 112-1.20–25
Table 112-1
Normal Sonographic Renal Lengths in Children Based on Height and Age
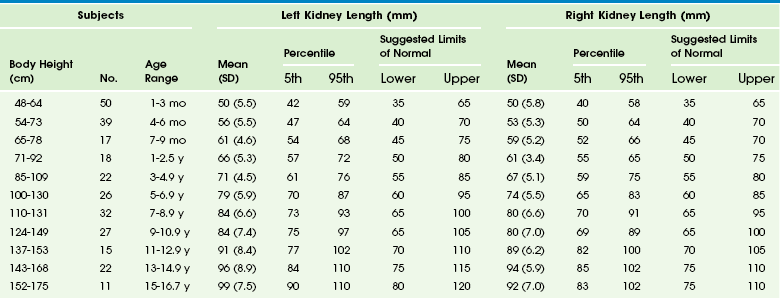
From Konus OL, Ozdemir A, Akkaya A, et al. Normal liver, spleen, and kidney dimensions in neonates, infants, and children: evaluation with sonography. AJR. 1998;171:1693-1698.
Nuclear Medicine
Nuclear cystography is performed for the assessment of VUR and is an alternative to fluoroscopic VCUG. The examination is performed by direct instillation of radiotracer (technetium-99m–sulfur colloid) and sterile saline solution into the bladder after sterile catheterization26 or indirectly after nuclear renography with planar images obtained during voiding.27 Dynamic imaging of the bladder and kidney regions is acquired with use of a posterior gamma camera throughout the filling and voiding cycle. The data can be grouped (in 10- or 60-second intervals) and viewed dynamically. VUR is documented when tracer is shown to ascend into a tubular structure corresponding to the ureter or when the renal collecting system is visualized. The dose of tracer is dependent on bladder volume: 300 mCi for bladder volumes up to 300 mL, and 600 mCi for larger bladder volumes. A cyclic cystogram is recommended for children younger than 2 years, for children with previously documented VUR or a high suspicion for VUR, and for children who void well before the expected bladder capacity is reached. The procedure is identical to the standard cystogram; however, the catheter is left in the bladder after the first voiding cycle and is used to refill the bladder for a repeat void. As with VCUG, cyclic studies increase the diagnostic yield (e-Fig. 112-7), identifying an additional 10% to 15% of children with VUR compared with noncyclic voiding studies.28
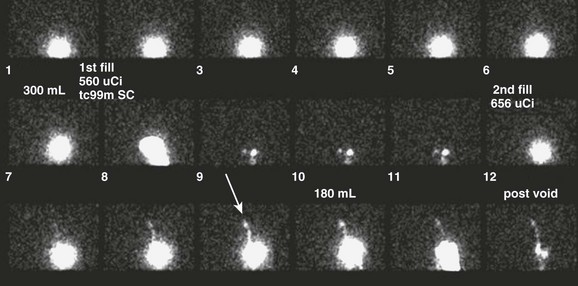
e-Figure 112-7 Vesicoureteral reflux.
A cyclic nuclear cystogram demonstrates a normal first cycle, with intermediate-grade reflux present on the second cycle only (arrow).
Nuclear cystography offers three main advantages over fluoroscopic VCUG: increased detection of VUR (up to an additional 20%) (Fig. 112-8), frequent detection of a higher grade of VUR,29,30 and reduced radiation dose (tenfold) (Table 112-2). Disadvantages of nuclear cystography include a lack of detailed anatomic visualization of the urethra and collecting systems and limited identification of bladder abnormalities (such as periureteric diverticula); in addition, the classification of VUR with nuclear cystography is less refined than that with VCUG. The nuclear cystography VUR grades of low, intermediate, and high roughly correspond to the fluoroscopic grades of 1 (low), 2 or 3 (intermediate), and 4 or 5 (high).26
Table 112-2
Effective Radiation Doses (mSv) for Boys and Girls
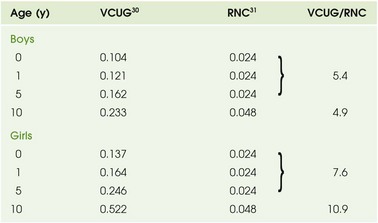
RNC, Radionuclide cystogram; VCUG, voiding cystourethrogram.
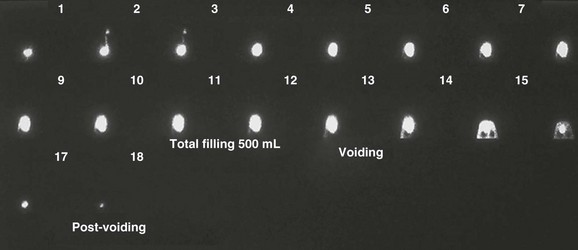
Figure 112-8 Vesicoureteral reflux.
Early in the study, this nuclear cystogram shows intermediate-grade vesicoureteral reflux that later fully drains and does not recur through voiding. Continuous acquisition of the nuclear cystogram allowed the demonstration of this transient reflux, which likely would have been missed with fluoroscopic voiding cystourethrography.
Diuretic Renography
Diuretic renography is used to distinguish obstructive from nonobstructive hydronephrosis.31 It attempts to quantify urinary obstruction based on the relative function of the hydronephrotic kidney compared with the normal kidney and the rate of urinary excretion of radiotracer (technetium-99m mertiatide or technetium-99m diethylene triamine pentaacetic acid) from the renal pelvis (and, in the presence of hydroureter, from the ureter) after a diuretic challenge (1 mg/kg IV furosemide). The graphic presentation of renal excretion using a time versus intensity curve is termed a renogram (e-Fig. 112-9); normal, equivocal, and obstructed patterns of excretion after a diuretic challenge, termed washout, have been described31 (Fig. 112-10). Additionally, the time required for half the tracer in the collecting system to pass across the ureteropelvic junction after the administration of furosemide, termed diuretic T½, is stratified to indicate a normal (0 to 10 minutes), equivocal (10 to 20 minutes), or obstructed (>20 minutes) pattern.32,33 These values are useful in distinguishing obstructive from nonobstructive hydronephrosis in older children and adults. However, application of these guidelines can lead to the misdiagnosis of obstruction in a large number of young infants with hydronephrosis demonstrated on routine prenatal sonography (e-Fig. 112-11).34 The high capacitance of the dilated renal pelvis and relatively low renal urine output in young infants limit the accuracy of this test in the setting of hydronephrosis in children younger than 2 years.33 Increasing hydronephrosis, decreasing split renal function of the hydronephrotic kidney, and a worsening washout curve all suggest the possibility of significant obstruction (Fig. 112-12).
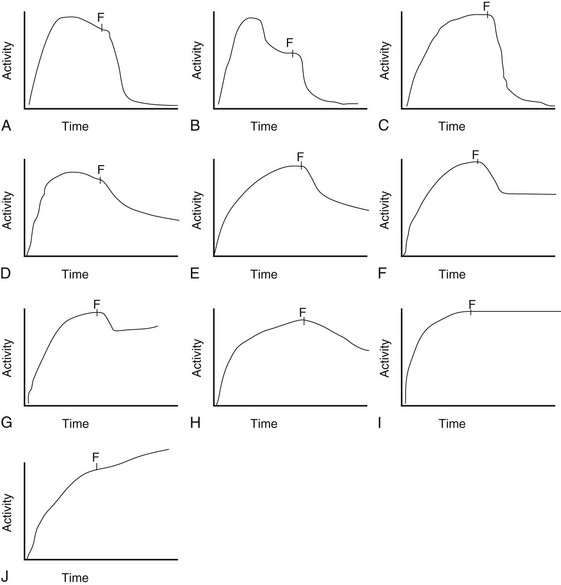
Figure 112-10 Diuretic renogram patterns.
Patterns A, B, and C are typically indicative of nonobstructed systems. Patterns D and E are equivocal in older children but usually indicate no obstruction in neonates and young infants with hydronephrosis. Patterns F and G often indicate flow-related obstruction. Patterns H, I, and J typically indicate obstruction in older children but are seen frequently in neonates and infants with nonobstructive hydronephrosis. F, Furosemide injection.
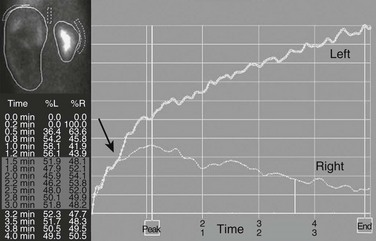
Figure 112-12 Hydronephrosis.
A markedly enlarged left kidney with central photopenic regions consistent with marked hydronephrosis. The renogram shows tracer accumulation and retention throughout, with no discernible washout after administration of a diuretic. Note that the renogram tracings of the two kidneys are superimposed during the first few minutes after injection of the tracer (arrow), which indicates nearly equal split renal function, as shown on the function table between 1.5 and 3 minutes.
e-Figure 112-9 A time versus activity graph shows a steady accumulation of tracer in the renal region of interest until washout occurs, starting 3 minutes after injection of a diuretic agent (arrow).
Note the superolateral background region of interest adjacent to both kidneys. Also note mild urinary stasis and hydronephrosis, with no spontaneous excretion until after administration of a diuretic agent. The diuretic T½ is approximately 10 minutes, which is considered normal in the presence of mild hydronephrosis.
e-Figure 112-11 Diuretic renogram patterns.
A, A washout curve shows prompt diminution of counts in both kidneys, with T½ values less than 10 minutes bilaterally. Split function is equal, and the renogram is normal. B, Marked right and moderate left hydronephrosis with prompt washout on the left and reduced washout on the right. Split function is equal, and the findings are equivocal for obstruction. Follow-up studies showed improvement, and surgery was not necessary. C, Moderate left hydronephrosis with prompt but limited washout that levels off. This pattern is worrisome for impending deterioration of renal function. Follow-up studies showed deterioration, and a pyeloplasty was performed. D, Severe left hydronephrosis with progressive accumulation of tracer throughout the study and no washout. This finding is often diagnostic of ureteropelvic obstruction.
Cortical Scintigraphy
The renal cortical scan typically is performed with technetium-99m–labeled dimercaptosuccinic acid. This agent is extracted by and then binds to cells of the proximal convoluted tubule. It does not accumulate in the medulla or collecting system, thus accounting for the scan appearance of cortical uptake with relative central photopenia of the medulla and renal sinus (Fig. 112-13). Imaging typically occurs 2 to 3 hours after injection and should be performed with pinhole collimation or single photon emission CT acquisition with a dual-headed camera.35,36 The accuracy in demonstrating acute pyelonephritis exceeds 95%.37 A defect that appears as a vague area of photopenia not associated with volume loss is more consistent with acute pyelonephritis, whereas a triangular, well-demarcated photopenic focus with volume loss typically is considered an atrophic scar (Fig. 112-14), although it also may be related to focal renal dysplasia. Most areas of infection resolve without residual scarring, especially in older children, but resolution may not occur until 6 months or longer after the acute event. Therefore a definitive diagnosis of a scar requires a follow-up study at least 6 months after the acute infection.38 Rounded defects identified with cortical scintigraphy should be further characterized with ultrasound to assess for a cyst or mass (e-Fig. 112-15).
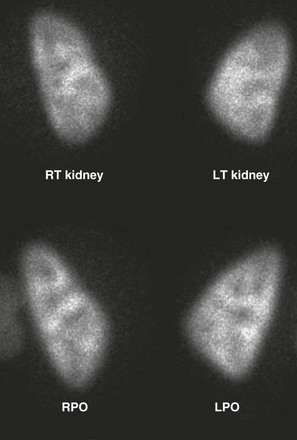
Figure 112-13 A normal dimercaptosuccinic acid cortical scan.
Note the relative photopenia of the medulla due to a lack of uptake by the deeper portions of the loop of Henle. Also note the decreased intensity of the polar regions as a result of the relatively thinner polar cortex when compared with the midpolar region. LPO, Left posterior oblique; LT, left; RPO, right posterior oblique; RT, right.
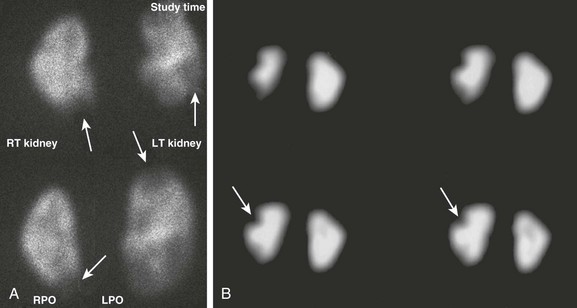
Figure 112-14 Pyelonephritis versus scarring.
A, Pinhole dimercaptosuccinic acid (DMSA) images obtained for split uptake assessment show bilateral photopenic defects that are rather poorly defined and not associated with renal parenchymal volume loss (arrows) indicating pyelonephritis. B, Coronal single photon emission computed tomography glucoheptonate images show sharply defined wedge-shaped defects (arrows) indicative of renal scars. Glucoheptonate has been largely replaced by DMSA for cortical scintigraphy because of better binding characteristics. LPO, Left posterior oblique; LT, left; RPO, right posterior oblique; RT, right.
Miscellaneous Renal Nuclear Studies
Quantitation of renal function is possible with nuclear imaging techniques.39 The relative function of each kidney can be assessed during the renogram before tracer exits the renal pelvis or with cortical scintigraphy. Regions of interest for each kidney are drawn from a posterior image, and relative function is given in terms of a percentage of total renal counts. The normal value is 50% ± 5%. Absolute renal function quantitation in terms of glomerular filtration rate or effective renal plasma flow can be performed with technetium-labeled mertiatide and dimercaptosuccinic acid, respectively, but these techniques require one to four blood samples.39 Renal function increases rapidly in the first 2 years of life and reaches adult values, when normalized to body surface area, by age 2 years (normal values range from 80 to 140 mL/min/1.73 m2).39
Computed Tomography
CT is one of our most powerful imaging tools. High-quality CT can be performed in patients of all ages and sizes and is not limited by bone or bowel gas. Relative immobility is required, and in children, reassurance, explanation of the procedure, the presence of a parent, sedation, and immobilization all contribute to a successful diagnostic study. Multidetector scanners that operate quickly obviate the need for sedation in most patients. Multiplanar reformatting, especially in the coronal plane, can depict the entire course of the urinary collecting system.40–42
Noncontrast imaging is performed for calcifications or nephrolithiasis, but most CT imaging of the genitourinary system is performed with IV contrast. Contrast enhancement is required for the evaluation of renal lesions and the vessels of the abdomen. Delayed imaging is useful for assessing the integrity of the collecting system (such as after trauma), assessing the course of the ureter, and evaluating renal masses and cysts. CT radiation doses should be reduced and optimized based on patient size and the purpose of the study. Scanning begins based on the speed of the particular CT scanner and the information being sought. By showing the progression of contrast enhancement of the cortex, medulla, and collecting system of the kidney, CT provides some assessment of renal function and anatomy.43–48
Magnetic Resonance Imaging
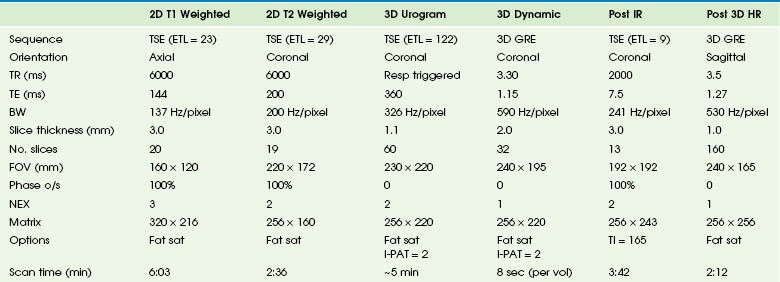
MRI has superior tissue characterization, multiplanar capabilities, and the ability to gather functional and anatomic information. Meticulous attention to patient preparation and scanning technique is essential to reliably obtain high-quality images. The typical imaging parameters are described in Table 112-3.
Urine in the collecting system and ureter has low signal intensity on T1-weighted images and higher signal intensity on T2-weighted scans. The kidney is easily visualized with an intermediate signal on T1-weighted sequences. The renal cortex has an intermediate signal close to that of the spleen, and the medullary pyramids show a lower intensity signal on T1-weighted images. The kidney has a uniformly high signal on T2-weighted scans (Fig. 112-16).49–56
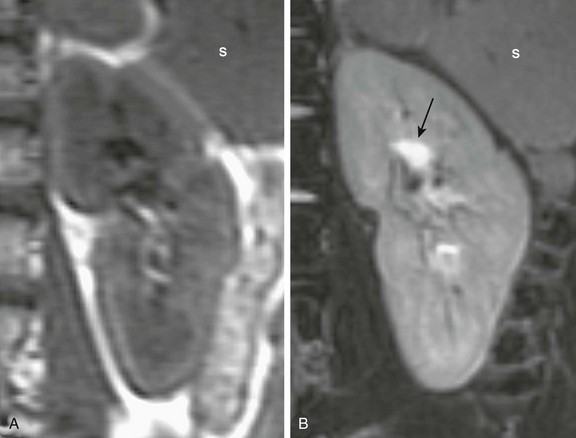
Figure 112-16 A normal renal magnetic resonance image.
A, A coronal T1-weighted image shows that the renal cortex is isointense to the adjacent spleen (S) and the medulla is hypointense relative to the cortex. B, A coronal T2-weighted fat-saturated image shows diffuse hyperintensity of the renal parenchyma relative to the spleen (S), with the urine in the central pelvis appearing quite hyperintense (arrow).
Magnetic Resonance Urography
MR urography (MRU) represents the next stage in the evolution of uroradiology, fusing superb anatomic and functional imaging into a single test that does not use ionizing radiation (Fig. 112-17).57–63 In addition to spin echo T1- and T2-weighted images, dynamic imaging is performed in conjunction with the injection of a gadolinium-based contrast agent to assess the concentrating and excretory functions of the kidney (e-Fig. 112-18). The evaluation of the contrast dynamics is similar to renal scintigraphy but with the important distinction that the signals originating from the renal parenchyma can be separated from those originating from the collecting system. The primary indication for MRU is in the evaluation of hydronephrosis (e-Fig. 112-19). Other evolving indications for MRU include evaluation of renal scarring and dysplasia, identification of ectopic ureters in children with urinary incontinence, and characterization of renal masses.
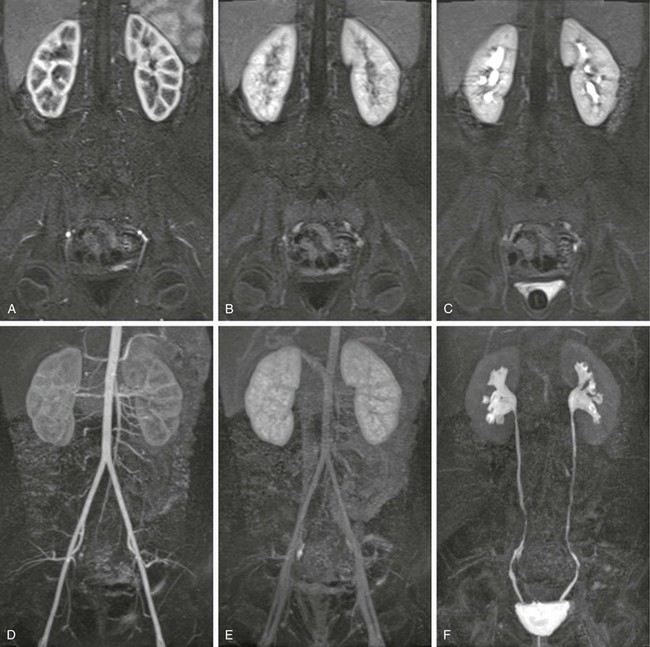
Figure 112-17 A normal magnetic resonance urogram in an 8-year-old girl.
Images A, B, and C show the same slice from three volume acquisitions acquired at time points corresponding to the cortical (arterial), parenchymal, and excretory phases of renal function, respectively. Images D, E, and F are maximum intensity projections derived from the total volume for the three same time points.
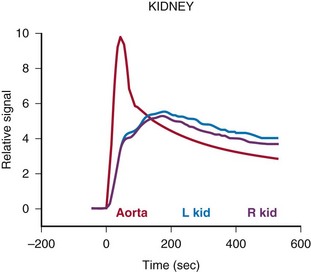
e-Figure 112-18 Time intensity curves for the patient shown in Figure 112-17.
These curves allow assessment and comparison of renal perfusion, concentration, and excretion similar to the time activity curves generated with diuretic renal scintigraphy.
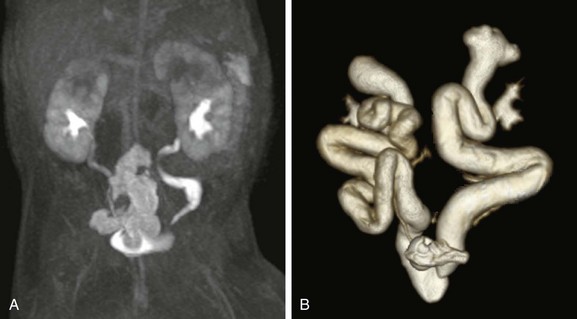
e-Figure 112-19 Hydronephrosis and poor renal function.
T2-weighted (A) and postcontrast T1-weighted (B) three-dimensional urograms show the anatomy and morphology of hydronephrotic and poorly functioning systems. Both kidneys are duplex with poorly functioning upper poles and associated megaureters. The lower pole ureters are seen on both the contrast-enhanced and the T2-weighted images. The ureters of the upper poles are only seen on the T2-weighted maximum intensity projection (MIP), whereas the T1-weighted MIP only shows poorly enhancing parenchyma of the upper pole. The anatomy and insertion of the megaureter can be assessed on the T2-weighted urogram.
Hydronephrosis and Obstructive Uropathy
Hydronephrosis is the most common indication for MRU in infants and children.64 Ureteropelvic junction obstruction is the most common cause of neonatal hydronephrosis. Obstructive uropathy occurs in a subset of children with hydronephrosis and refers to obstruction that results in an injury to the kidney.65 The kidney damage is not simply a result of mechanical impairment of urine flow but rather occurs as a result of a complex syndrome caused by the interaction of a variety of vasoactive factors and cytokines, leading to alterations of both glomerular hemodynamics and tubular function.66 It is necessary to try to determine if the degree of obstruction present will lead to either a loss of renal function in the future or, in the case of children, will limit the future development of the kidney.
In children, obstruction is usually both chronic and partial. The partial obstruction results in equilibrium between urine production, impaired urine outflow, and pelvic reservoir capacity.67 A steady state is reached between the amount of urine produced and the volume of the renal pelvis so that the pressure in the renal pelvis is in the normal range. This dynamic balance may be upset during diuresis or when the obstruction is exacerbated. The loss of balance results in a transient increase in pelvic pressure. It is unclear whether it is the frequency, duration, or severity of these transitory elevations in renal pelvic pressure that are responsible for renal damage and progressive loss of renal function.
With MRU, the hydronephrotic kidney is subjected to both a fluid challenge (IV hydration) and a diuretic challenge (IV furosemide administered 15 minutes before the administration of contrast material). The response of the kidney to this challenge determines the appearance of the MR nephrogram. If symmetric changes in the signal intensity of the nephrogram occur, the hydronephrosis is classified as a compensated hydronephrotic system—that is, the fluid challenge has been accommodated without increasing the pressure in the pelvicalyceal system. However, when the signal intensity changes are asymmetric, they most often indicate acute or chronic obstruction—that is, the fluid challenge has exceeded the capacity for renal drainage, and the pressure in the collecting system rises. This hydronephrosis is classified as a decompensated hydronephrotic system. Signs associated with decompensation include parenchymal edema on the T2-weighted images, delayed calyceal transit time, and a delayed and increasingly dense nephrogram (Fig. 112-20). These two patterns have different prognostic implications; little improvement in renal function can be expected after pyeloplasty in compensated kidneys, but significant improvement is seen in decompensated systems.68
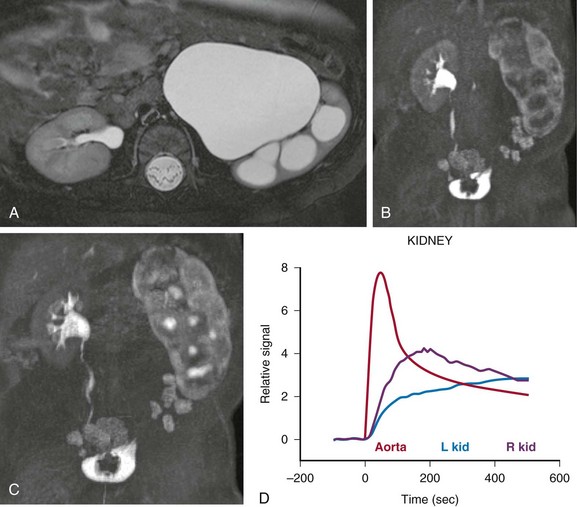
Figure 112-20 Decompensated ureteropelvic junction obstruction in a 3-month old-girl.
A, The axial T2-weighted image demonstrates marked hydronephrosis of the left kidney with ballooning of the calyces and thinning of the renal parenchyma. After administration of contrast material, calyceal excretion of contrast material is delayed on the left side (B), and an increasingly dense nephrogram is seen (C). The signal intensity versus time curve (D) shows delayed peak enhancement with gradual accumulation of signal within the parenchyma of the left kidney. L, Left; R, right.
The quality of the renal parenchyma is assessed both on the high-resolution T2-weighted images and during the parenchymal phase of the nephrogram. Signs that suggest underlying uropathy and permanent damage include architectural disorganization with loss of the corticomedullary differentiation, small subcortical cysts, and low cortical T2 signal intensity (e-Fig. 112-21). The nephrogram in these cases usually shows dim and patchy contrast enhancement reflecting damage to the microvasculature, as well as to the glomeruli and tubules. These imaging findings probably reflect the histologic changes of renal damage based on reduced glomerular number, glomerular hyalinization, cortical cysts, and interstitial inflammation and fibrosis.69 In contrast to uropathic kidneys, edematous kidneys typically show increased signal intensity on the T2-weighted images, as well as a delayed dense nephrogram. The edematous pattern typically is seen either with decompensated hydronephrosis or acute pyelonephritis.
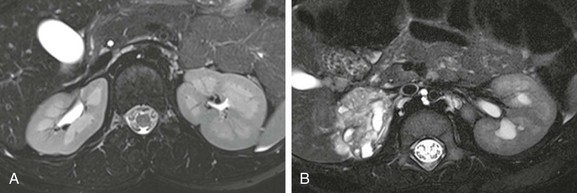
e-Figure 112-21 Renal dysplasia.
High-resolution T2-weighted images show a patient with normal renal anatomy (A), whereas part B shows a patient with right renal dysplasia. Excellent corticomedullary differentiation allows assessment of both the renal cortex and medulla and detection of cysts, scarring, edema, and architectural disorganization.
Congenital Malformations, Renal Scarring, and Dysplasia
Anomalies of renal fusion, position, and rotation are clearly demonstrated with MRU. Horseshoe and ectopic kidneys easily can be separated from the background and overlying tissues. Pelvic kidneys in particular are clearly demonstrated with MRU. Hypoplastic kidneys associated with ureteric ectopia and supernumerary kidneys usually can be demonstrated even if minimal renal function exists. MRU is the method of choice in the evaluation of incontinence associated with ectopic insertion of the ureter (Fig. 112-22).70
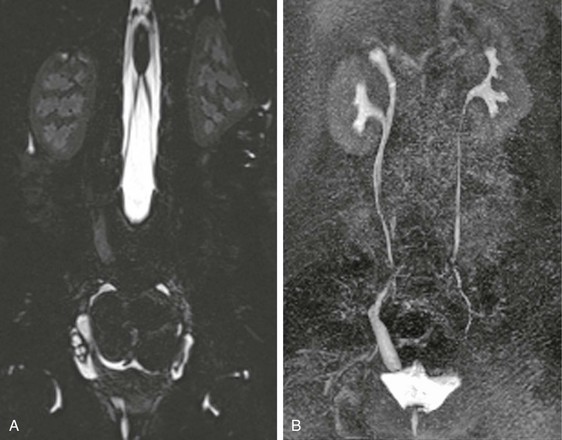
Figure 112-22 Ectopic ureteric insertion in a 9-year-old girl with incontinence.
The T2-weighted image (A) shows a small cystic and dysplastic right upper pole moiety with a dilated ureter seen extending below the bladder base. On the delayed postcontrast maximum intensity projection image (B), the dilated ectopic ureter is seen inserting distally into the vagina.
MRU enables identification of the acquired segmental scars most often associated with pyelonephritis and differentiation of areas of acute pyelonephritis from developed scars on the basis of mass effect and inflammatory changes. Acute pyelonephritis is associated with edema, mass effect, and swelling of the kidney. Mature scars are characterized by volume loss and contour defects of the kidney on T2-weighted images and perfusion defects on the dynamic contrast-enhanced images, and they exhibit dilatation of the adjacent calyx, indicating transmural parenchymal loss. Affected regions demonstrate no appreciable contrast enhancement, reflecting fibrosis and microvascular damage (Fig. 112-23).
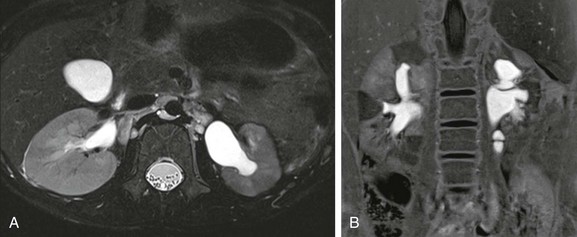
Figure 112-23 Renal scarring in a 5-year-old girl with a history of a recurrent urinary tract infection.
An axial T2-weighted image (A) shows a smaller left kidney with disorganization of the renal parenchyma and focal areas of low signal intensity. Minimal abnormality is seen on the right. The inversion recovery image after administration of contrast material (B) shows triangular areas of decreased intensity with associated deformity of the renal contour. The scars are seen adjacent to the calyces.
Acknowledgments
 What the Clinician Needs to Know
• Renal size, echogenicity, number and location, and/or the presence of congenital malformations, obstruction, scarring, or mass lesions
• Ureteral dilation and the presence of a ureterocele or extravesical ectopia
• Strengths and weakness of VCUG versus nuclear cystography
• Strengths and imaging indications for MRU
• Imaging guidelines for detection and follow-up of childhood urologic disease
Darge, K, Grattan-Smith, JD, Riccabona, M. Pediatric uroradiology: state of the art. Pediatr Radiol. 2011;41(1):82–91.
Jones, RA, Grattan-Smith, JD, Little, S. Pediatric magnetic resonance urography. J Magn Reson Imaging. 2011;33:510–526.
Jones, RA, Votaw, JR, Salman, K, et al. Magnetic resonance imaging evaluation of renal structure and function related to disease: technical review of image acquisition, postprocessing, and mathematical modeling steps. J Magn Reson Imaging. 2011;33:1270–1283.
Riccabona, M, Lindbichler, F, Sinzig, M. Conventional imaging in pediatric uroradiology. Eur J Radiol. 2002;43:100–109.
Riccabona, M, Mache, CJ, Lindbichler, F. Echo-enhanced color Doppler cystosonography of vesicoureteral reflux in children: improvement by stimulated acoustic emission. Acta Radiol. 2003;44:18–23.
Sukan, A, Bayazit, AK, Kibar, M, et al. Comparison of direct radionuclide cystography and voiding direct cystography in the detection of vesicoureteral reflux. Ann Nucl Med. 2003;17:549–553.
References
1. Darge, K, Riedmiller, H. Current status of vesicoureteral reflux diagnosis. World J Urol. 2004;22:88–95.
2. Riccabona, M, Lindbichler, F, Sinzig, M. Conventional imaging in pediatric uroradiology. Eur J Radiol. 2002;43:100–109.
3. McEwing, RL, Anderson, NG, Hellewell, S. Comparison of echo-enhanced ultrasound with fluoroscopic MCU for the detection of vesicoureteral reflux in neonates. Pediatr Radiol. 2002;32:853–858.
4. Medina, LS, Aguirre, E, Altman, NR. Vesicoureteral reflux imaging in children: comparative cost analysis. Acad Radiol. 2003;10:139–144.
5. Papdopoulou, F, Efremidis, SC, Oiconomou, A, et al. Cyclic voiding cystourethrography: is vesicoureteral reflux missed with standard voiding cystourethrography. Eur Radiol. 2002;12:666–670.
6. Piaggio, G, Degl’ Innocenti, ML, Toma, P. Cystosonography and voiding cystourethrography in the diagnosis of vesicoureteral reflux. Pediatr Nephrol. 2003;18:18–22.
7. Persinakis, K, Raissaki, M, Damilakis, J, et al. Fluoroscopy-controlled voiding cystourethrography in infants and children: are the radiation risks trivial? Eur Radiol. 2006;16:846–851.
8. Persliden, J, Helmrot, E, Hjort, P, et al. Dose and image quality in the comparison of analogue and digital techniques in paediatric urology examinations. Eur Radiol. 2004;14:638–644.
9. Lederman, HM, Khademian, ZP, Felice, M. Dose reduction fluoroscopy in pediatrics. Pediatr Radiol. 2002;32:844–848.
10. Ward, VL, Barnewolt, CE, Strauss, KY, et al. Radiation exposure reduction during voiding cystourethrography in a pediatric porcine model of vesicoureteral reflux. Radiology. 2006;238:96–106.
11. Kis, E, Nyitrai, A, Várkonyi, I, et al. Voiding urosonography with second-generation contrast agent versus voiding cystourethrography. Pediatr Nephrol. 2010;25(11):2289–2293.
12. Darge, K. Voiding urosonography with ultrasound contrast agents for the diagnosis of vesicoureteric reflux in children. I. Procedure. Pediatr Radiol. 2008;38(1):40–53.
13. Riccabona, M. Urinary tract imaging in infancy. Pediatr Radiol. 2009;39(suppl 3):436–445.
14. Darge, K. Voiding urosonography with US contrast agent for the diagnosis of vesicoureteric reflux in children: an update. Pediatr Radiol. 2010;40(6):956–962.
15. Kiessling, I, Bzyl, J, Kiessling, F. Molecular ultrasound imaging and its potential for paediatric radiology. Pediatr Radiol. 2011;41(2):176–184.
16. Avni, EF, Brion, LE. Ultrasound of the neonate urinary tract. Urol Radiol. 1983;5:177–183.
17. Hricak, H, Slovis, TL, Callen, CW, et al. Neonatal kidneys: sonographic-anatomic correlation. Radiology. 1983;147:699–702.
18. Keller, MS. Renal Doppler sonography in infants and children. Radiology. 1989;172:603–604.
19. Coley, BD. Pediatric applications of abdominal vascular Doppler: part II. Pediatr Radiol. 2004;34:772–786.
20. Haller, JO, Berdon, WE, Friedman, AP. Increased renal cortical echogenicity: a normal finding in neonates and infants. Radiology. 1982;142:173–174.
21. Jequier, S, Paltiel, H, Lafortune, M. Ureterovesical jets in infants and children: duplex and color Doppler US studies. Radiology. 1990;175:349–353.
22. Kraus, RA, Gaisie, G, Young, LW. Increased renal parenchymal echogenicity: causes in pediatric patients. Radiographics. 1990;10:1009–1018.
23. Riccabona, M. Modern pediatric ultrasound: Potential applications and clinical significance: a review. Clin Imaging. 2006;30:77–86.
24. Scoutt, LM, Zawin, ML, Taylor, KWJ. Doppler US. Part II. Clinical applications. Radiology. 1990;174:309–319.
25. Wiener, JS, O’Hara, SM. Optimal timing of initial postnatal ultrasonography in newborns with prenatal hydronephrosis. J Urol. 2002;168:1826–1829.
26. Mandell, GA, Eggli, DF, Gilday, DL, et al. Society of Nuclear Medicine procedure guideline for radionuclide cystography in children (pdf). http://interactive.snm.org/docs/pg_ch32_0703.pdf, 2013. [Accessed January 3].
27. Bower, G, Lovegrove, FT, Geijsel, H, et al. Comparison of “direct” and “indirect” radionuclide cystography. J Nucl Med. 1985;26(5):465–468.
28. Gelfand, MJ, Koch, BL, Elgazzar, AH, et al. Cyclic cystography: diagnostic yield in selected pediatric populations. Radiology. 1999;213:118–120.
29. Dikshit, MP, Acharya, VN, Shikare, S, et al. Comparison of direct radionuclide cystography with micturating cystourethrography for the diagnosis of vesicoureteric reflux, and its correlation with cystoscopic appearances of the ureteric orifices. Nephrol Dial Transplant. 1993;8(7):600–602.
30. Merrick, MV, Notghi, A, Chalmers, N, et al. Long-term follow up to determine the prognostic value of imaging after urinary tract infections. Part 1: Reflux. Arch Dis Child. 1995;72(5):388–392.
31. Conway, JJ, Maizels, M. The “well tempered” diuretic renogram: a standard method to examine the asymptomatic neonate with hydronephrosis or hydroureteronephrosis. A report from combined meetings of the Society for Fetal Urology and members of the Pediatric Nuclear Medicine Council–Society of Nuclear Medicine. J Nucl Med. 1992;33:2047–2051.
32. Mandell, GA, Cooper, JA, Leonard, JC, et al. Society of Nuclear Medicine procedure guideline for diuretic renography in children (pdf). http://interactive.snm.org/docs/pg_ch29_0403.pdf, 2013. [Accessed January 3].
33. Koff, SA, Binkovitz, L, Coley, B, et al. Renal pelvis volume during diuresis in children with hydronephrosis: implications for diagnosing obstruction with diuretic renography. J Urol. 2005;174:303–307.
34. Gordon, I. Diuretic renography in infants with prenatal unilateral hydronephrosis: an explanation for the controversy about poor drainage. BJU Int. 2001;87:551–555.
35. Mandell, GA, Eggli, DF, Gilday, DL, et al. Society of Nuclear Medicine procedure guideline for renal cortical scintigraphy in children (pdf). http://interactive.snm.org/docs/pg_ch32_0403.pdf, 2013. [Accessed January 3].
36. Piepsz, A, Colarinha, P, Gordon, I, et al. Guidelines on 99mTc-DMSA scintigraphy in children (pdf). http://www.eanm.org/publications/guidelines/gl_paed_dmsa_scin.pdf, 2013. [Accessed January 3].
37. Ruston, HG, Majd, M, Chandra, R, et al. Evaluation of 99m technetium-dimercapto-succinic acid renal scans in experimental acute pyelonephritis in piglet. J Urol. 1988;140:1169–1174.
38. Stokland, E, Hellstrom, M, Jacobsson, B, et al. Renal damage one year after first urinary tract infection: role of dimercaptosuccinic acid scintigraphy. J Pediatr. 1996;129(6):815–820.
39. Piepsz, A, Colarinha, P, Gordon, I, et al. Guidelines for glomerular filtration rate determination in children (pdf). http://www.eanm.org/publications/guidelines/gl_paed_gfrd.pdf, 2012. [Accessed January 3].
40. Donnelly, LF, Frush, DP. Pediatric multidetector body CT. Radiol Clin North Am. 2003;41:637–655.
41. Huang, J, Kim, YH, Shankar, S, et al. Multidetector CT urography: comparison of two different scanning protocols for improved visualization of the urinary tract. J Comput Assist Tomogr. 2006;30:33–36.
42. Siegel, MJ. Protocols for helical CT in pediatrics. In: Silverman PM, ed. Helical (spiral) computed tomography: a practical approach to clinical protocols. New York: Lippincott-Raven, 1998.
43. Strouse, PJ, Bates, DG, Bloom, DA, et al. Non-contrast thin-section helical CT of urinary tract calculi in children. Pediatr Radiol. 2002;32:326–332.
44. Kawamoto, S, Horton, KM, Fishman, EK. Opacification of the collecting system and ureters on excretory-phase CT using oral water as contrast medium. AJR Am J Roentgenol. 2006;186:136–140.
45. Frush, DP. Pediatric CT: practical approach to diminish the radiation dose. Pediatr Radiol. 2002;32:714–717.
46. Frush, DP. Review of radiation issues for computed tomography. Semen Ultrasound CT MR. 2004;25:17–24.
47. Kokako, E, BRATT, S, Dora, VS. Renal multidetector row CT. Radiol Clin North Am. 2005;43:1021–1047.
48. Nakayama, Y, Awai, K, Fenamate, Y, et al. Abdominal CT with low tube voltage: preliminary observations about radiation dose, contrast enhancement, image quality, and noise. Radiology. 2005;237:945–951.
49. Borthen, A, Pierre-Jerome, C, Gestalt, KI. Pediatric excretory MR urography: comparative study of enhanced and non-enhanced techniques. Eur Radiol. 2003;13:1423–1427.
50. Grant, PE, Matsuda, KM. Applications of new MR techniques in pediatric patients. Magn Reson Imaging Clin North Am. 2003;11:493–522.
51. Riccabona, M. Pediatric MRU—its potential and its role in the diagnostic work-up of upper urinary tract dilatation in infants and children. World J Urol. 2004;22:79–87.
52. Riccabona, M, Ruppert-Kohlmayr, A, Ring, E, et al. Potential impact of pediatric MR urography on the imaging algorithm in patients with a functional single kidney. AJR Am J Roentgenol. 2004;183:795–800.
53. Rohrschneider, WK, Haufe, S, Clorius, JH. MR to assess renal function in children. Eur Radiol. 2003;13:1033–1045.
54. Staatz, G, Nolte-Ernsting, CC, Adam, GB, et al. Feasibility and utility of respiratory-gated, gadolinium-enhanced T1-weighted magnetic resonance urography in children. Invest Radiol. 2000;35:504–512.
55. Verswijvel, GA, Oyen, RH, Van Poppel, HP, et al. Magnetic resonance imaging in the assessment of urologic disease: an all-in-one approach. Eur Radiol. 2000;10:1614–1619.
56. Bennett, HF, Debiao, L. MR imaging of renal function. Magn Reson Imaging Clin N Am. 1997;5:107–126.
57. Jones, RA, Grattan-Smith, JD, Little, S. Pediatric magnetic resonance urography. J Magn Reson Imaging. 2011;33:510–526.
58. Grattan-Smith, JD, Jones, RA. Magnetic resonance urography in children. Magn Reson Imaging Clin North Am. 2008;16:515–531.
59. Grattan-Smith, JD, Jones, RA. MR urography: technique and results for the evaluation of urinary obstruction in the pediatric population. Magn Reson Imaging Clin North Am. 2008;16:643–660.
60. Rohrschneider, WK, Becker, K, Hoffend, J, et al. Combined static-dynamic MR urography for the simultaneous evaluation of morphology and function in urinary tract obstruction. II. Findings in experimentally induced ureteric stenosis. Pediatr Radiol. 2000;30:523–532.
61. Rohrschneider, WK, Haufe, S, Wiesel, M, et al. Functional and morphologic evaluation of congenital urinary tract dilatation by using combined static-dynamic MR urography: findings in kidneys with a single collecting system. Radiology. 2002;224:683–694.
62. Vivier, PH, Dolores, M, Taylor, M, et al. MR urography in children. Part 1: how we do the F0 technique. Pediatr Radiol. 2010;40:732–738.
63. Vivier, PH, Dolores, M, Taylor, M, et al. MR urography in children. Part 2: how to use ImageJ MR urography processing software. Pediatr Radiol. 2010;40:739–746.
64. Lebowitz, RL, Griscom, NT. Neonatal hydronephrosis: 146 cases. Radiol Clin North Am. 1977;15:49–59.
65. O’Reilly, PH. Obstructive uropathy. Q J Nucl Med. 2002;46:295–303.
66. Chevalier, RL, Thornhill, BA, Forbes, MS, et al. Mechanisms of renal injury and progression of renal disease in congenital obstructive nephropathy. Pediatr Nephrol. 2010;25:687–697.
67. Koff, SA. Pathophysiology of ureteropelvic junction obstruction. Clinical and experimental observations. Urol Clin North Am. 1990;17:263–272.
68. Little, SB, Jones, RA, Grattan-Smith, JD. Evaluation of UPJ obstruction before and after pyeloplasty using MR urography. Pediatr Radiol. 2008;38(suppl 1):S106–S124.
69. Elder, JS, Stansbrey, R, Dahms, BB, et al. Renal histological changes secondary to ureteropelvic junction obstruction. J Urol. 1995;154:719–722.
70. Avni, FE, Nicaise, N, Hall, M, et al. The role of MR imaging for the assessment of complicated duplex kidneys in children: preliminary report. Pediatr Radiol. 2001;31:215–223.
[/level-membership-for-pediatrics-category][not-level-membership-for-pediatrics-category]Chapter 112
Imaging Techniques
Radiographic Procedures
Imaging begins with a frontal radiograph of the abdomen to identify any calcifications or masses. After this preliminary radiograph is obtained, low osmolar contrast media with a high iodine content is administered intravenously at a dose of 2 mL/kg (maximum, 150 mL) to obtain adequate iodine concentration in the renal tubules and collecting system. The filming sequence is tailored to the individual examination. An initial frontal radiograph within 1 to 2 minutes of injection images the nephrographic phase. Assessment of this radiograph determines subsequent filming. Upon routine examination, a radiograph at approximately 5 to 10 minutes allows visualization of the kidneys and their collecting systems, including the bladder (e-Fig. 112-1). In the prone position, the higher specific gravity of the contrast material allows better visualization of the anteriorly positioned renal pelves and proximal ureters.
Voiding Cystourethrography
Antegrade voiding cystourethrography (VCUG) is the traditional examination of choice for detailed anatomic evaluation of the bladder, study of the anatomy of the male urethra, and identification of vesicoureteral reflux (VUR). The bladder is filled by gravity pressure, using dilute sterile contrast media with an iodine concentration of 80 to 100 mg/mL. The predicted bladder capacity (in milliliters) for children younger than 1 year is the child’s weight in kilograms multiplied by 7. In children older than 1 year, the predicted capacity is the child’s age in years plus 2, multiplied by 30.1,2
An early bladder filling image is obtained to evaluate for ureteroceles or masses. Images with a full urinary bladder are obtained in the lateral oblique projections to look for VUR. Voiding films are useful to evaluate the bladder and urethra (particularly the male urethra) and for the diagnosis of VUR, which may occur only during voiding. After voiding, an image of the bladder documents any postvoid residual, and an image of the kidneys documents any reflux that occurred during the examination. Neonates should undergo at least two filling and voiding cycles to increase the chance of detecting VUR.3–6 Pulsed fluoroscopy, last image hold recording, and videotaping are important imaging strategies for reducing radiation exposure.7–10
Ultrasound
Contrast-Enhanced Voiding Ultrasonography
The intravesical instillation of ultrasound contrast agents in the urinary bladder allows the sonographic evaluation of VUR without the use of ionizing radiation.11–14 These microbubble contrast agents are composed of an outer shell of lipid, protein, or polymer that encases a gas, most commonly a perfluorocarbon.15 The gas is highly reflective on ultrasound imaging (Fig. 112-2) and can be detected even when administered in very small volumes. The ultrasound transducer is positioned intermittently over the bladder, ureters, and kidneys while the bladder is filled. On grayscale imaging, the microbubbles appear echogenic. Refluxed contrast material is easily detected in the ureters and kidneys (Fig. 112-3). Although this technique does not avoid catheterization, it does eliminate radiation exposure. Results indicate that the sensitivity for VUR detection is comparable with that of standard techniques. A reflux grading system for contrast-enhanced voiding ultrasonography has been developed and is similar to the international grading system for VCUG.12 Urethral visualization is possible with contrast-enhanced voiding ultrasonography but remains challenging.
Figure 112-2 Contrast-enhanced cystosonography.
Transverse ultrasound images after instillation of an ultrasound contrast agent into the urinary bladder. A, On gray-scale imaging, the contrast agent appears as hyperechoic material in the bladder (straight arrow) surrounded by anechoic urine. Reflux into the distal left ureter (curved arrow) is present but somewhat difficult to appreciate. B, Color overlay technology shows the contrast agent to better advantage as bright orange material in the bladder (straight arrow) and distal ureter (curved arrow). C, Subtraction technology further accentuates the presence of contrast material by eliminating non–contrast-enhanced background tissue. Contrast material in the bladder (straight arrow) and ureter (curved arrow) are readily apparent. (Images courtesy Dr. Kassa Darge.)
Figure 112-3 Contrast-enhanced cystosonography.
Longitudinal ultrasound images of the kidney, obtained during contrast-enhanced voiding ultrasonography, demonstrate reflux into the renal collecting system (arrows) on gray-scale (A), color-overlay (B), and subtraction (C) images. (Images courtesy Dr. Kassa Darge.)
Renal Ultrasonography
Ultrasonography is an ideal method for examining the kidneys and bladder in infants and children because of their small physical habitus and lack of abdominal fat and because ultrasonography does not utilize ionizing radiation. Variable transducer frequencies and transducer design (e.g., sector, phased, curvilinear, and linear array) allow for individualized approaches. Doppler ultrasound is valuable for the detection of blood flow, to confirm arterial perfusion, or to exclude venous thrombosis. Measurable blood flow parameters from spectral Doppler analysis include peak systolic velocity, end-diastolic velocity, and acceleration times. The normal renal artery has a prompt systolic upstroke with an acceleration time of 70 msec or less and a visible early systolic peak (e-Fig. 112-4). The normal resistive index depends on the patient’s age; it may be as high as 0.9 in a preterm infant and falls to around the adult value of 0.7 in the first few months of life.16–19
e-Figure 112-4 A normal renal Doppler waveform.
A prompt systolic upstroke and normal forward flow through diastole are present.
In young children, it is advisable to initiate the urogenital ultrasound examination with an examination of the bladder. The full bladder of an infant usually empties when the transducer is placed in the suprapubic region. Kidneys are imaged in the longitudinal and transverse planes. The kidneys are ovoid solid organs with fine, medium-level echoes arising from the cortex, a well-delineated corticomedullary junction with brightly echoic arcuate arteries, and pyramid-shaped, relatively large medullary rays that are hypoechoic. Cortical echogenicity in neonates and young infants is higher and the medullary pyramids are more hypoechoic than in older children (Fig. 112-5). The cortical echogenicity is increased compared with the liver and spleen in preterm infants, isoechoic in neonates and young infants, and diminishes progressively in older children. The transition from the infant renal echo pattern to that of the child typically occurs between 6 and 9 months (Fig. 112-6). Normal pediatric sonographic measurements of right and left kidney length, based on height and age, are provided in Table 112-1.20–25
Table 112-1
Normal Sonographic Renal Lengths in Children Based on Height and Age
From Konus OL, Ozdemir A, Akkaya A, et al. Normal liver, spleen, and kidney dimensions in neonates, infants, and children: evaluation with sonography. AJR. 1998;171:1693-1698.
Nuclear Medicine
Nuclear cystography is performed for the assessment of VUR and is an alternative to fluoroscopic VCUG. The examination is performed by direct instillation of radiotracer (technetium-99m–sulfur colloid) and sterile saline solution into the bladder after sterile catheterization26 or indirectly after nuclear renography with planar images obtained during voiding.27 Dynamic imaging of the bladder and kidney regions is acquired with use of a posterior gamma camera throughout the filling and voiding cycle. The data can be grouped (in 10- or 60-second intervals) and viewed dynamically. VUR is documented when tracer is shown to ascend into a tubular structure corresponding to the ureter or when the renal collecting system is visualized. The dose of tracer is dependent on bladder volume: 300 mCi for bladder volumes up to 300 mL, and 600 mCi for larger bladder volumes. A cyclic cystogram is recommended for children younger than 2 years, for children with previously documented VUR or a high suspicion for VUR, and for children who void well before the expected bladder capacity is reached. The procedure is identical to the standard cystogram; however, the catheter is left in the bladder after the first voiding cycle and is used to refill the bladder for a repeat void. As with VCUG, cyclic studies increase the diagnostic yield (e-Fig. 112-7), identifying an additional 10% to 15% of children with VUR compared with noncyclic voiding studies.28
e-Figure 112-7 Vesicoureteral reflux.
A cyclic nuclear cystogram demonstrates a normal first cycle, with intermediate-grade reflux present on the second cycle only (arrow).
Nuclear cystography offers three main advantages over fluoroscopic VCUG: increased detection of VUR (up to an additional 20%) (Fig. 112-8), frequent detection of a higher grade of VUR,29,30 and reduced radiation dose (tenfold) (Table 112-2). Disadvantages of nuclear cystography include a lack of detailed anatomic visualization of the urethra and collecting systems and limited identification of bladder abnormalities (such as periureteric diverticula); in addition, the classification of VUR with nuclear cystography is less refined than that with VCUG. The nuclear cystography VUR grades of low, intermediate, and high roughly correspond to the fluoroscopic grades of 1 (low), 2 or 3 (intermediate), and 4 or 5 (high).26
Table 112-2
Effective Radiation Doses (mSv) for Boys and Girls
RNC, Radionuclide cystogram; VCUG, voiding cystourethrogram.
Figure 112-8 Vesicoureteral reflux.
Early in the study, this nuclear cystogram shows intermediate-grade vesicoureteral reflux that later fully drains and does not recur through voiding. Continuous acquisition of the nuclear cystogram allowed the demonstration of this transient reflux, which likely would have been missed with fluoroscopic voiding cystourethrography.
Diuretic Renography
Diuretic renography is used to distinguish obstructive from nonobstructive hydronephrosis.31 It attempts to quantify urinary obstruction based on the relative function of the hydronephrotic kidney compared with the normal kidney and the rate of urinary excretion of radiotracer (technetium-99m mertiatide or technetium-99m diethylene triamine pentaacetic acid) from the renal pelvis (and, in the presence of hydroureter, from the ureter) after a diuretic challenge (1 mg/kg IV furosemide). The graphic presentation of renal excretion using a time versus intensity curve is termed a renogram (e-Fig. 112-9); normal, equivocal, and obstructed patterns of excretion after a diuretic challenge, termed washout, have been described31 (Fig. 112-10). Additionally, the time required for half the tracer in the collecting system to pass across the ureteropelvic junction after the administration of furosemide, termed diuretic T½, is stratified to indicate a normal (0 to 10 minutes), equivocal (10 to 20 minutes), or obstructed (>20 minutes) pattern.32,33 These values are useful in distinguishing obstructive from nonobstructive hydronephrosis in older children and adults. However, application of these guidelines can lead to the misdiagnosis of obstruction in a large number of young infants with hydronephrosis demonstrated on routine prenatal sonography (e-Fig. 112-11).34 The high capacitance of the dilated renal pelvis and relatively low renal urine output in young infants limit the accuracy of this test in the setting of hydronephrosis in children younger than 2 years.33 Increasing hydronephrosis, decreasing split renal function of the hydronephrotic kidney, and a worsening washout curve all suggest the possibility of significant obstruction (Fig. 112-12).
Figure 112-10 Diuretic renogram patterns.
Patterns A, B, and C are typically indicative of nonobstructed systems. Patterns D and E are equivocal in older children but usually indicate no obstruction in neonates and young infants with hydronephrosis. Patterns F and G often indicate flow-related obstruction. Patterns H, I, and J typically indicate obstruction in older children but are seen frequently in neonates and infants with nonobstructive hydronephrosis. F, Furosemide injection.
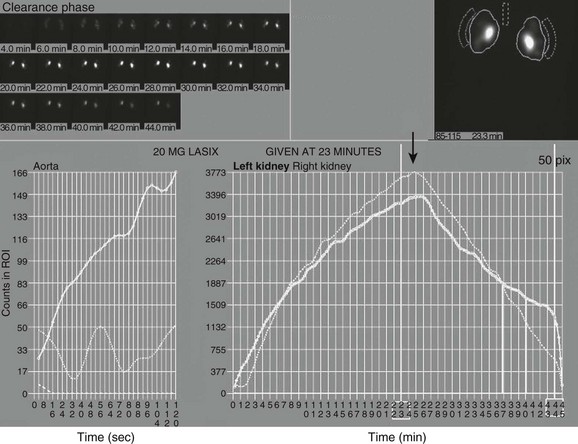
Figure 112-12 Hydronephrosis.
A markedly enlarged left kidney with central photopenic regions consistent with marked hydronephrosis. The renogram shows tracer accumulation and retention throughout, with no discernible washout after administration of a diuretic. Note that the renogram tracings of the two kidneys are superimposed during the first few minutes after injection of the tracer (arrow), which indicates nearly equal split renal function, as shown on the function table between 1.5 and 3 minutes.
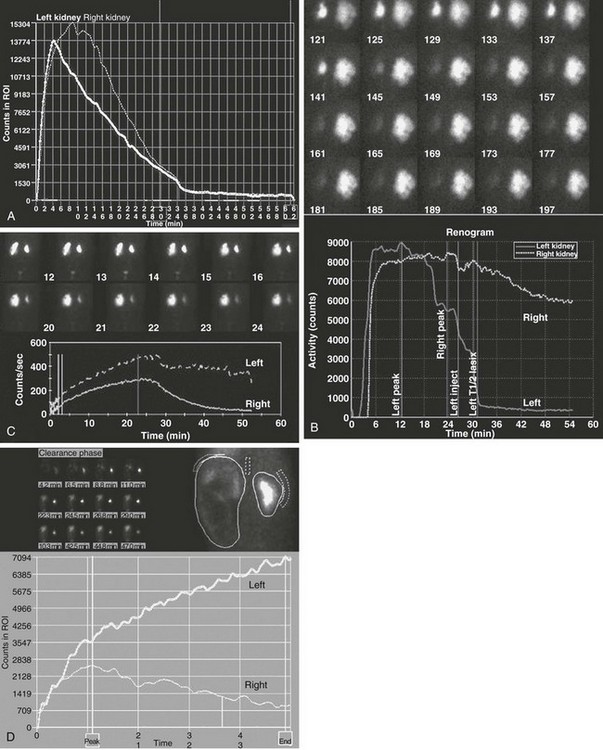
e-Figure 112-9 A time versus activity graph shows a steady accumulation of tracer in the renal region of interest until washout occurs, starting 3 minutes after injection of a diuretic agent (arrow).
Note the superolateral background region of interest adjacent to both kidneys. Also note mild urinary stasis and hydronephrosis, with no spontaneous excretion until after administration of a diuretic agent. The diuretic T½ is approximately 10 minutes, which is considered normal in the presence of mild hydronephrosis.
e-Figure 112-11 Diuretic renogram patterns.
A, A washout curve shows prompt diminution of counts in both kidneys, with T½
[/not-level-membership-for-pediatrics-category]
