CHAPTER 3 Imaging
Plain Radiographs
Basic science
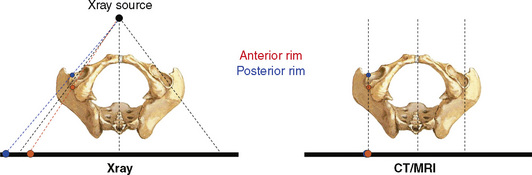
To understand the projected anatomy of the hip and the potential technical pitfalls related to it, it is essential to know the basic geometric radiographic principles. Conventional radiography is based on a point-shaped radiation source. In contrast with computed tomography scanning and magnetic resonance imaging, the image shows a distorted projection of the real anatomy. This conical projection implies that objects lying closer to the x-ray source necessarily will be projected more laterally (Figure 3-1).
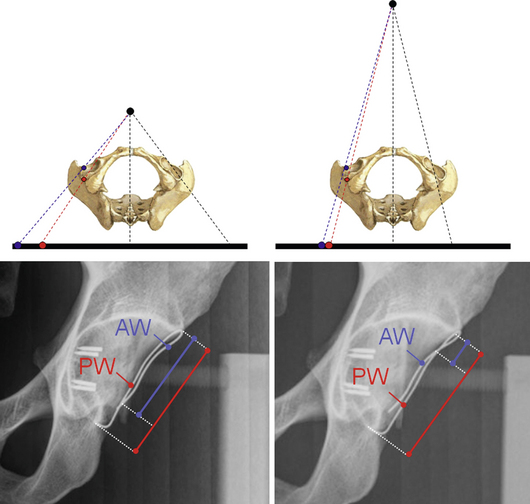
To obtain reproducible x-ray projections, it is mandatory that the film-focus distance is standardized. A radiograph with a very small film-focus distance can lead to a magnification of anatomic structures that are lying closer to the x-ray beam and vice versa (Figure 3-2).
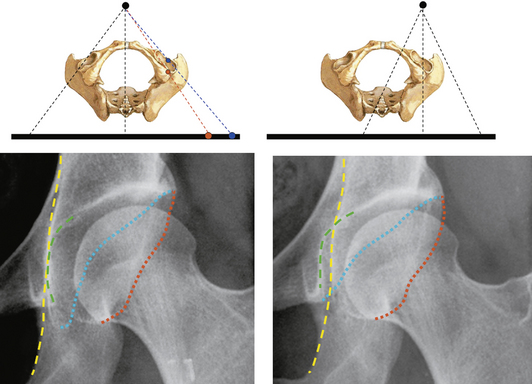
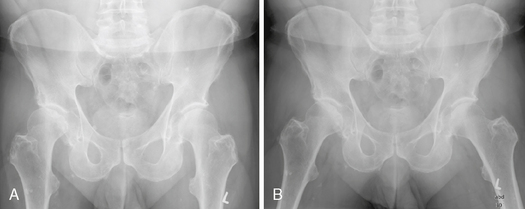
In addition, the proper centering of the x-ray beam is crucial. Two radiographs of the same patient taken with different beam centers can reveal a substantially different radiographic joint anatomy of the hip; this can typically be seen when radiographs of the entire pelvis are compared with radiographs of an individual hip (Figure 3-3).
Radiographic technique for specific projections
Anteroposterior Pelvic Radiograph
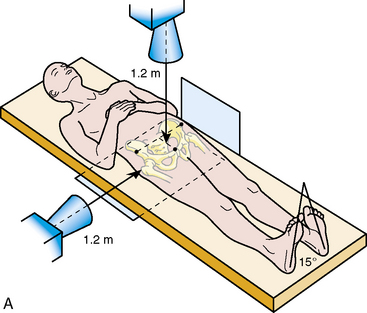
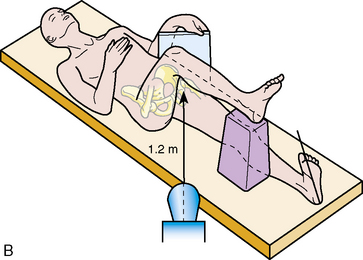
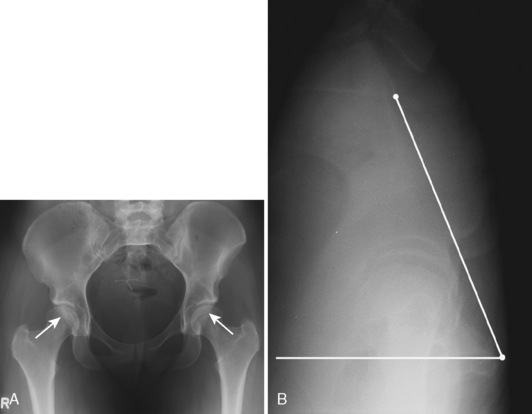
To correctly analyze hip joint morphology, an entire pelvic view—not only imaging of the affected hip—is mandatory. The AP pelvic radiograph is taken as a standard in our department, with the patient lying supine (Figure 3-4, A). This can be directly compared with intraoperative AP pelvic radiographs while the patient is under general anesthesia or with follow up radiographs during the early rehabilitation period. The legs have to be internally rotated to adjust for femoral antetorsion, and the film-focus distance should be 1.2 m. The central beam should be directed to the midpoint between the superior border of the symphysis and a line that connects both of the anterior superior iliac spines; these landmarks can easily and reproducibly be palpated by the radiology technician. It is extremely important for the correct interpretation of the radiographs that all radiographs are obtained with the same protocol.
Axial Cross-Table View of the Proximal Femur
The axial cross-table view of the proximal femur visualizes the anterior and posterior contour of the femoral head–neck junction, which cannot be seen on the AP pelvic radiograph. This image is taken with the patient in the supine position with the contralateral hip flexed and the ipsilateral leg internally rotated (Figure 3-4, B). Again, the film-focus distance is 1.2 m, and the central beam is directed to the inguinal fold with an angle of 45 degrees. As an alternative to this view, a Dunn-Rippstein view or a frog-leg lateral radiograph may be obtained.
False Profile
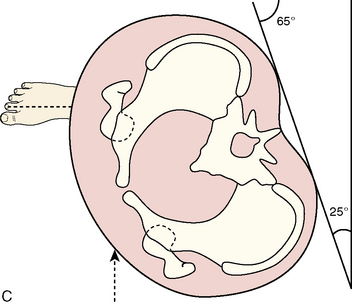
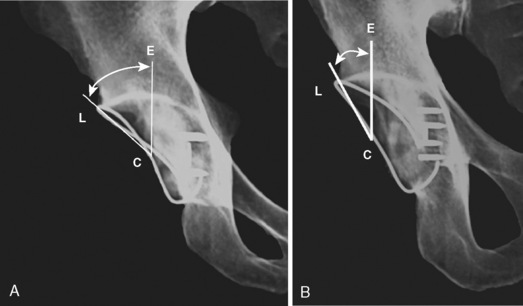
The false profile of the hip is taken with the patient standing (Figure 3-4, C). The index hip is in contact with the radiographic table, and the patient is rotated 25 degrees backward while the long axis of the foot remains parallel with the x-ray table. This view is used to quantify anterior acetabular coverage, the narrowing of the joint space posteroinferiorly or anterosuperiorly, and the decentration of the femoral head into the defect.
Abduction View
The abduction view is an analogous view to the AP pelvic radiograph, with the patient’s legs positioned in approximately 20 degrees of abduction and with the internal rotation of both legs. This view is used to simulate the appearance—particularly the congruency—of the hip after a planned hip reorientation osteotomy (Figure 3-5).
Radiographic parameters
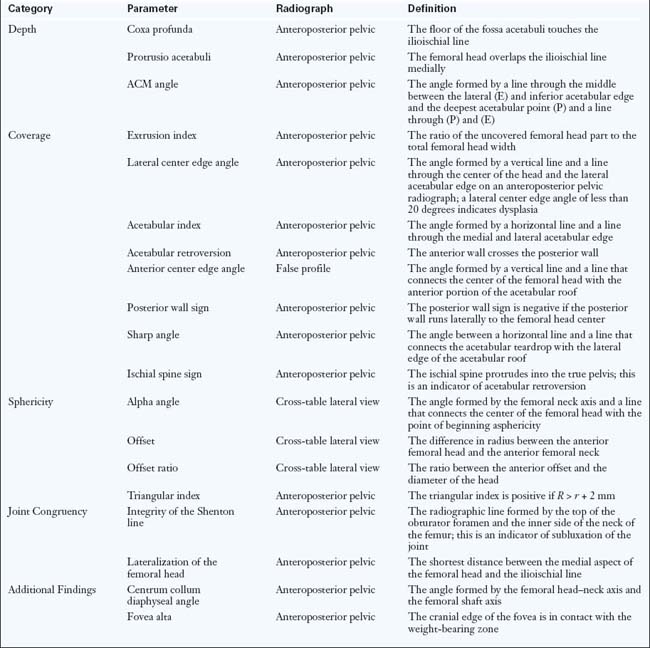
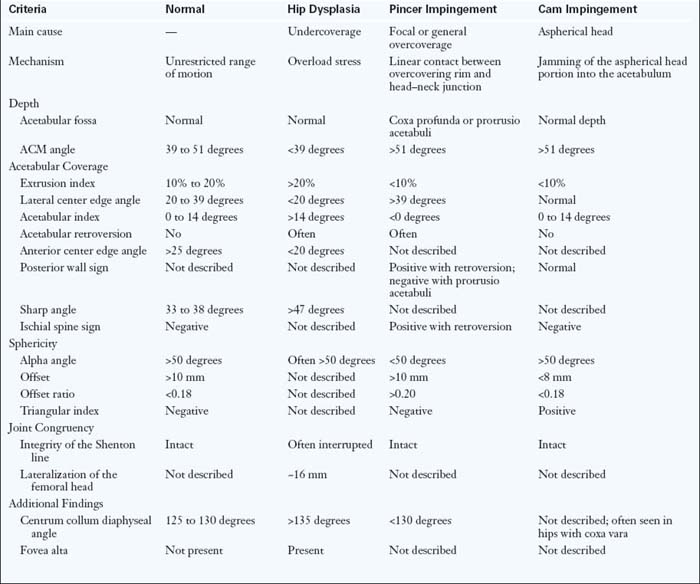
When evaluating conventional radiographs, the following features have to be evaluated: acetabular depth; acetabular coverage; the sphericity of the femoral head; joint incongruency; and additional findings (Table 3-1).
Acetabular Depth
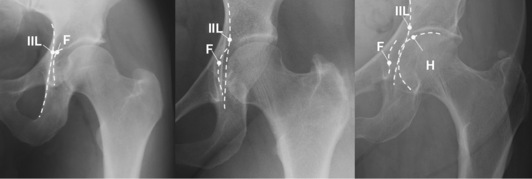
Acetabular depth is important to evaluate, because it is often correlated with an increased acetabular coverage that can lead to symptomatic pincer FAI. A normal depth is defined as the acetabular fossa being lateral to the ilioischial line (Figures 3-6, A, and 3-7, left; see Table 3-1). A coxa profunda is characterized as the acetabular fossa touching or crossing the ilioischial line (Figures 3-6, B, and 3-7, middle). In a protrusio acetabuli, which represents the deepest form of acetabular depth, the even femoral head crosses the ilioischial line (Figures 3-6, C, and 3-7, right). These joint configurations are primary pathologies and should not be mixed up with secondary acetabular protrusion in patients with end-stage osteoarthritis.
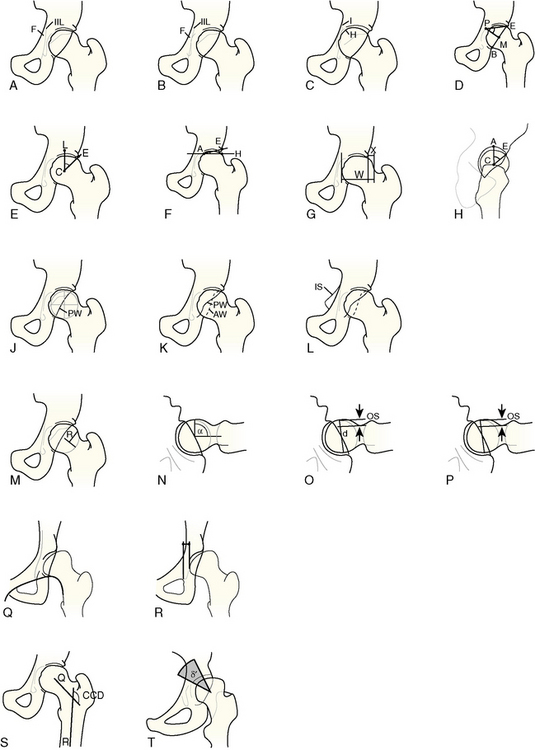
Care must be taken if an AP view of the hip (rather than the entire pelvis) is evaluated. Here, because of the particular x-ray beam centering, a false-positive coxa profunda can be created with a normal-appearing AP radiograph that is centered over the entire pelvis (see Figure 3-3). The only quantitative parameter that describes acetabular depth is the ACM angle (Figure 3-6, D; values given in Table 3-1). This view is rarely used in daily clinical practice.
Acetabular Coverage
Lateral coverage can be characterized by the lateral center edge (LCE) angle, the acetabular index, and the extrusion index (values given in Table 3-1). Normally, the LCE angle varies between 25 degrees, which defines a deficient acetabular coverage, and 39 degrees, which defines excessive coverage (Figure 3-6, E).
The acetabular index, which is also called the acetabular roof angle, is formed by a horizontal line and a line through the medial edge of the sclerotic zone and the lateral edge of the acetabulum (Figure 3-6, F). In patients with hips with coxa profunda or protrusio acetabuli, this index is typically 0 degrees, or it may even be negative (see Figures 3-6, C, and 3-7, B). The femoral head extrusion index is defined as the horizontal portion of the femoral head in a horizontal direction that is uncovered by the acetabulum (Figure 3-6, G). Although there is a maximum extrusion of 25%, which indicates dysplasia, no study has defined a minimum extrusion index.
Anterior coverage can be quantified on a false-profile view. The anterior center edge angle (Figure 3-6, H) is used for quantification. It is regarded as normal when it is more than 25 degrees, as borderline when it is between 20 and 25 degrees, and as pathological when it is less than 20 degrees.
The posterior acetabular rim is judged on the AP pelvic radiograph. A deficient posterior rim is present when its projected line runs medial to the femoral head center (i.e., posterior wall sign; Figure 3-6, J).
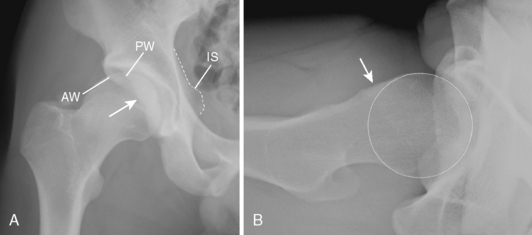
The relationship between anterior and posterior coverage is judged by carefully tracing the anterior and posterior acetabular rim on the AP pelvic radiograph. In a patient with normal hip morphology, the posterior rim typically lies laterally to the anterior rim. In addition, the posterior rim runs more vertically (see Figure 3-6, J). Sometimes, distinguishing between the two portions of the acetabular rim can be difficult. The posterior rim line can always be readily identified when starting from the inferior edge of the acetabulum. A too-prominent anterior acetabular rim is present when its projected line runs laterally to the posterior line in the cranial portion of the acetabulum, thus causing a “figure-of-8” sign (Figures 3-6, J, and 3-8, A). This relative anterior overcoverage can cause the pincer type of FAI, and it is occasionally seen in hips with DDH. Because it is assumed that the entire affected inferior hemipelvis is rotated, these “retroverted” hips usually show an ischial spine that protrudes into the true pelvis (i.e., ischial spine sign; Figure 3-6, K).
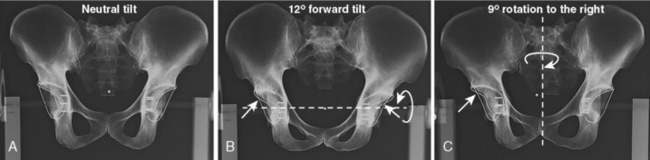
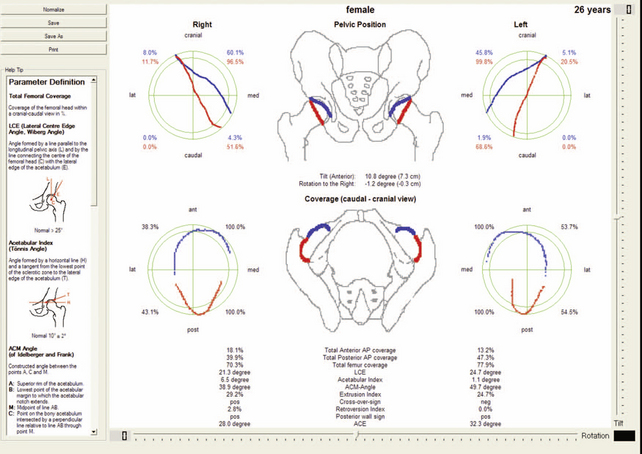
Care has to be taken with regard to the interpretation of the projected acetabular rim, because it strongly depends on the position of the pelvis on the x-ray table. An acetabular retroversion can be created by an increased pelvic tilt or rotation to the ipsilateral side of the patient (Figure 3-9). Similarly, other radiographic parameters (e.g., the LCE angle) can substantially change with different pelvic orientations (Figure 3-10). Neutral pelvic rotation around the longitudinal axis is a given when the tip of the coccyx points toward the middle of the symphysis. As an indicator of neutral pelvic tilt, the distance between the upper border of the symphysis and the middle of the sacrococcygeal joint should be 3.2 cm ± 1 cm for men and 4.7 cm ± 1 cm for women. To accurately determine the individual pelvic tilt of the patient, a strong lateral pelvic radiograph is very useful (Figure 3-11). A neutral pelvic tilt is defined by 60 degrees of pelvic inclination, which is determined by a horizontal line and a line that connects the symphysis with the sacral promontory (see Figure 3-11). Specific software called Hip2Norm is available to correct the individual acetabular morphology to a standardized neutral orientation (see Figure 3-11); this will allow for differences between anatomic and functional differences in acetabular pathomorphology. The further use of this software in clinical practice is currently being evaluated.
Sphericity of the Femoral Head
Lateral asphericity is also called the pistol grip deformity, and it can be quantified with the triangular index (see Figure 3-6, L; see Table 3-1). Therefore, on the femoral neck axis, half of the radius r of the femoral head is measured, and a perpendicular line is drawn. A new radius R is defined as the distance between the femoral head center and the intersection point of the perpendicular line with the superior femoral head–neck contour. It is considered to be pathological if R ≥ r + 2 mm (with an estimated magnification of 1.2).
Anterior asphericity is clinically relevant in end-range flexion and internal rotation because it can cause the cam type of FAI. It is invisible on an AP pelvic radiograph, and it can be better visualized on a lateral cross-table projection. Three parameters are measured for assessment: the alpha angle, the femoral offset, and the femoral offset ratio. The alpha angle is formed by the femoral neck axis and a line that connects the femoral head center with the point of beginning asphericity of the anterosuperior femoral head contour (Figure 3-6, M). An alpha angle that exceeds 50 degrees is an indicator of an abnormally shaped femoral head–neck contour. The anterior offset is defined as the difference in radius between the anterior femoral head and the anterior femoral neck (Figure 3-6, N). In asymptomatic hips, the anterior offset is 11.6 mm ± 0.7 mm; hips with cam impingement have a decreased anterior offset of 7.2 mm ± 0.7 mm. The offset ratio is defined as the ratio between the anterior offset and the diameter of the head (Figure 3-6, O). It is 0.21 ± 0.03 in asymptomatic patients and 0.13 ± 0.05 in patients with hips with relevant asphericity that causes the cam type of FAI.
Joint Incongruency
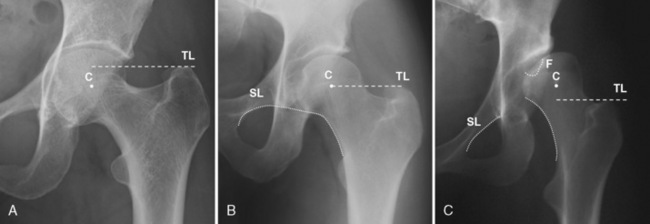
Joint congruency is difficult to assess, and it is more relevant in patients with DDH than in those with FAI. Because there are no parameters that describe the three-dimensional incongruency of the joint rotation centers, joint congruency can only be assessed indirectly by the degree of joint subluxation. Subluxation in the vertical direction can be objectified with the intactness of the Shenton line, which consists of the medial border of the femoral head and the superior border of the obturator foramen (see Figures 3-6, P, and 3-12, C). Subluxation of the femoral head in the horizontal direction can be measured as the shortest distance between the medial aspect of the femoral head and the ilioischial line (see Figure 3-6, Q).
Additional Findings
The centrum collum diaphyseal angle is different in patients with hips with dysplasia as compared with those with impingement (see Figure 3-6, R). Hips with the global pincer type of FAI (i.e., coxa profunda, protrusion acetabuli) often have a varus type of morphology (Figure 3-12, A). In these hips, the horizontal line through to the tip of the greater trochanter runs cranial to the center of the femoral head. In a normal hip, the horizontal line runs approximately through the joint center (Figure 3-12, B). Patients with DDH frequently present with a valgus configuration of the proximal femur (Figure 3-12, C), which is defined as when the horizontal trochanteric line lies inferior to the head center. Subsequently, the fovea capitis femoris lies more cranial than it does in the normal hip morphology (see Figure 3-12, C). This so-called fovea alta can further reduce the weight-bearing zone between cartilaginous joint surfaces, thus causing the condition to worsen and leading to the early degeneration of the joint.
Overview of radiographic parameters
Table 3-2 gives an overview of the described characteristic individual radiographic parameters for hips with a normal configuration, DDH, and the two types of FAIs (i.e., cam and pincer). Each hip is unique, and allocation to one of the pathologies will be difficult, because there is often a mixture of pathomorphologies that may even lead to segmental undercoverage and overcoverage in the same hip. For example, a hip with a lateral undercoverage can present with an acetabular retroversion that indicates a relative anterior overcoverage (Figure 3-13).
Secondary changes of early hip osteoarthritis
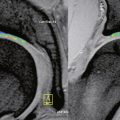
Repetitive irritation in unrecognized FAI leads to reactive ossification of the labral basis (Figure 3-14, A); this can be seen as a double contour of one of the projected acetabular rims. Typically, it is well visible on the superolateral edge of the acetabulum, because the x-ray beams hit the labrum tangentially. Although significant and irreversible damage of the cartilage may already be present, there is no joint space narrowing, because only the quality of the cartilage—not its diameter—is impaired during the early stage of the disease. Classic radiographic signs of osteoarthritis only occur late; these indicate an already advanced joint degeneration, which is a relative contraindication for joint-preserving surgery.
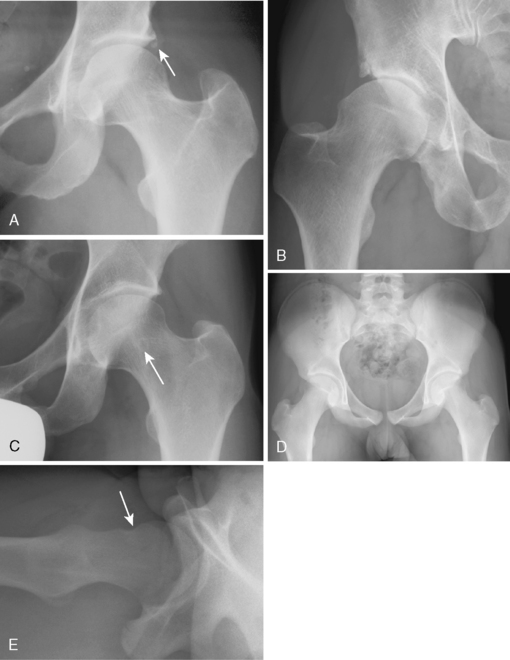
The recurrent abutment against the acetabular rim by the aspherical portion of the femoral head can cause stress fractures of the acetabulum (Figure 3-14, B), especially in substantial retroverted acetabula. Because the initial judgment of the hip on an AP pelvic radiograph may appear to be normal at first sight, this damage pattern can eventually be misinterpreted as incidental os acetabuli. However, the presence of a radiodense structure at the edge of the acetabular roof must raise the suspicion of FAI.
Hips with FAI have a higher prevalence of herniation pits (Figure 3-14, C), which are initially thought to be benign. These present as radiolucencies that are surrounded by sclerotic margins and typically located in the anterosuperior quadrant of the femoral neck. They are thought to be intraosseous ganglia at the femoral zone of FAI. Therefore, hips with these juxta-articular cysts should be considered to be at risk for FAI. However, herniation pits are not always associated with symptomatic impingement.
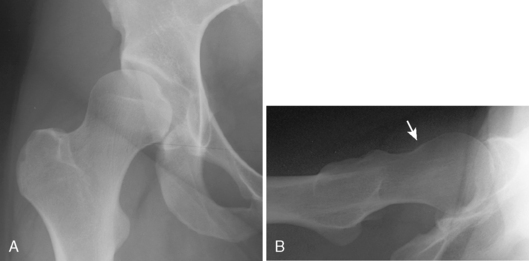
Hips with the pincer type of FAI can present with an indentation on the lateral cross-table radiograph (Figure 3-14, D and E). This is the result of the recurrent linear contact between the excessive acetabular rim and the femoral head–neck junction.
Davies A.M., Johnson K., Whitehouse R.W. Imaging of the hip and the bony pelvis. New York: Springer, 2006.
Ganz R., Parvizi J., Beck M., Leunig M., Nötzli H., Siebenrock K.A. Femoroacetabular impingement: a cause for osteoarthritis of the hip. Clin Orthop Relat Res. (417); 2003:112-120.. Dec
Murphy S.B., Ganz R., Müller M.E. The prognosis of untreated dysplasia of the hip. A study of radiographic factors that predict the outcome. J Bone Joint Surg.. 1995;77A(7):985-989.
Tannast M., Siebenrock K.A., Anderson S.E. Femoroacetabular impingement: radiographic diagnosis—what the radiologist should know. AJR Am J Roentgenol.. 2007;188(6):1540-1552. Jun