74 Imaging of the Central Nervous System
 Key Points
• The emergency physician needs to be able to accurately interpret and act on certain findings on computed tomography (CT) because many disease processes require immediate action.
• Even with a brief educational intervention, emergency physicians can significantly improve their ability to interpret cranial CT scans.
• Use the mnemonic “blood can be very bad” (where blood = blood, can = cisterns, be = brain, very = ventricles, and bad = bone) to quickly and thoroughly review a cranial CT scan for pathology.
• Magnetic resonance imaging offers excellent anatomic resolution and provides greater discrimination of various soft tissues than CT does.
Perspective
Imaging of the central nervous system (CNS) has assumed a critical role in the practice of emergency medicine for the evaluation of intracranial emergencies, both traumatic and atraumatic. A number of studies have revealed a deficiency in the ability of emergency physicians (EPs) to interpret head computed tomography (CT) scans.1–6 However, a number of these same studies also show that with even brief educational effort, EPs can gain considerable proficiency in cranial CT scan interpretation.2,3 This is important because in many situations the EP must interpret and act on head CT results in real time without assistance from other specialists such as neurologists, radiologists, or neuroradiologists.7,8 Advantages of using these technologies for diagnosing CNS pathology in the emergency department (ED) include widespread availability at many institutions, speed of imaging, patient accessibility, and sensitivity in detecting many emergency pathologic processes.
Computed Tomography
Attenuation Coefficient
The tissue contained within each image unit (called a pixel) absorbs a certain proportion of the x-rays that pass through it (e.g., bone absorbs a lot, air almost none). The ability to block x-rays as they pass through a substance is known as attenuation. For a given body tissue, the amount of attenuation is relatively constant and is known as that tissue’s attenuation coefficient. In CT, these attenuation coefficients are mapped to an arbitrary scale of between −1000 Hounsfield units (HU) (air) and +1000 HU (bone) (Box 74.1). This scale is the Hounsfield scale (in honor of Sir Jeffrey Hounsfield, who received a Nobel Prize for his pioneering work with this technology).
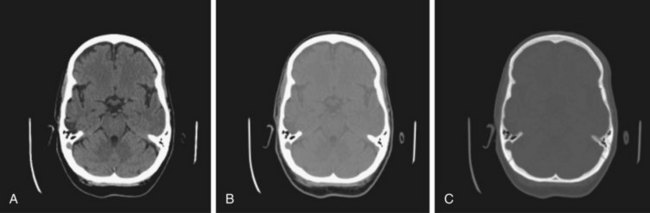
Windowing
Windowing allows the CT scan reader to focus on certain tissues within a CT scan that fall within set parameters. Tissues of interest can be assigned the full range of blacks and whites rather than a narrow portion of the gray scale. With this technique, subtle differences in tissue densities can be maximized. The image displayed depends on both centering of the viewing window and the width of the window. Most CT imaging includes windows that are optimized for brain, blood, and bone (Fig. 74.1).
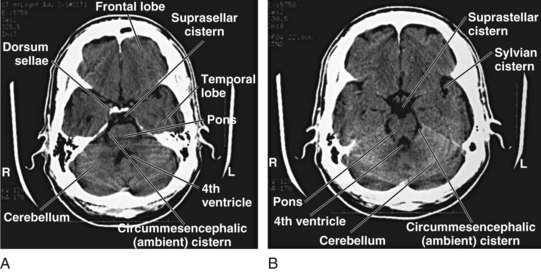
Normal Neuroanatomy As Seen On Head Computed Tomography
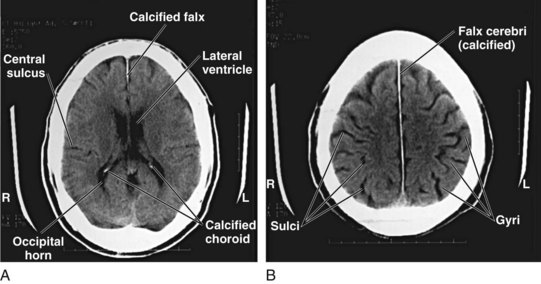
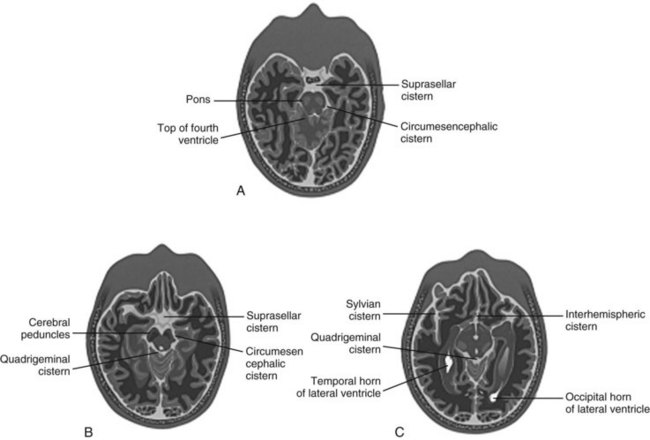
Although detailed knowledge of cranial neuroanatomy and its CT appearance is clearly in the realm of the neuroradiologist, familiarity with a relatively few structures, regions, and expected findings allows sufficient interpretation of most head CT scans by the EP. Figures 74.2 through 74.5 demonstrate key structures of a normal head CT scan.

Identifying Central Nervous System Pathology On Cranial Computed Tomography
As long as one is systematic in the search for pathology, any number of techniques can be used when reviewing head CT images. Some recommend a “center-out” technique in which the examiner starts from the middle of the brain and works outward. Others advocate a “problem-oriented” approach in which the clinical history directs the examiner to a particular portion of the scan. In the author’s experience, both these approaches are of limited utility to clinicians who do not frequently review scans. A preferred method, one that has been demonstrated to work in the ED, is to use the mnemonic “blood can be very bad” (Box 74.2).2 In this mnemonic, the first letter of each word prompts the clinician to search a certain portion of the CT scan for pathology.
Box 74.2 The “Blood Can Be Very Bad” Mnemonic*
Blood—Acute hemorrhage appears hyperdense (bright white) on computed tomography. The globin molecule is relatively dense and effectively absorbs x-ray beams. As the blood ages, the globin molecule breaks down and loses its hyperdense appearance, beginning at the periphery. Precise localization of the blood is as important as identification of its presence.
Cisterns—Cerebrospinal fluid collections in the brain. The four key cisterns must be examined for blood, asymmetry, and effacement (representing increased intracranial pressure):
Ventricles—Pathologic processes cause dilation (hydrocephalus) or compression or shifting; hydrocephalus is usually first evident with dilation of the temporal horns (normally small and slitlike); the examiner must assess the “whole picture” to determine whether the ventricles are enlarged because of lack of brain tissue or increased cerebrospinal fluid pressure.
Bone—Highest density on computed tomography; diagnosis of skull fractures can be confusing because of the presence of sutures in the skull; compare with the other side of the skull for symmetry (suture) versus asymmetry (fracture); basilar skull fractures are commonly found in the petrous ridge (look for blood in the mastoid air cells)
Blood
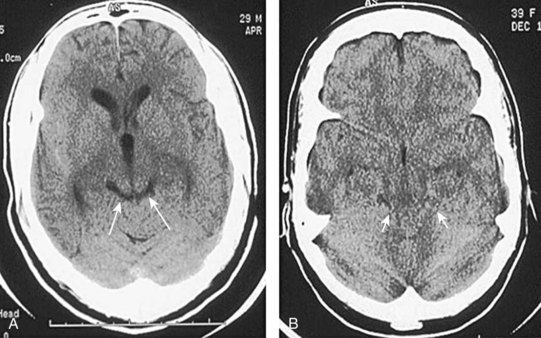
The appearance of blood on a head CT scan depends primarily on its location and amount. Acute hemorrhage will appear hyperdense (bright white) on cranial CT images. This is attributed to the fact that the globin molecule is relatively dense and hence effectively absorbs x-ray beams. Acute blood is typically in the range of 50 to 100 HU. As the blood becomes older and the globin molecule breaks down, it will lose this hyperdense appearance, beginning at the periphery and working in centrally. On CT scans, blood will become isodense relative to brain tissue at 1 to 2 weeks, depending on clot size, and will become hypodense relative to brain tissue at approximately 2 to 3 weeks (Fig. 74.6).
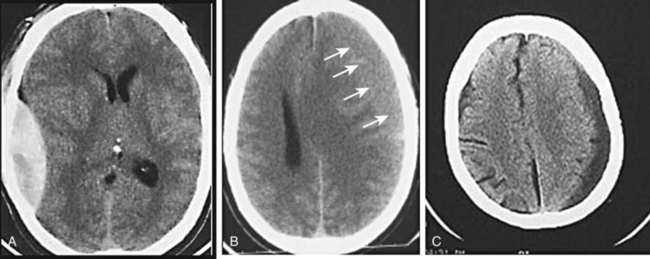
Fig. 74.6 CT scan appearance of central nervous system hemorrhage.
A, Acute. B, Subacute; arrows identify subtle brain-blood interface. C, Chronic.
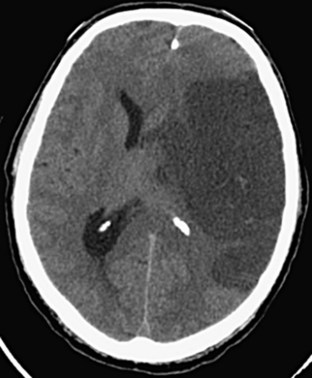
Precise localization of the blood is as important as identification of its presence (Fig. 74.7). Epidural hematomas, subdural hematomas, intraparenchymal hemorrhage, and subarachnoid hemorrhage each have a distinct appearance on CT, as well as different causes, complications, and associated conditions.
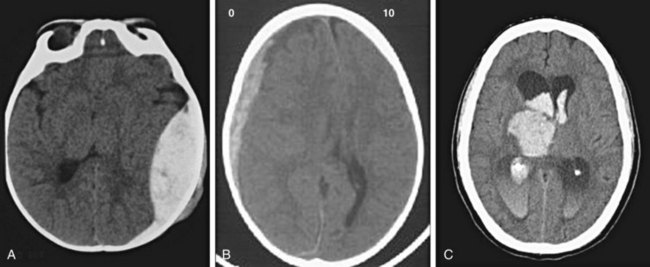
Fig. 74.7 CT appearance of blood in patients with hematoma.
A, Epidural hematoma. B, Subdural hematoma. C, Intraparenchymal and intraventricular hematomas.
Subarachnoid Hemorrhage
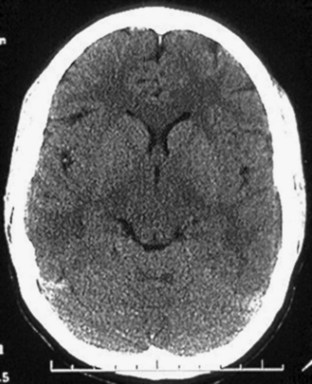
Subarachnoid hemorrhage is defined as hemorrhage into any subarachnoid space that is normally filled with CSF (e.g., cistern, brain convexity). The hyperdensity of blood in the subarachnoid space is frequently visible on CT imaging within minutes of the onset of hemorrhage (Fig. 74.8). Subarachnoid hemorrhage is most commonly aneurysmal (75% to 80%), but it can also occur with trauma, tumor, arteriovenous malformations, and dural malformations. As a result of arachnoid granulations becoming plugged with red blood cells or their degradation products, hydrocephalus complicates approximately 20% of cases of subarachnoid hemorrhage.
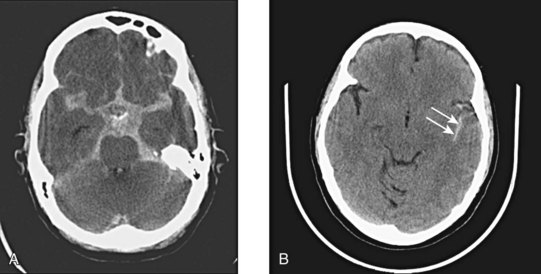
Fig. 74.8 CT appearance of subarachnoid hemorrhage.
A, Blood filling the suprasellar cistern. B, Blood filling the sylvian cistern (arrows).
The ability of a CT scanner to demonstrate subarachnoid hemorrhage depends on a number of factors, including the generation of scanner, the time since the initial bleeding, and the skill of the examiner. According to some studies, CT is 95% to 98% sensitive for subarachnoid hemorrhage in the first 12 hours after the ictus.9–11 This sensitivity is reported to decrease as follows:
Cisterns
Cisterns are potential spaces that form where CSF pools as it works its way up to the superior sagittal sinus from the fourth ventricle. Of the numerous named cisterns (and some with multiple names), the EP needs to be familiar with four key cisterns to identify increased intracranial pressure, as well as the presence of blood in the subarachnoid space (Fig. 74.9). These cisterns are as follows:
• Circummesencephalic—Hypodense CSF ring around the midbrain; most sensitive marker for increased intracranial pressure; will become effaced first with increased pressure and herniation syndromes
• Suprasellar—Star-shaped hypodense space above the sella and pituitary; location of the circle of Willis and hence an excellent location for identifying aneurysmal subarachnoid hemorrhage
• Quadrigeminal—W-shaped cistern at the top of the midbrain; can be a location for identifying traumatic subarachnoid hemorrhage, as well as an early marker of increased intracranial pressure and rostrocaudal herniation (Fig. 74.10)
• Sylvian—Bilateral CSF space located between the temporal and frontal lobes of the brain; another good location to identify subarachnoid hemorrhage, whether caused by trauma or aneurysmal leakage (particularly distal middle cerebral artery aneurysms)
Brain
Normal brain parenchyma has an inhomogeneous appearance where the gray and white matter interface. Because cortical gray matter is denser than subcortical white matter, the cortex will appear lighter on CT imaging. Many disease processes are unilateral (e.g., cerebrovascular aneurysm, tumor, abscess), and thus particular attention should be paid to side-to-side symmetry on the scan. Gyral and sulcal patterns should be symmetric (Fig. 74.11). It is also important to examine the brain parenchyma for the following:
• Gray-white differentiation—The earliest sign of an ischemic cerebrovascular aneurysm will be loss of gray-white differentiation. Tumors can also obscure this interface, particularly when associated edema is present (hypodensity).
• Shift—The falx should be midline and the ventricles evenly spaced to the sides. With rostrocaudal herniation the midline will be preserved, but this will usually be evidenced by loss of cisternal spaces. Unilateral effacement of the sulci signals increased pressure in one compartment. Bilateral effacement signals globally increased pressure.
• Hyperdensity/hypodensity—Brain will take on increased density with blood, calcification, and intravenous contrast media. It will take on decreased density with air (pneumocephalus), water, fat, and ischemia (cerebrovascular accident). Tumor may result in either increased or decreased density on CT imaging, depending on the type of tumor and amount of edema.
Specific Brain Parencymal Lesions
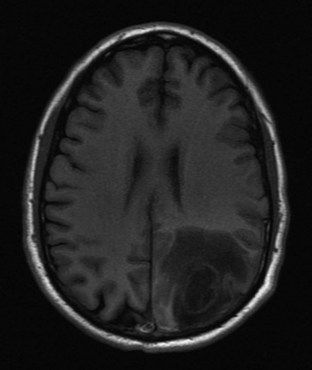
Tumor
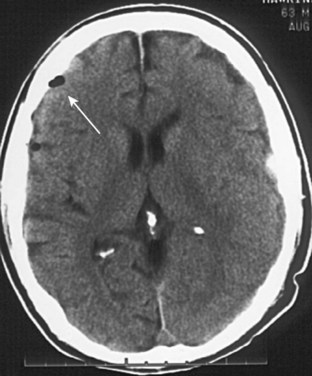
Brain tumors usually appear as hypodense, poorly defined lesions on non–contrast-enhanced CT. It is estimated that 70% to 80% of brain tumors will be apparent on plain scans without the use of an intravenous contrast agent. The calcification and hemorrhage associated with a tumor can cause it to have a hyperdense appearance. Tumors should be suspected on a non–contrast-enhanced CT scan when significant edema is associated with an ill-defined mass. This vasogenic edema is due to loss of integrity of the blood-brain barrier, which allows fluid to pass into the extracellular space. Edema, because of the increased water content, appears hypodense on CT (Fig. 74.12).
Ischemic Infarction
Strokes are classified as either hemorrhagic or nonhemorrhagic. Nonhemorrhagic infarctions can be seen as early as 2 to 3 hours following ictus, but most will not begin to be clearly evident on CT scans for 12 to 24 hours. The earliest change seen in areas of ischemia is loss of gray-white differentiation as a result of influx of water into the gray matter. Because gray matter is metabolically more active than white matter, the gray cells are affected first, become edematous, and take on the CT appearance of white matter. This loss of gray-white differentiation may initially be a subtle finding but will become more pronounced, with peak findings becoming evident between 3 and 5 days (Fig. 74.13).
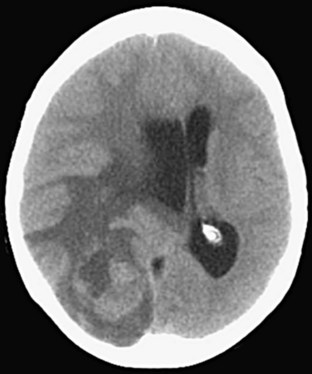
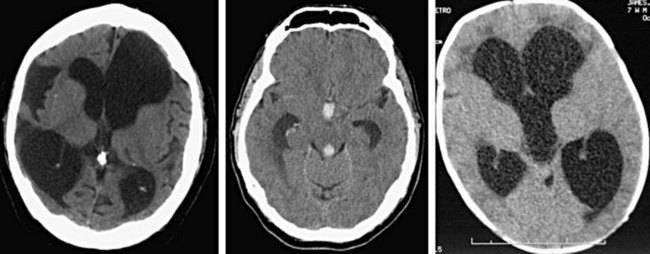
Ventricles
Pathologic processes can cause either dilation (hydrocephalus) or compression or shifting of the ventricular system (Fig. 74.14). Additionally, hemorrhage can occur into any of the ventricles and result in the potential for obstruction of flow and subsequent hydrocephalus. The term communicating hydrocephalus is used when CSF freely egresses from the ventricular system with blockage at the level of the arachnoid granulations. The term noncommunicating hydrocephalus is used if obstruction occurs anywhere along the course of flow from the lateral ventricles through egress from the fourth ventricle. Hydrocephalus is frequently first evident with dilation of the temporal horns, which are normally small with a slitlike morphology.
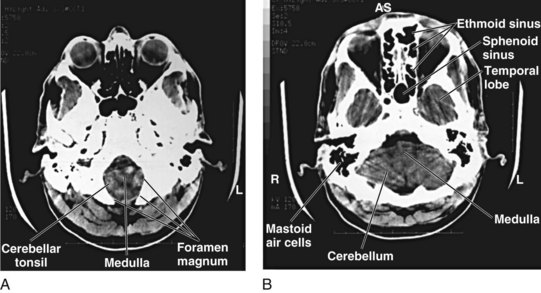
Bone
As demonstrated earlier, bone has the highest density on CT (+1000 HU). Consequently, depressed or comminuted skull fractures can usually be easily identified on CT; however, small linear (nondepressed) skull fractures and fractures of the skull base may be more difficult to find (Fig. 74.15). Additionally, diagnosing fractures can be confusing because of the presence of sutures in the skull.
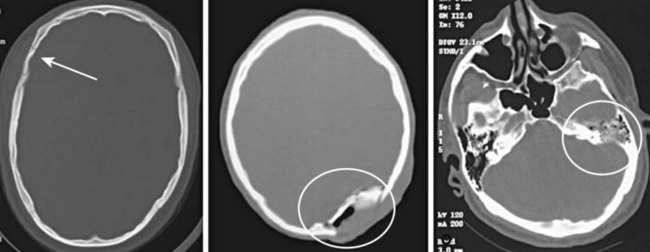
Fractures may occur at any portion of the skull. The presence of a fracture should increase the index of suspicion for other intracranial injury. If intracranial air is seen on CT, this indicates that the skull and dura have been violated at some point (Fig. 74.16). Basilar skull fractures are most commonly found in the petrous ridge (the dense pyramidal-shaped portion of the temporal bone). Because of the density of this bone, the fracture line may not be easily identified in this area. The clinician should not only search for such a fracture line but also pay close attention to the normally aerated mastoid air cells that are contained within this bone. Any blood in the mastoid air cells means that a skull base fracture is likely. Analogous to the mastoid air cells, the maxillary, ethmoid, and sphenoid sinuses should be visible and aerated; the presence of fluid in any of these sinuses in the setting of trauma should also raise suspicion for a skull fracture. In nontraumatic cases, fluid in the mastoids may indicate mastoiditis, and fluid in the sinuses may indicate sinusitis.
Magnetic Resonance Imaging
Basic Principles
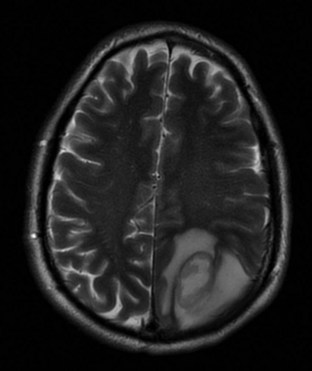
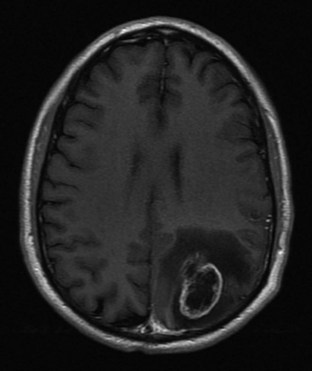
Although many MRI techniques exist, the two basic types of imaging sequences are T1 and T2. T1 and T2 images demonstrate the local tissue relaxation time that follows a radiowave pulse and thus reflect the three-dimensional molecular environment that surrounds each proton. For example, brain tissue contains intracellularly bound water and has shorter T1 and T2 times than do tissues with larger amounts of extracellular water, such as most neoplasms. (Figs. 74.17 and 74.18). T1 is a measure of the proton’s ability to exchange energy with its surroundings. In other words, T1 is a measure of how quickly the tissue can become magnetized. T1-weighted images show fat as a white or bright signal, whereas water or CSF is dark. T2 measures how quickly tissue looses magnetization. On a T2-weighted image, fat is dark, and blood, edema, and CSF appear white. Contrast dye such as gadolinium may also be used to enhance organs and accentuate pathology by shortening the T1 and T2 relaxation times of the hydrogen nuclei (Fig. 74.19).
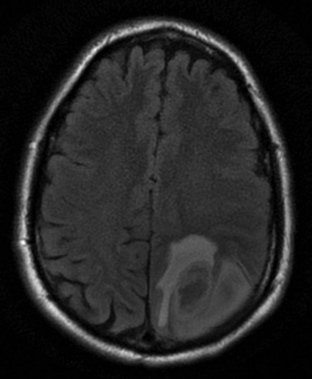
Other commonly used radio wave pulse sequences include STIR (short time of inversion recovery) and FLAIR (fluid-attenuated inversion recovery). STIR sequencing is used to emphasize differences in T1 images and accentuate tissue with high water content while suppressing fat signal. STIR images are especially useful in spinal and joint imaging. For example, suppressed signal from bone marrow and surrounding fat allows bone tumors to be visualized more clearly. The FLAIR technique suppresses the T1 signals generated by fluid to better identify adjacent tissue abnormalities (Fig. 74.20). FLAIR is useful for differentiating periventricular and spinal cord edema from CSF. The signal from CSF is nulled and appears darker in water-suppressed images.
1 Schreiger DL, Kalafut M, Starkman S, et al. Cranial computed tomography interpretation in acute stroke. JAMA. 1998;279:1293–1297.
2 Perron AD, Huff JS, Ullrich CG, et al. A multicenter study to improve emergency medicine residents’ recognition of intracranial emergencies on computed tomography. Ann Emerg Med. 1998;32:554–562.
3 Leavitt MA, Dawkins R, Williams V, et al. Abbreviated educational session improves cranial computed tomography scan interpretations by EPs. Ann Emerg Med. 1997;30:616–621.
4 Alfaro DA, Levitt MA, English DK, et al. Accuracy of interpretation of cranial computed tomography in an emergency medicine residency program. Ann Emerg Med. 1995;25:169–174.
5 Roszler MH, McCarroll KA, Donovan RT, et al. Resident interpretation of emergency computed tomographic scans. Invest Radiol. 1991;26:374–376.
6 Arendts G, Manovel A, Chai A. Cranial CT interpretation by senior emergency departments staff. Australas Radiol. 2003;47:368–374.
7 Saketkhoo DD, Bhargavan M, Sunshine JH, et al. Emergency department image interpretation services at private community hospitals. Radiology. 2004;231:190–197.
8 Lowe RA, Abbuhl SB, Baumritter A, et al. Radiology services in emergency medicine residency programs: a national survey. Acad Emerg Med. 2002;9:587–594.
9 Boesiger BM, Shiber JR. Subarachnoid hemorrhage diagnosis by computed tomography and lumbar puncture: are fifth generation CT scanners better at identifying subarachnoid hemorrhage? J Emerg Med. 2005;29:23–27.
10 Van der Wee N, Rinkel GJE, van Gijn J. Detection of subarachnoid hemorrhage on early CT: is lumbar puncture still needed after a negative scan? J Neurol Neurosurg Psychiatry. 1995;58:357–359.
11 Morgenstern LB. Worst headache and subarachnoid hemorrhage: prospective, modern computed tomography and spinal fluid analysis. Ann Emerg Med. 1998;32:297–304.