[level-membership-for-orthopaedics-category]
16 Imaging of the Aging Spine
KEY POINTS
Imaging of Degenerative Spine Disease
Intervertebral Disc Degeneration
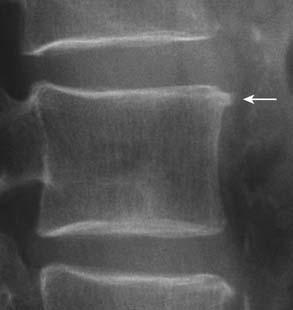
On radiography (Figure 16-1), intervertebral disc degeneration is indirectly inferred from loss of the normal disc space height. Gas may be seen in the disc space, due to a negative pressure within the degenerative disc causing extraction of nitrogen from extracellular space. This is commonly referred to as vacuum phenomenon. The vacuum phenomenon can be accentuated during extension of the spine and reduced during flexion. Vertebral endplate irregularity is often seen, with or without associated sclerotic changes at the endplates.
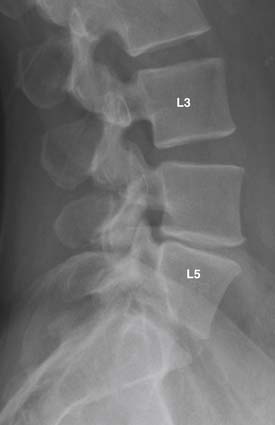
FIGURE 16-1 Radiographic features of degenerative disc disease.
Disc space narrowing and subtle cartilaginous endplate sclerosis are present at L4-L5.
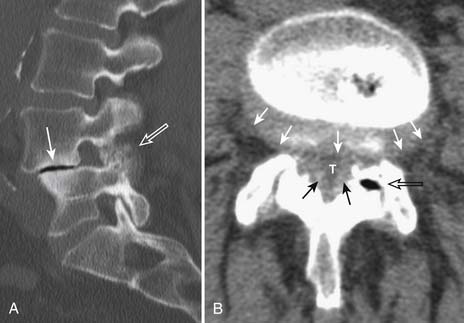
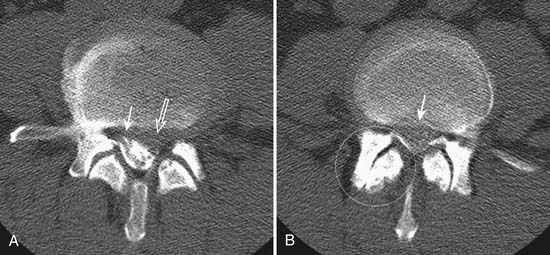
With the wide availability of MRI, CT is rarely requested for the primary evaluation of degenerative disc disease, except in patients with contraindications for MRI examination. Similar to radiography, CT can demonstrate disc space loss, endplate irregularity or sclerotic changes, and vacuum phenomenon. However, CT also allows direct visualization of disc bulging and disc herniation (Figure 16-2), although with a lesser soft tissue contrast compared to MRI. When more accurate depiction of disc bulging and disc herniation is required, CT myelography can be performed (Figure 16-3) .
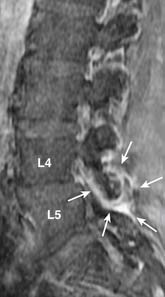
MRI provides the best soft tissue details of degenerative disc disease. In young healthy patients, the intervertebral discs demonstrate hyperintensity on T2-weighted images. With aging, there is loss of this hyperintensity due to a decrease of water content and changes in proteoglycan composition (Figure 16-4). There is decreased disc height and the endplates may become irregular. Gas from vacuum phenomenon may fill the space of a degenerative disc, which may demonstrate hypointensity on both T1- and T2-weighted images. Alternatively, the space may be filled with fluid, which is seen as hyperintensity on T2-weighted images. A degenerative disc may also calcify, which can give hypointensity or hyperintensity on T1-weighted images, depending on the type and concentration of calcification. A degenerative disc may also enhance secondary to the presence of granulation tissues.
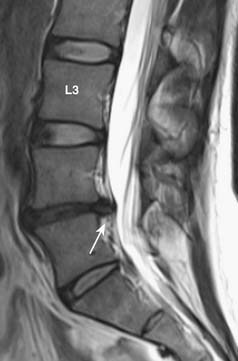
FIGURE 16-4 Disc degeneration seen on MRI (T2-weighted image) (same patient as Figure 16-1). There is disc space narrowing and loss of the normal T2 hyperintensity of the L4-L5 disc. Bulging of the disc with a small protrusion into the spinal canal is also shown (arrow). Compare the L4-L5 disc with the normal appearance of the discs at L2-L3 and L3-L4 levels.
Fissures of the annulus fibrosus may be seen in the intervertebral discs. On MRI, annular disruptions (also referred as fissures) may be seen as a small high intensity zone within the outer annulus (Figure 16-5) .
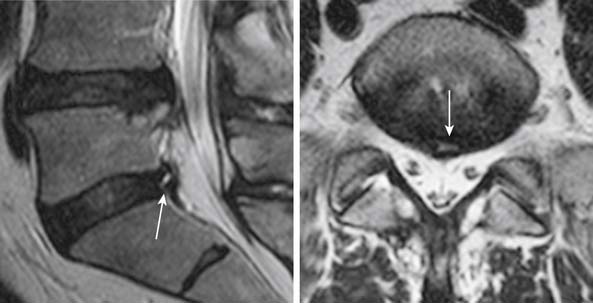
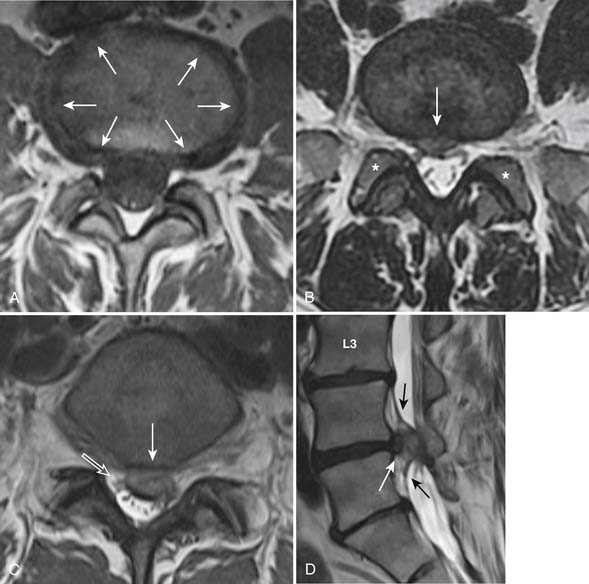
One of the primary advantages of MRI is the direct visualization of disc bulging or herniation, and its associated mass effect on the nervous structures. At a particular disc level, a disc can have bulging and one or more areas of herniation seen on the same occasion. In 2001, multiple societies reached a consensus to standardize the nomenclature and classification of disc pathology.1 This work is currently being revised (A. Williams, S. Rothman, R. Murtagh, G. Sze, in progress). The consensus was initially developed for lumbar disc disease but is generalized to disc disease in the rest of the spine. Normal disc space is defined craniocaudally by the vertebral body endplates, and circumferentially by the ring apophysis of the vertebral bodies. In the newly revised consensus, a disc bulge refers to diffuse displacement of disc material beyond the normal disc space, and covers greater than 25% of the normal disc space circumference (i.e, greater than 90 degrees of the circumference) (Figure 16-6, A) . Disc displacement covering 25% or less of the circumference is called herniation. When the width of the base of the disc herniation is greater than any other measurements in the same plane of the herniation, it is called a protrusion (Figure 16-6, B). When any of the measurements of the herniation is greater than the width at its base, the herniation is described as an extrusion (Figure 16-6, C and D). In essence, a protrusion is a disc herniation with a wide base, whereas an extrusion is a narrow-based disc herniation with appearance sometimes resembling toothpaste that is squeezed out of its container. Migration refers to herniated disc material that is displaced above or below the level of the disc. When the disc extrusion is separated from the parent disc, it is referred to as a sequestration. Sequestered disc often demonstrates T2 hyperintensity compared to its disc of origin. This may be secondary to the presence of granulation tissue, immune response, or inflammation.2 Most disc sequestrations are seen in the epidural space, but rarely, they may migrate into the intradural space or posterior to the thecal sac. Herniated disc may be contained by the annulus fibrosus (subannular) or the posterior longitudinal ligament (subligamentous) (Figure 16-6, D), although the distinction sometimes can be difficult.
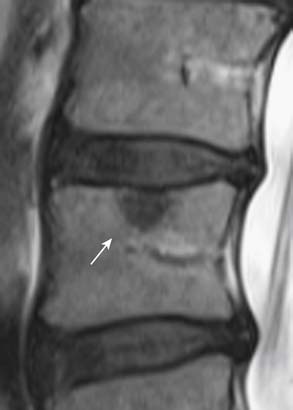
Disc material can also herniate through the vertebral cartilaginous endplates into the adjacent vertebral bone marrow. Intravertebral (intraosseous) herniation is often called Schmorl’s node (Figure 16-7) and has been reported in 38% to 75% of the population. Most of these are seen as incidental findings.
Vertebral Marrow Changes and Osteophyte Formation
Disc degeneration often leads to changes of the bone marrow adjacent to the cartilaginous endplates bordering the disc. MRI can demonstrate three patterns of bone marrow signal changes that have been classified by Modic et al3 (Figure 16-8) . The vertebral marrow changes can convert from one type to another with time. In many patients, the vertebral marrow changes actually appear in a mixed pattern. The clinical and pathophysiological significance of vertebral marrow changes have been subject to debate. Some reports have suggested that type I change is likely to be inflammatory in origin and is more strongly associated with active low back symptoms and segmental instability.4 It has also been suggested that patients with type I marrow changes respond better to fusion compared to those without or with other types of endplate changes, and that persistence of type I marrow changes after fusion is associated with a worse outcome.5
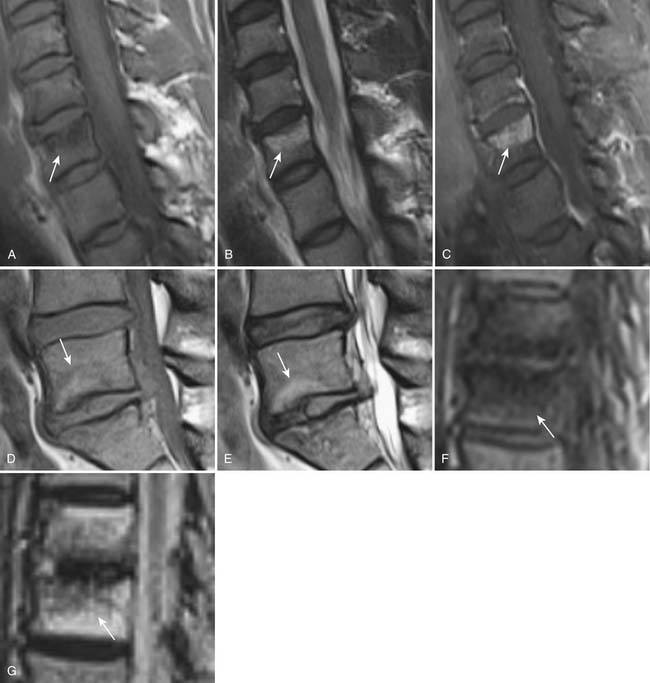
FIGURE 16-8 Degenerative vertebral endplate changes (arrows) as classified by Modic et al3 Type I marrow change demonstrates T1 hypointensity,(A) T2 hyperintensity (B) and enhances with gadolinium. (C) It represents replacement of normal hematopoietic marrow by fibrovascular tissue. Type II marrow change demonstrates hyperintensity on both T1- (D) and T2-weighted (E) images. It is secondary to conversion of hematopoietic marrow to fatty marrow. Type III change demonstrates hypointensity on both T1- (F) and T2-weighted (G) images. It represents replacement of hematopoietic marrow by sclerosis. There is no abnormal enhancement associated with type II or type III changes (not shown).
Facet Arthropathy
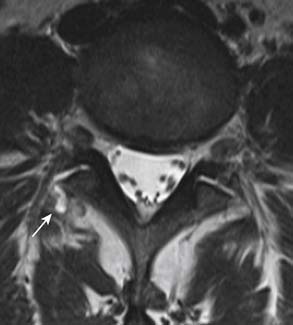
Degenerative changes of the facet joints in the spine resemble that of other synovial joints in the rest of the body. Although radiography can demonstrate the bone changes associated with osteoarthritis, including joint space narrowing as a result of thinning of articular cartilage, subchondral sclerosis, marginal osteophyte formation, facet hypertrophy, and hyperostosis, these findings are best demonstrated on CT (see Figures 16-2 and 16-3). Very often, gas from vacuum phenomenon can also be seen on radiography or CT. MRI does not provide as much bony detail, but facet hypertrophy is easily demonstrated (see Figure 16-6, B). In addition, MRI may demonstrate joint space effusion and inflammatory changes (synovitis) that can be associated with osteoarthritis (Figure 16-9). Synovitis is best demonstrated on fat-suppressed T2-weighted or postgadolinium MRI sequences.
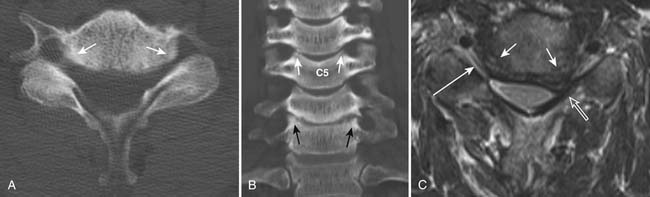
The uncovertebral joints associated with the lower five cervical vertebral bodies are also commonly associated with arthropathic changes. The uncinate process may undergo hypertrophy and spur formation that can project into the neural foramina and spinal canal, leading to narrowing of the neuroforamina and spinal canal stenosis (Figure 16-10) .
Juxta-articular cysts are often seen associated with facet arthropathy. They include synovial and ganglion cysts. Compared to synovial cysts, ganglion cysts do not have synovial lining and do not communicate with the joint space. However, on imaging, it is difficult to make the distinction and they are often simply referred to as juxta-articular cysts. The cysts are usually located in the posterolateral epidural space of the spinal canal. Occasionally, they may be completely outside of the spinal canal (Figure 16-11). They can calcify and sometimes can be confused with other pathological entities such as a disc herniation or a mass. However, the recognition of continuity of a lesion with adjacent degenerative facet joint should strongly suggest the diagnosis. On MRI, their signal intensity is variable and depends on whether they contain proteinaceous material or hemorrhage. Gas may be present in synovial cysts, as they communicate with facet joints that may contain gas from vacuum phenomenon. The cyst walls may contain hemorrhage or calcification. There may be contrast enhancement in the cyst wall or surrounding soft tissues if inflammatory response is present.
Spondylolisthesis and Segmental Instability of the Spine
Spondylolisthesis, scoliosis, and segmental instability can result from degeneration of the stabilizing structures in the spine, including intervertebral discs, vertebral bodies, facet joints, joint capsules, and ligaments (see Figure 16-2). It is important to exclude other underlying pathologies, such as defect of the pars interarticularis or fracture. This consideration is particularly important when the anterolisthesis is greater than grade 1 (25% of the vertebral body diameter), or the degenerative changes are disproportionately mild to account for the high grade spondylolisthesis. Pars interarticularis defect can be detected using oblique radiography or CT. For occult pars defect or occult fracture, a nuclear bone scan may aid in their detection.
Segmental instability of the spine can be seen as spine deformity or spondylolisthesis that increases with spine motion and progresses over time. Standing radiography that includes anteroposterior and lateral projections with flexion and extension of the spine provides the most easily available imaging tool for evaluation of spine instability.6
There are currently no standardized methods or criteria for diagnosis of spine instability.7 However, values of 10 degrees for sagittal rotation and 4 mm for sagittal translation have been used to infer instability in some studies.6 Sagittal rotation is measured as the variation of angle between two opposite vertebral endplates observed during flexion and extension on lateral projection, and sagittal translation is measured as the variation of distance between the lines that follow the posterior cortices of two adjacent vertebrae. To minimize the effect of radiographic magnification, the absolute distance can be given as a percentage of the anteroposterior width of the superior vertebra.
Radiography can also demonstrate other indirect signs of instability, such as vacuum phenomenon and traction osteophytes. Traction osteophytes appear as horizontal osteophytes that arise typically on adjacent vertebral bodies below the rims of the endplate, approximately 2 to 3 mm from the edge of the intervertebral disc8 (Figure 16-12) .
Spinal Stenosis
Spinal canal stenosis and foraminal stenosis are common consequences of degenerative disease of the spine. Patients with congenital anomalies, such as short pedicles, are particularly at risk of developing spinal stenosis. Spinal stenosis is best evaluated with MRI because of its ability to assess both bony and soft tissue structures that can narrow the spinal canal or neural foramina (Figures 16-13 and 16-14). Direct impingement on the spinal cord or nerve roots can be easily seen on MRI. Disc bulging, disc herniation, degenerative changes of the facet and uncovertebral joints, thickening of the ligamentum flavum, epidural lipomatosis and spondylolisthesis can all lead to narrowing of the spinal canal and neural foramina. Although sagittal images can provide a general overview of spinal canal stenosis, axial images are essential for an accurate assessment of the degree of stenosis.
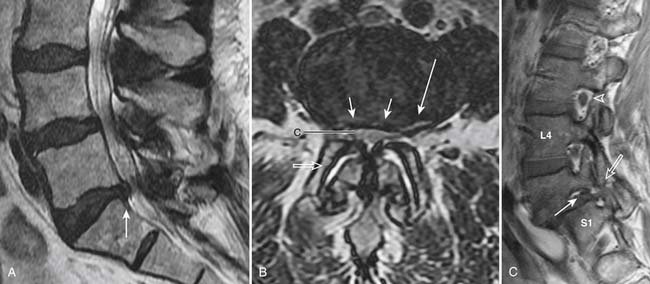
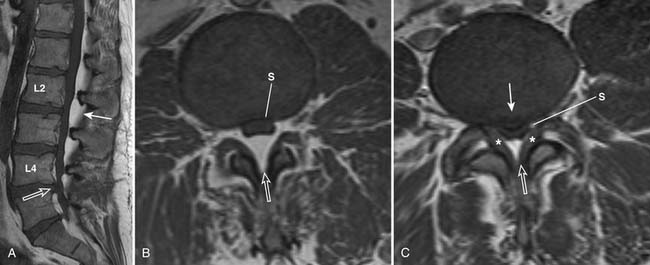
FIGURE 16-14 Severe spinal stenosis secondary to epidural lipomatosis and other degenerative changes.
The central spinal canal can be narrowed anteriorly by disc bulge or herniation and vertebral osteophytes. Posterolaterally, it may be narrowed by facet disease and ligamentum flavum hypertrophy. Epidural lipomatosis tends to favor the posterior epidural space but may also be seen circumferentially. These abnormalities lead to distortion of the normally round or oval shape of the spinal canal and thecal sac. With worsening stenosis, the spinal canal and thecal sac may become triangularly shaped or flattened. There may be effacement of cerebrospinal fluid space located between the degenerative processes, causing spinal stenosis and impingement of the spinal cord or nerve roots.
Grading of spinal canal stenosis can be performed according to the recommendation of the Combined Task Forces of the North American Spine Society, American Society of Spine Radiology, and American Society of Neuroradiology.1 Spinal canal compromise of less than one third of the normal canal is graded as “mild,” between one third and two thirds is “moderate,” and over two thirds is “severe.” Neural foraminal stenosis can be assessed on axial images and lateral sagittal images, using a grading scheme similar to that for central spinal canal.
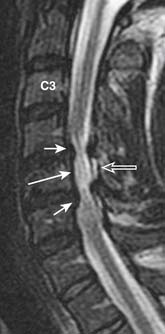
Severe spinal canal stenosis can lead to compression of the spinal cord. This can result in ischemia and edema, which may eventually lead to irreversible damage and myelomalacia (Figure 16-15). Myelomalacia can be seen as T2 hyperintense signal of the spinal cord. Cystic changes and tethering of the cord to the dural sac may also be present. Differentiation of myelomalacia from reversible edema or ischemia can be difficult when atrophy associated with the myelomalacia is not evident.
Summary
Degenerative disease is the most common reason for spine imaging. Standardized nomenclature for description of degenerative spine disease has been developed,1 and further revision is now underway. A universal adoption of this nomenclature is encouraged to facilitate more effective communication among all who provide spine care to patients. Neoplasm, infection, and trauma are also important indications for imaging. Imaging is particularly important in patients presenting with the so-called red flags that suggest a higher risk of these diseases, such as increasing age, osteoporosis, and persistent or progressive symptoms. In patients who have received spine surgery, imaging is required to assess hardware placement, postsurgical complications, and disease progression after surgery.
1. Fardon D.F., Milette P.C. Nomenclature and classification of lumbar disc pathology. Spine. 2001;26(5):E93-E113.
2. Masaryk T.J., Ross J.S., Modic M.T., et al. High resolution MR imaging of sequestered lumbar intervertebral discs. AJNR Am J. Neuroradiol.. 1988;9:351-358.
3. Modic M.T., Steinberg P.M., Ross J.S., et al. Degenerative disc disease: assessment of changes in vertebral body marrow with MR imaging. Radiology. 1988;166:193-199.
4. Rahme R., Moussa R. The Modic vertebral endplate and marrow changes: pathologic significance and relation to low back pain and segmental instability of the lumbar spine. AJNR Am. J. Neuroradiol.. 2008;29:838-842.
5. Buttermann G.R., Heithoff K.B., Ogilvie J.W., et al. Vertebral body MRI related to lumbar fusion results. Eur. Spine. J.. 1997;6:115-120.
6. Leone A., Guglielmi G., Cassar-Pullicino V.N., Bonomo L. Lumbar intervertebral instability. Radiology. 2007;245(1):62-77.
7. Nizard R.S., Wybier M., Laredo J.-D. Radiologic assessment of lumbar intervertebral instability and degenerative spondylolisthesis. Radiol. Clin. North Am.. 2001;39(1):55-71.
8. Macnab I. The traction spur: an indicator of segmental instability. J. Bone. Joint Surg. Am.. 1971;53:663-670.
[/level-membership-for-orthopaedics-category][not-level-membership-for-orthopaedics-category]
16 Imaging of the Aging Spine
KEY POINTS
Imaging of Degenerative Spine Disease
Intervertebral Disc Degeneration
On radiography (Figure 16-1), intervertebral disc degeneration is indirectly inferred from loss of the normal disc space height. Gas may be seen in the disc space, due to a negative pressure within the degenerative disc causing extraction of nitrogen from extracellular space. This is commonly referred to as vacuum phenomenon. The vacuum phenomenon can be accentuated during extension of the spine and reduced during flexion. Vertebral endplate irregularity is often seen, with or without associated sclerotic changes at the endplates.
FIGURE 16-1 Radiographic features of degenerative disc disease.
Disc space narrowing and subtle cartilaginous endplate sclerosis are present at L4-L5.
With the wide availability of MRI, CT is rarely requested for the primary evaluation of degenerative disc disease, except in patients with contraindications for MRI examination. Similar to radiography, CT can demonstrate disc space loss, endplate irregularity or sclerotic changes, and vacuum phenomenon. However, CT also allows direct visualization of disc bulging and disc herniation (Figure 16-2), although with a lesser soft tissue contrast compared to MRI. When more accurate depiction of disc bulging and disc herniation is required, CT myelography can be performed (Figure 16-3) .
MRI provides the best soft tissue details of degenerative disc disease. In young healthy patients, the intervertebral discs demonstrate hyperintensity on T2-weighted images. With aging, there is loss of this hyperintensity due to a decrease of water content and changes in proteoglycan composition (Figure 16-4). There is decreased disc height and the endplates may become irregular. Gas from vacuum phenomenon may fill the space of a degenerative disc, which may demonstrate hypointensity on both T1- and T2-weighted images. Alternatively, the space may be filled with fluid, which is seen as hyperintensity on T2-weighted images. A degenerative disc may also calcify, which can give hypointensity or hyperintensity on T1-weighted images, depending on the type and concentration of calcification. A degenerative disc may also enhance secondary to the presence of granulation tissues.
FIGURE 16-4 Disc degeneration seen on MRI (T2-weighted image) (same patient as Figure 16-1). There is disc space narrowing and loss of the normal T2 hyperintensity of the L4-L5 disc. Bulging of the disc with a small protrusion into the spinal canal is also shown (arrow). Compare the L4-L5 disc with the normal appearance of the discs at L2-L3 and L3-L4 levels.
Fissures of the annulus fibrosus may be seen in the intervertebral discs. On MRI, annular disruptions (also referred as fissures) may be seen as a small high intensity zone within the outer annulus (Figure 16-5) .
One of the primary advantages of MRI is the direct visualization of disc bulging or herniation, and its associated mass effect on the nervous structures. At a particular disc level, a disc can have bulging and one or more areas of herniation seen on the same occasion. In 2001, multiple societies reached a consensus to standardize the nomenclature and classification of disc pathology.1 This work is currently being revised (A. Williams, S. Rothman, R. Murtagh, G. Sze, in progress). The consensus was initially developed for lumbar disc disease but is generalized to disc disease in the rest of the spine. Normal disc space is defined craniocaudally by the vertebral body endplates, and circumferentially by the ring apophysis of the vertebral bodies. In the newly revised consensus, a disc bulge refers to diffuse displacement of disc material beyond the normal disc space, and covers greater than 25% of the normal disc space circumference (i.e, greater than 90 degrees of the circumference) (Figure 16-6, A) . Disc displacement covering 25% or less of the circumference is called herniation. When the width of the base of the disc herniation is greater than any other measurements in the same plane of the herniation, it is called a protrusion (Figure 16-6, B). When any of the measurements of the herniation is greater than the width at its base, the herniation is described as an extrusion (Figure 16-6, C and D
[/not-level-membership-for-orthopaedics-category]
