No reliable imaging findings to suggest or confirm diagnosis


• Hepatic artery stenosis


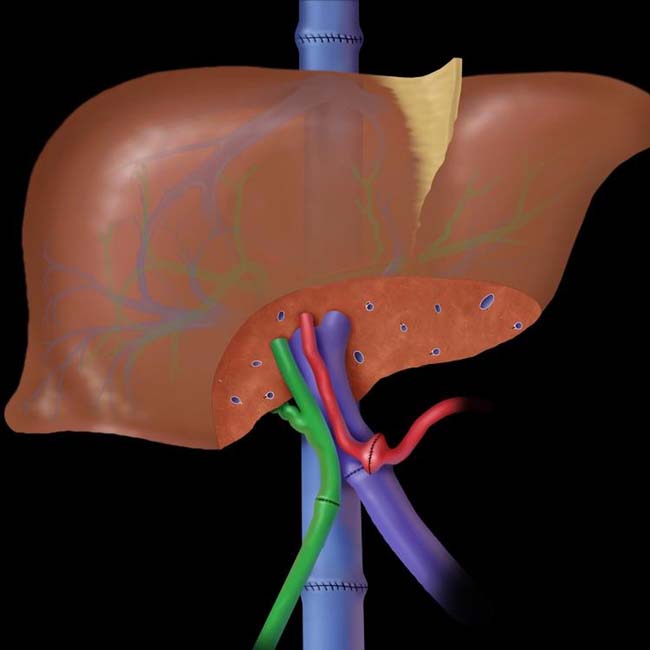
 without dilation of the upstream bile ducts. This is the normal appearance of a duct-to-duct anastomosis.


IMAGING
Normal Post-Transplantation Findings


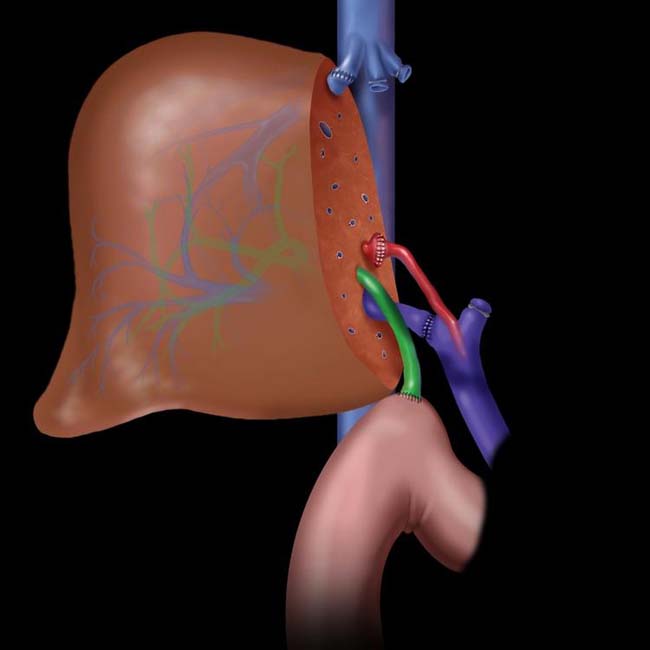
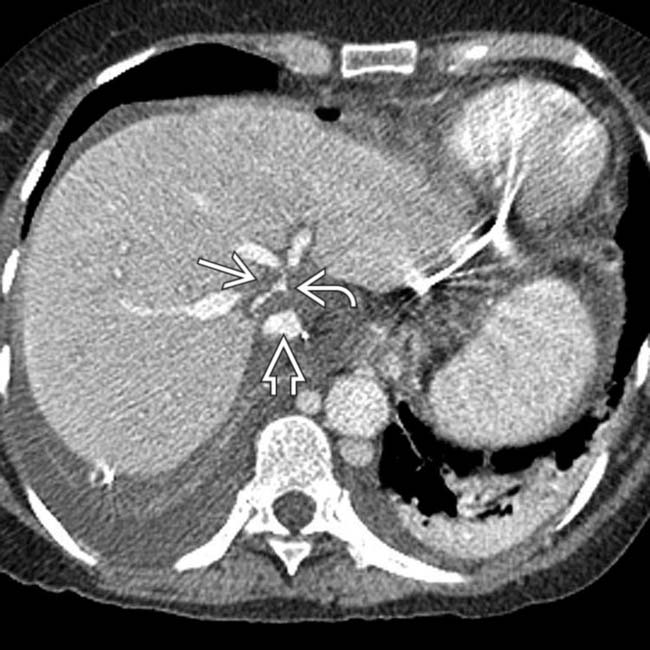
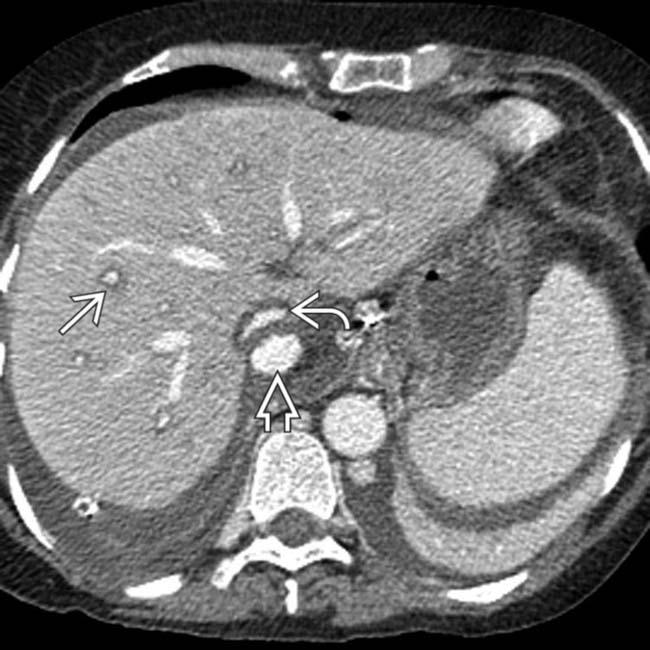
• Vascular and biliary anastomoses may show waist-like narrowing


Vascular Complications
• HA stenosis
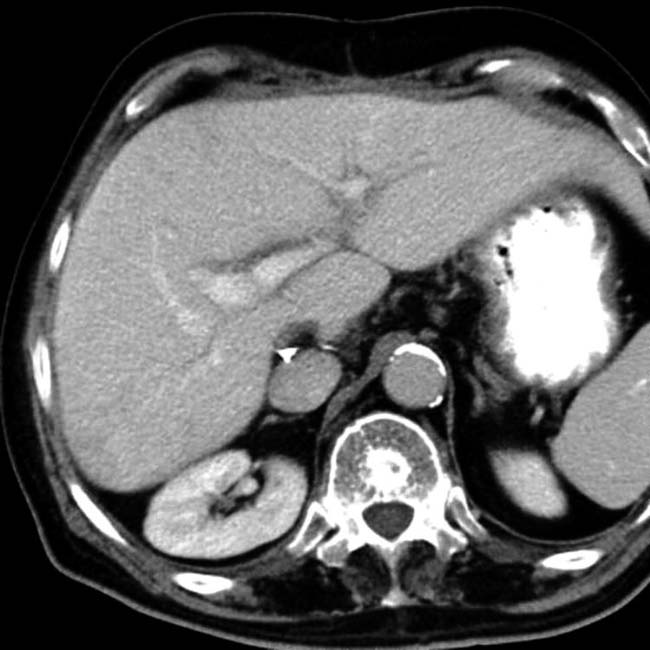
 US: Usually 1st imaging study to suggest diagnosis
 US: Usually 1st imaging study to suggest diagnosis


• HA thrombosis


• PV stenosis


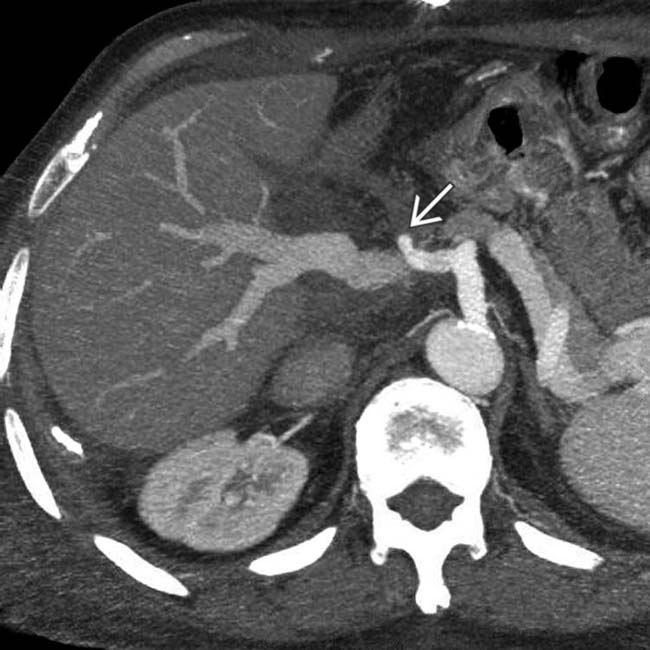
 surrounding the portal veins.
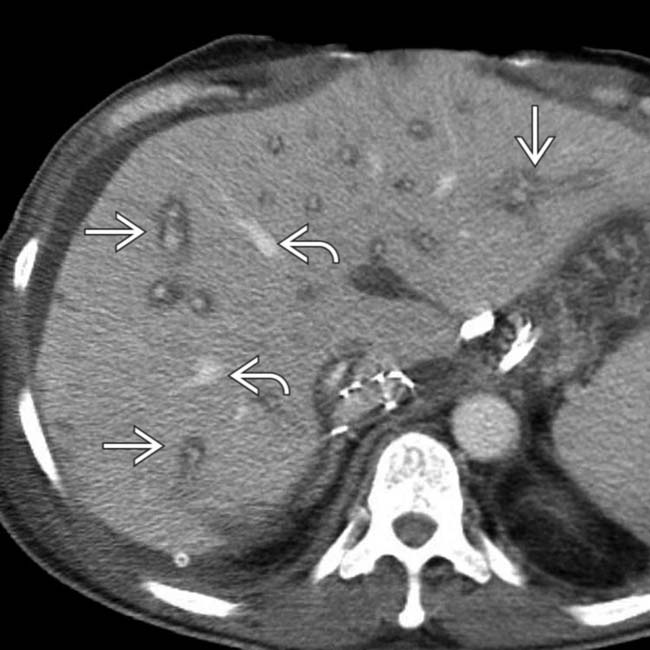
 while the space around the hepatic veins
  is less affected. This is a common finding in the early post-transplantation setting and results from the transection of lymphatics and accumulation of lymph along the portal tracts. It generally resolves as lymphatic connections reform.
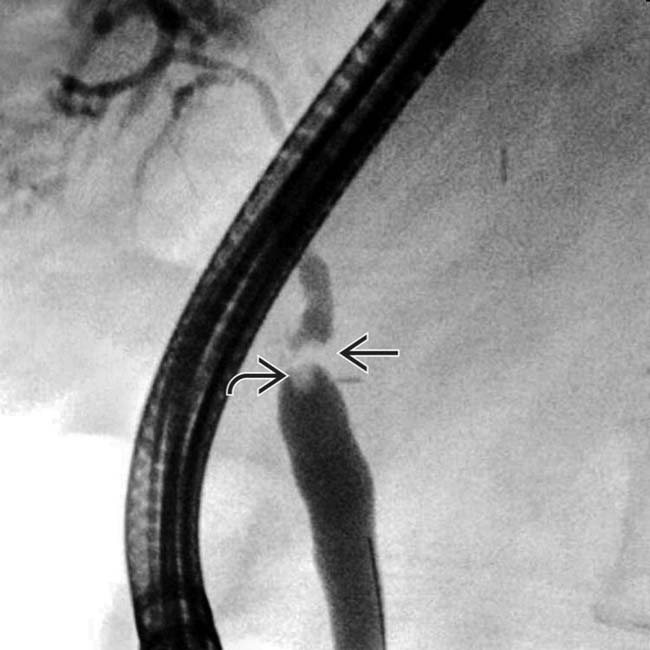
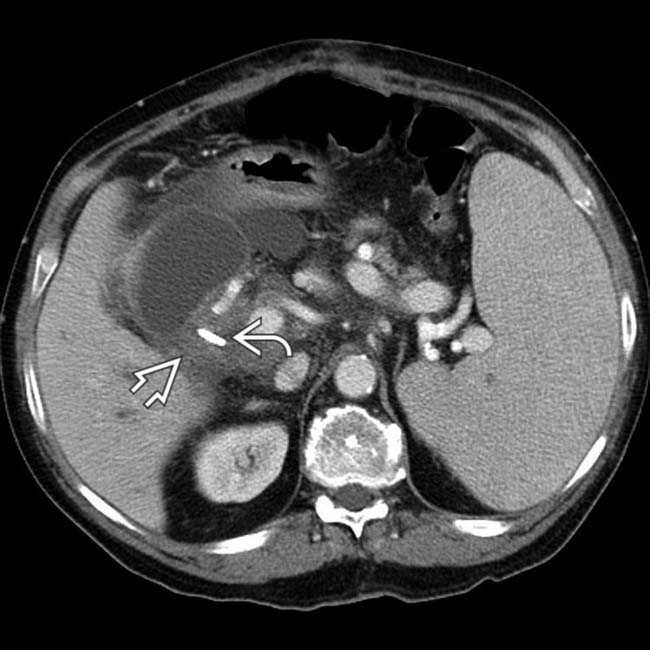
 and a filling defect within the duct
  , which may represent some debris. There is only mild dilation of the intrahepatic (donor) ducts.
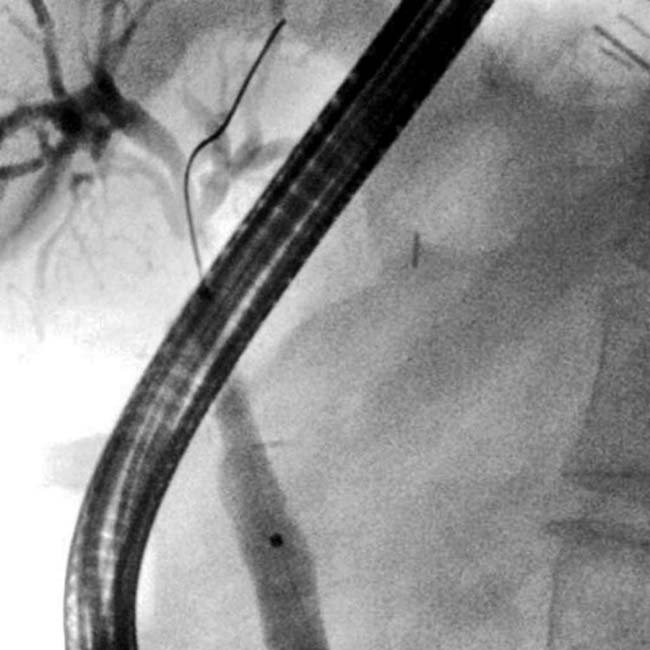
 that originated from the site of entry of the T tube into the recipient bile duct
  just distal to the anastomosis
  .
.
 that was drained by US-guided placement of a pigtail catheter. The patient recovered uneventfully, with removal of the T tube several months later.
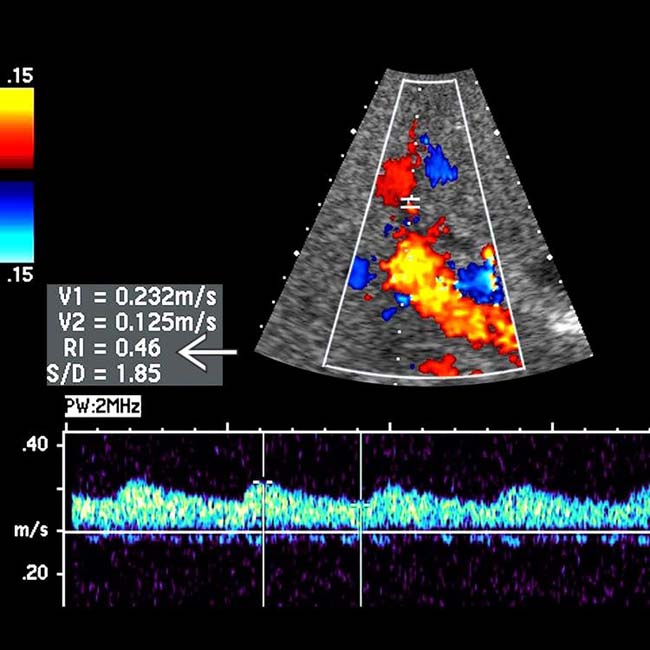
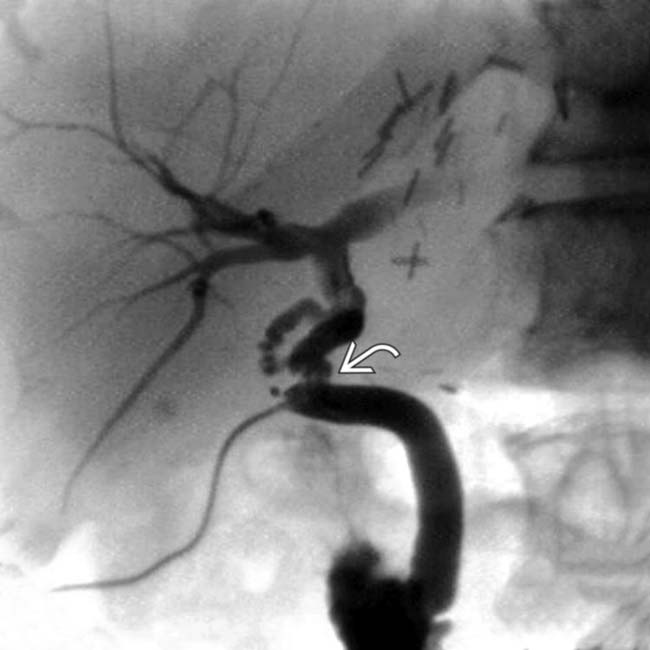
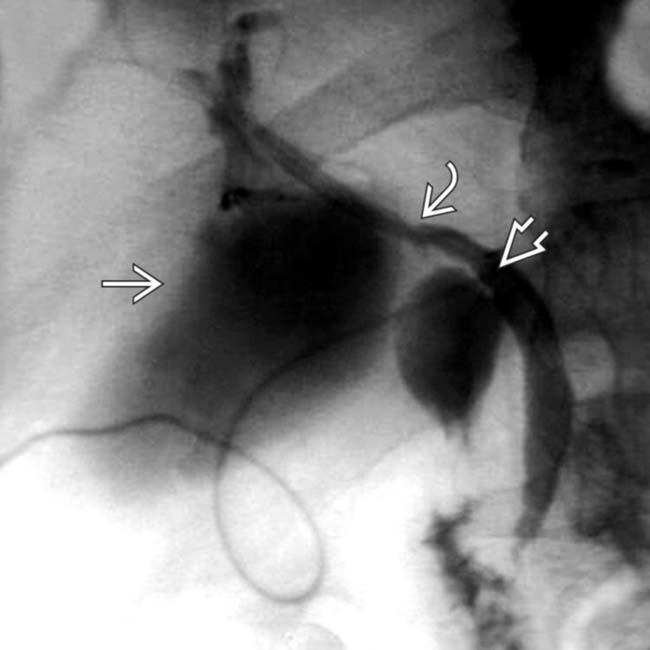
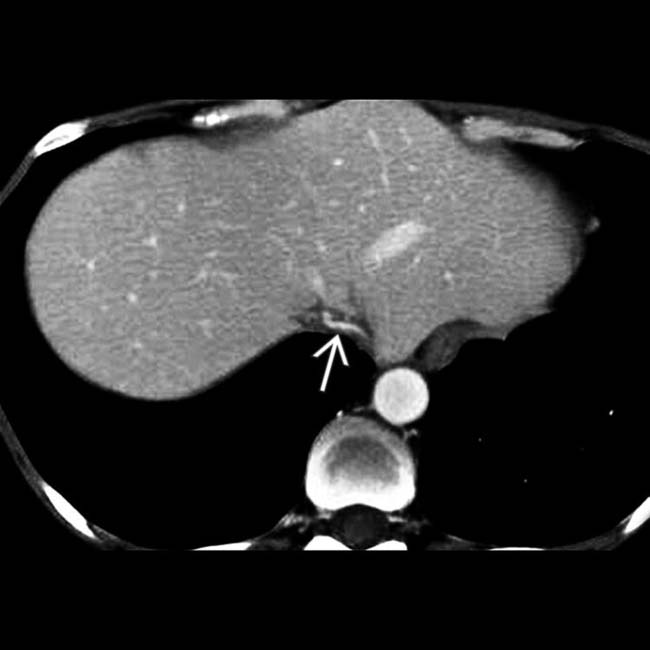
 . These findings are usually indicative of hepatic artery stenosis.
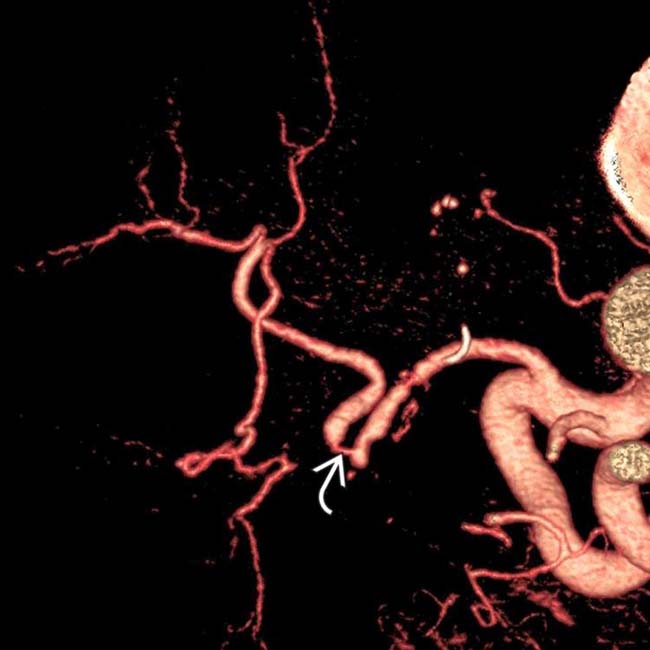
 . Balloon angioplasty and stent were successful in relieving the stenosis.
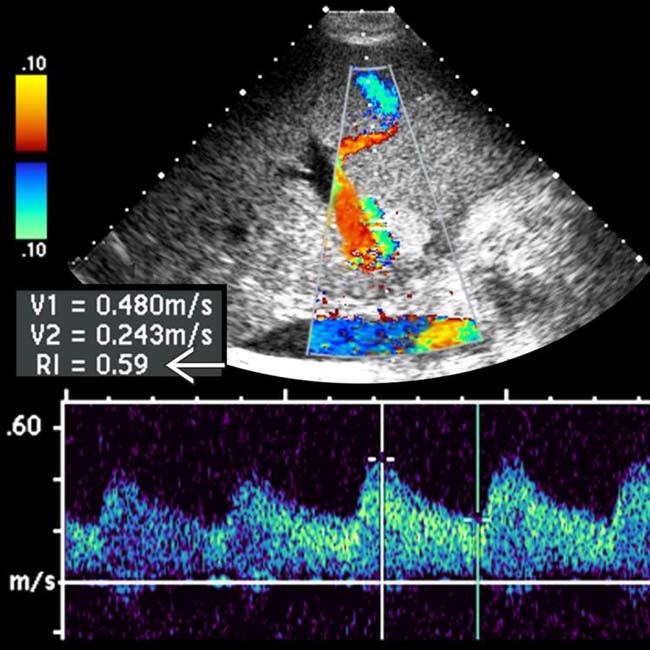
 is 0.59, which is normal.
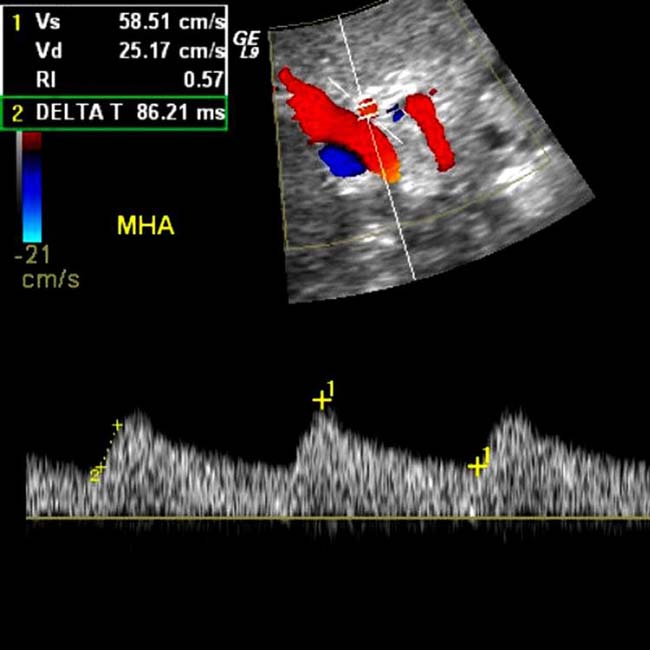
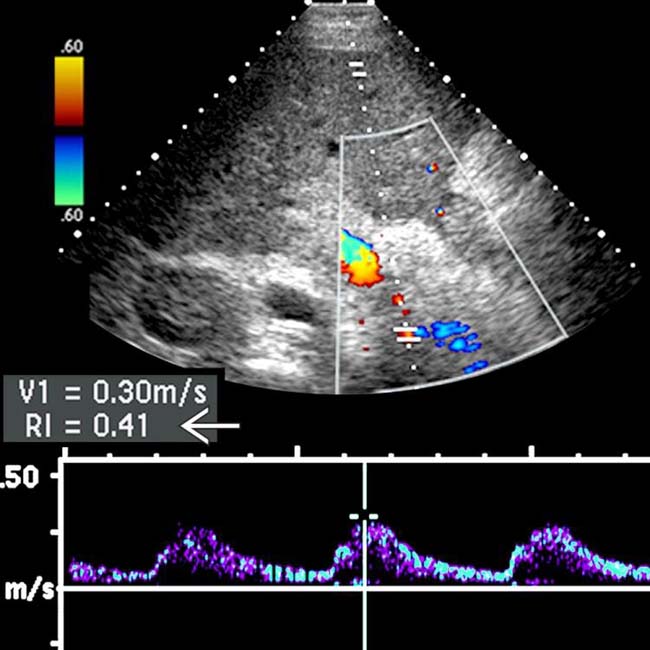
 has fallen to 0.41.
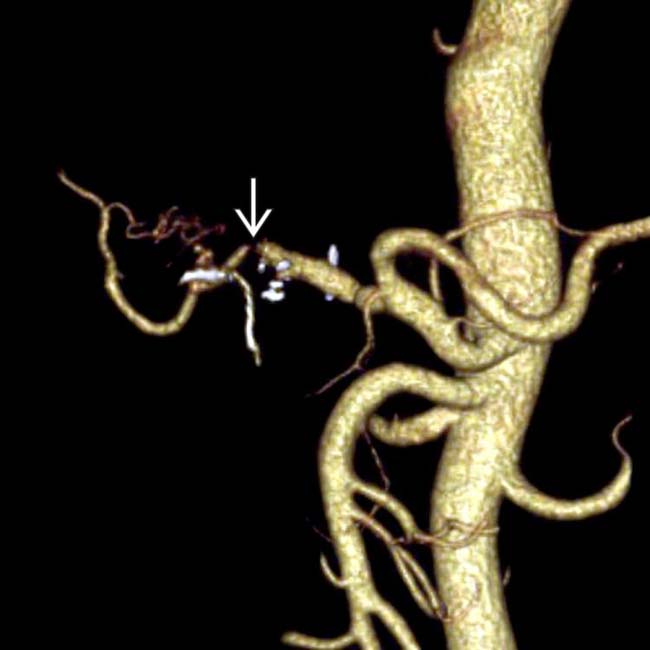
 . Hepatic arterial anastomotic stenosis or thrombosis is a common cause of allograft dysfunction and may lead to biliary necrosis and failed transplantation.
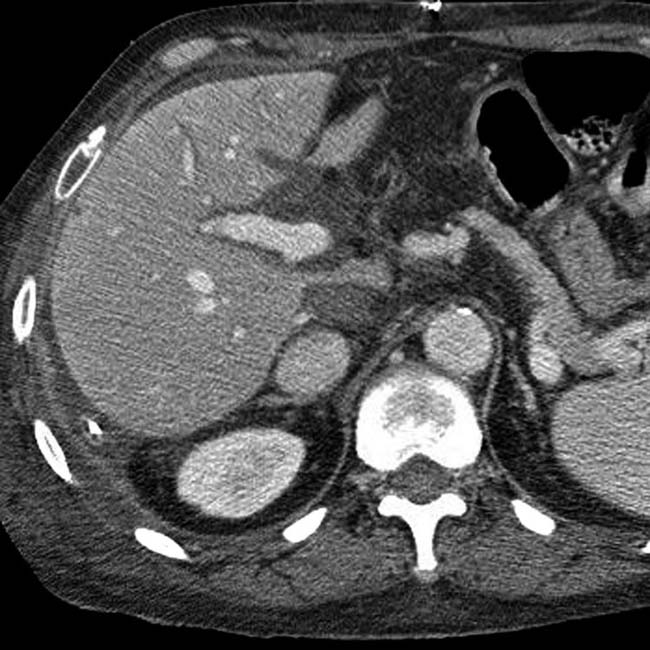
 . This requires urgent revascularization by angioplasty or surgery, which is often unsuccessful. If this is the case, retransplantation is required.
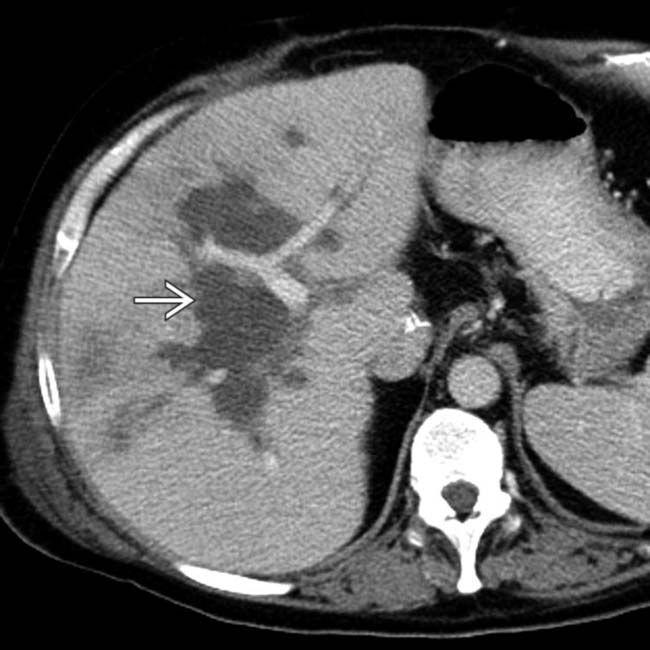
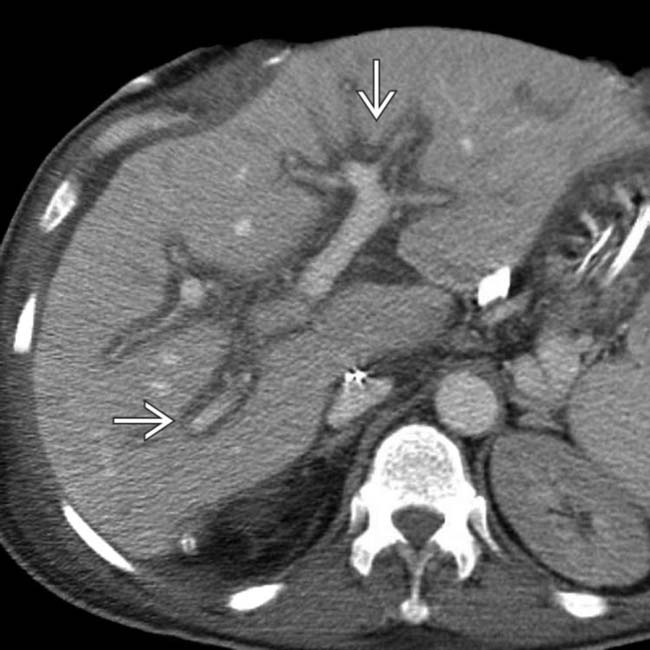
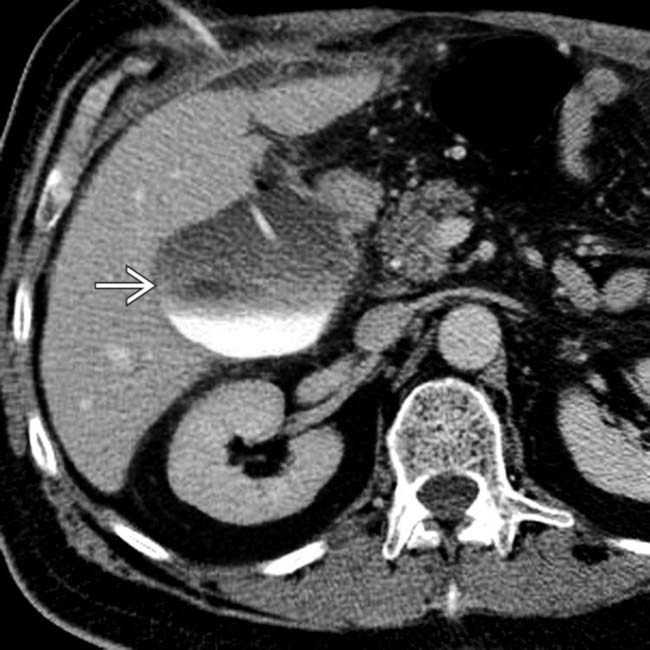
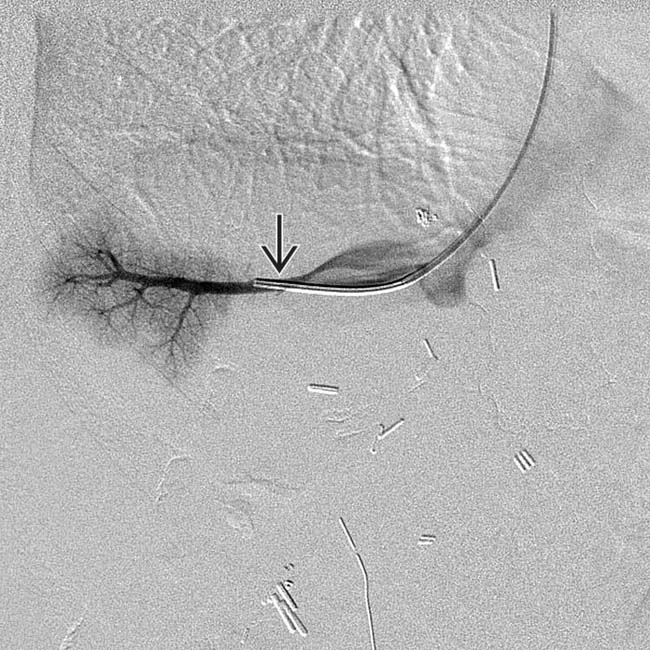
 in the liver with a branching configuration that parallels the portobiliary tracts. This is a biloma resulting from hepatic artery thrombosis.
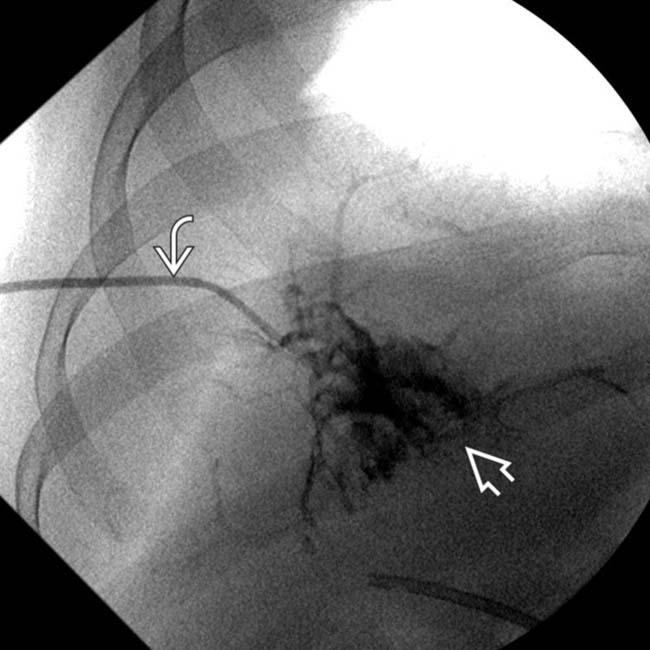
 was introduced to decompress the biloma. Injection of the catheter opacifies nondilated ducts, but many of the duct walls are necrotic and are surrounded by an amorphous collection
  of bile and contrast medium.
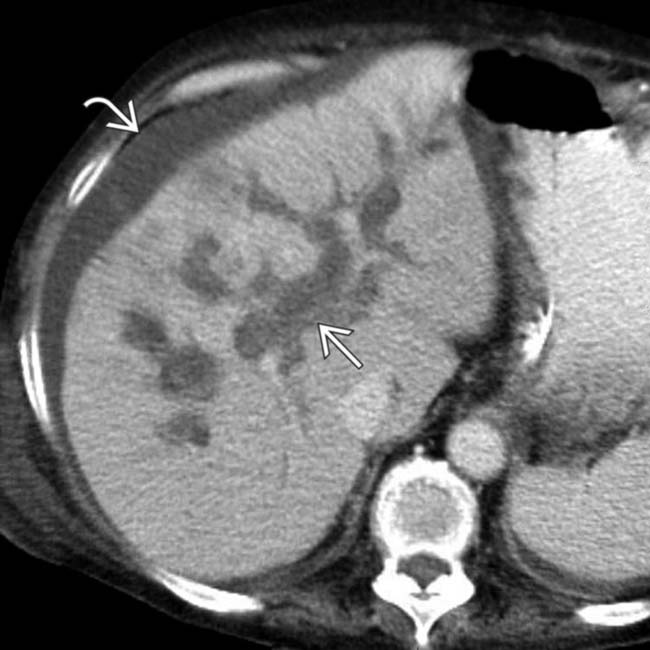
 that has linear, branching, and rounded components, which represent the spectrum of findings from biliary ischemia in the allograft, due to hepatic artery thrombosis. Also note the ascites
  .
.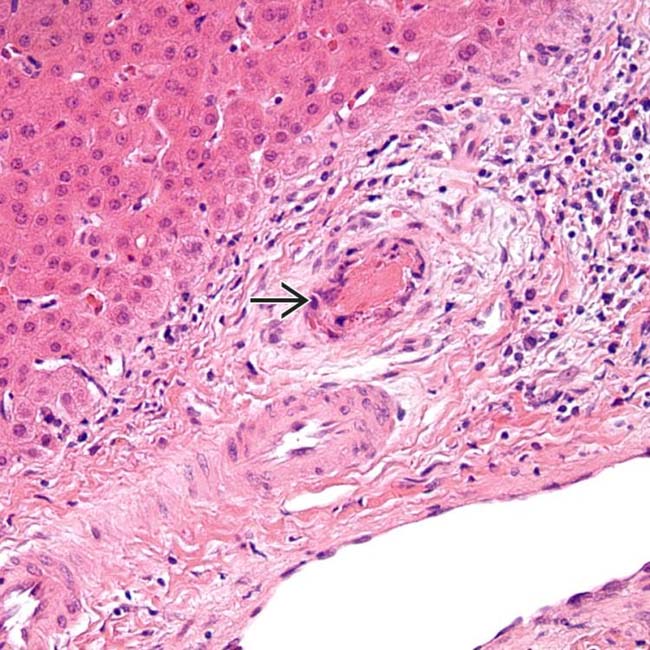
 . (Courtesy L. Yerian, MD.)
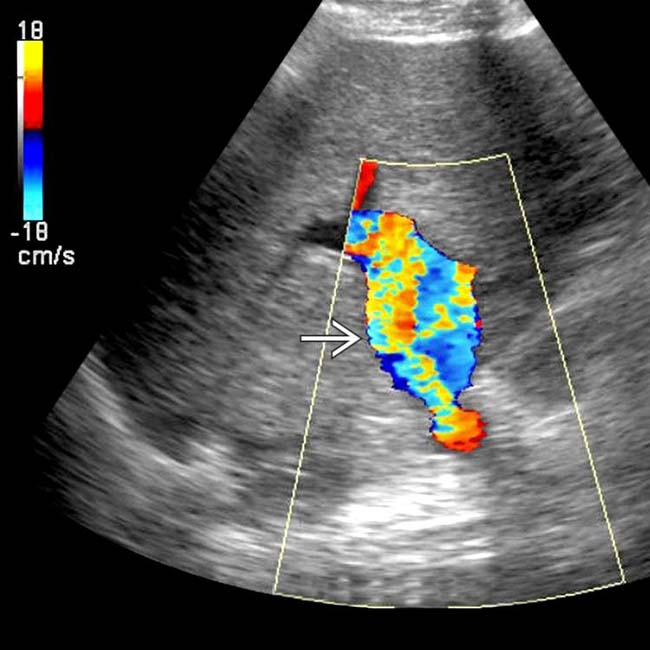
 , suggesting stenosis.
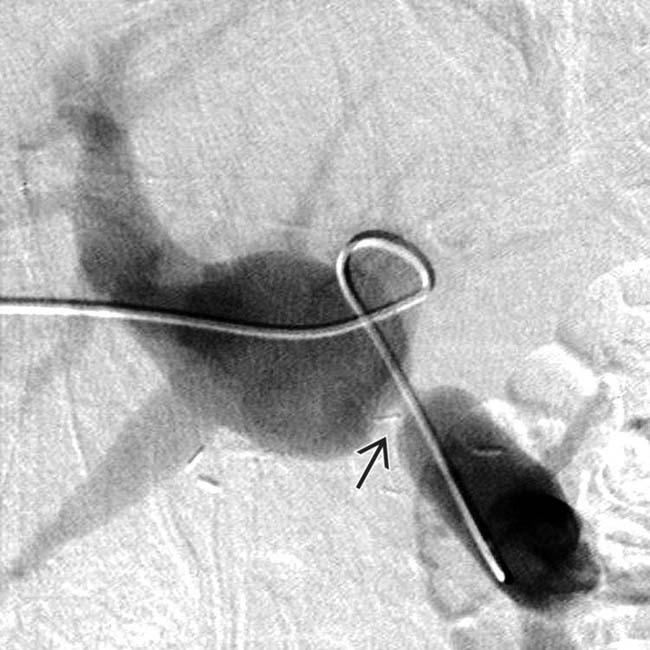
 . This was treated with balloon dilation with good results.
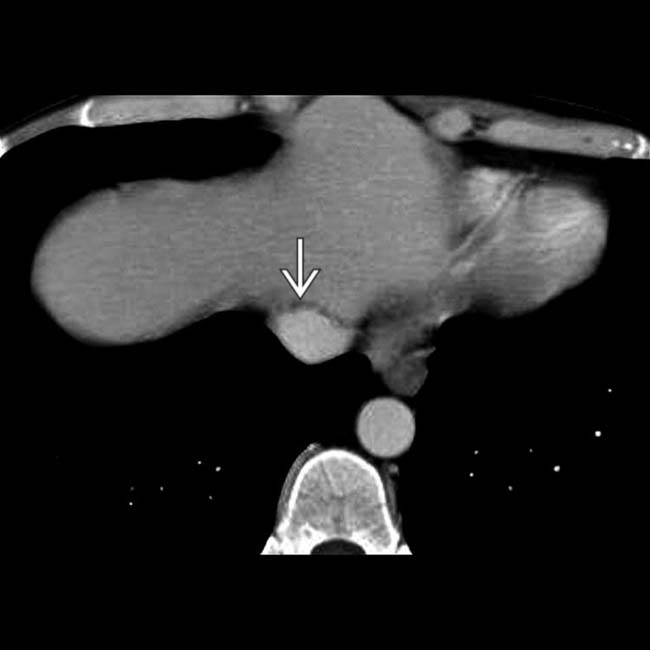
 .
.
 shows marked narrowing of the lumen. The IVC was distended on more caudal sections.
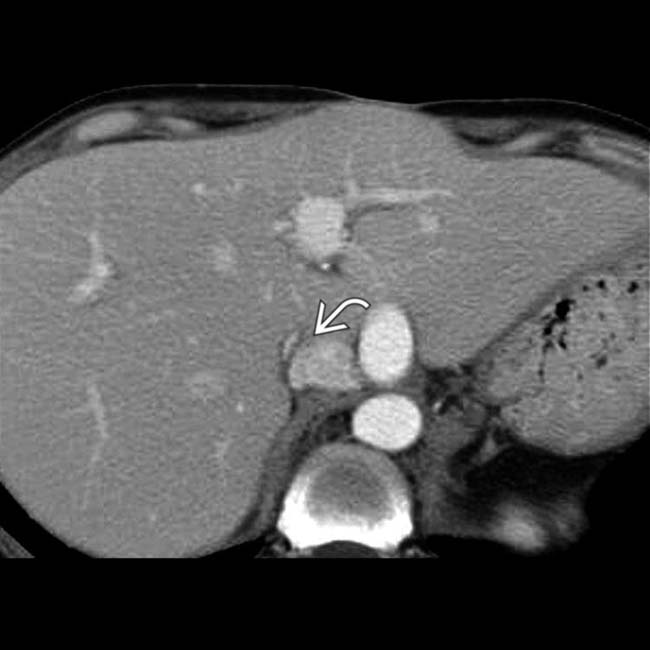
 of the donor and recipient IVC.
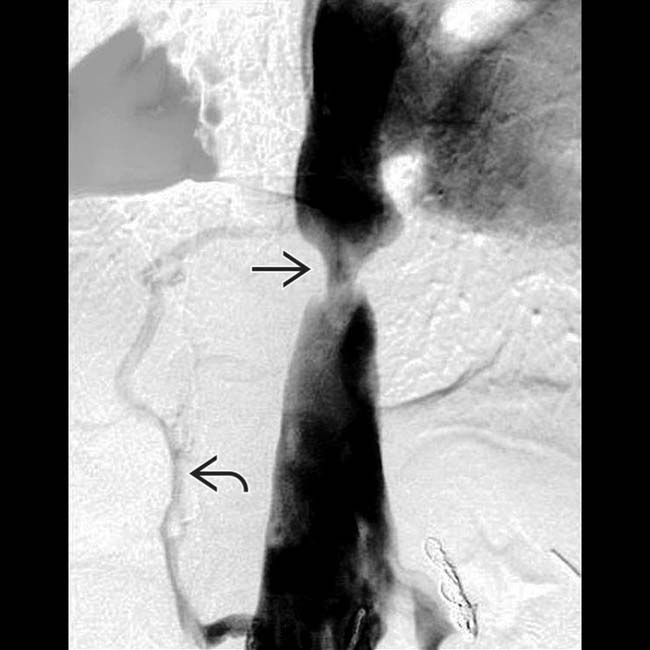
 . At least 1 collateral vein
  is opacified. Balloon dilation relieved the stricture with normalization of intraluminal pressure across the anastomosis.
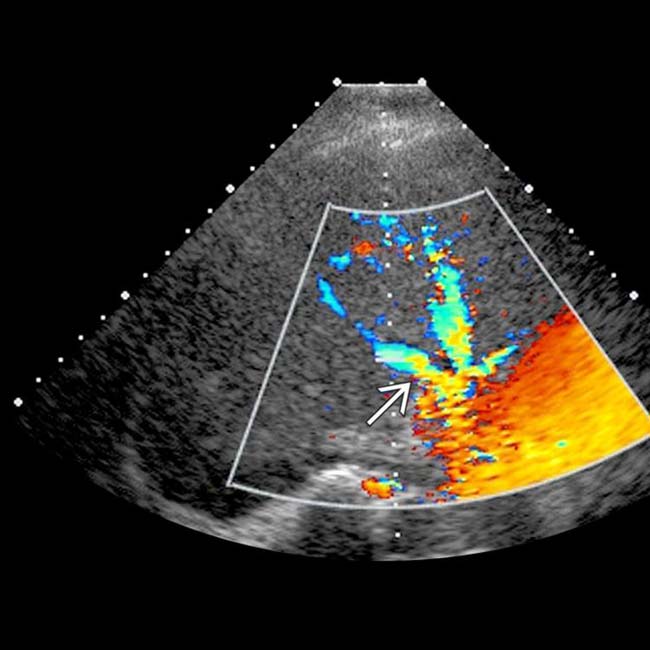
 .
.
 to the recipient IVC
  . The donor IVC and confluence of hepatic veins appear to be strictured
  .
.
 , a dilated recipient IVC
  , and periportal edema
  within the liver allograft.
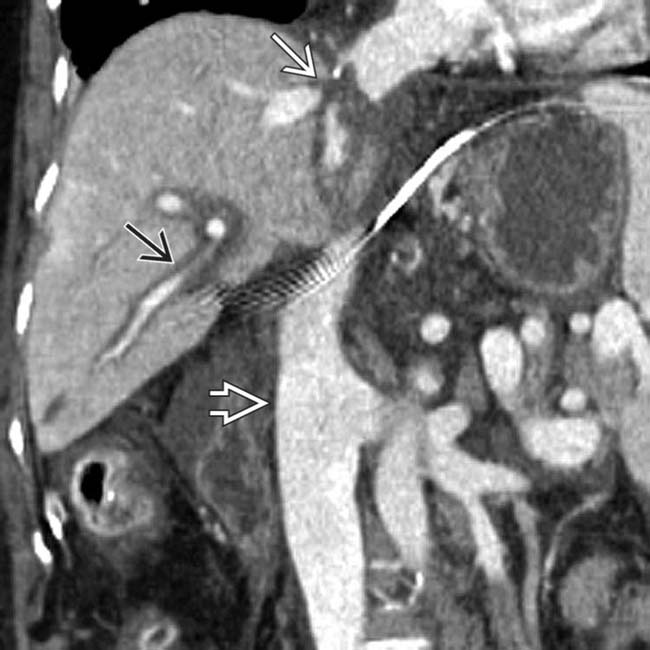
 , stricture at the IVC anastomosis
  , and periportal edema
  . This patient had allograft dysfunction and leg edema.
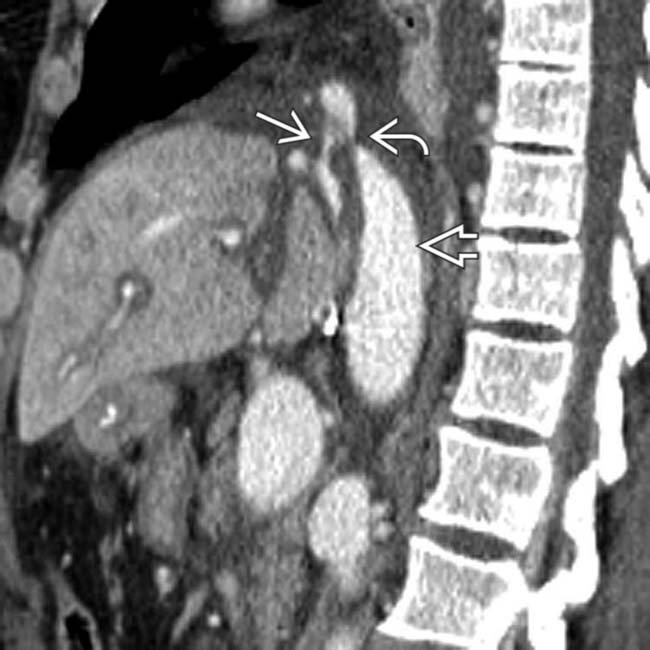
 to the recipient IVC
  and narrowing of at least 1 of the hepatic veins
  .
.
 . These strictures were balloon-dilated with improvement of symptoms and liver function.
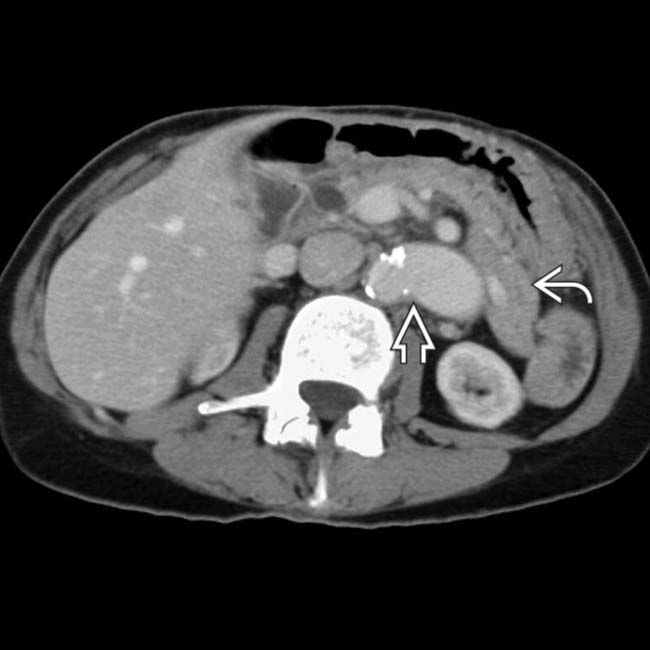
 with this vessel feeding the small bowel, liver, and pancreatic
  allografts, all of which appear normal.
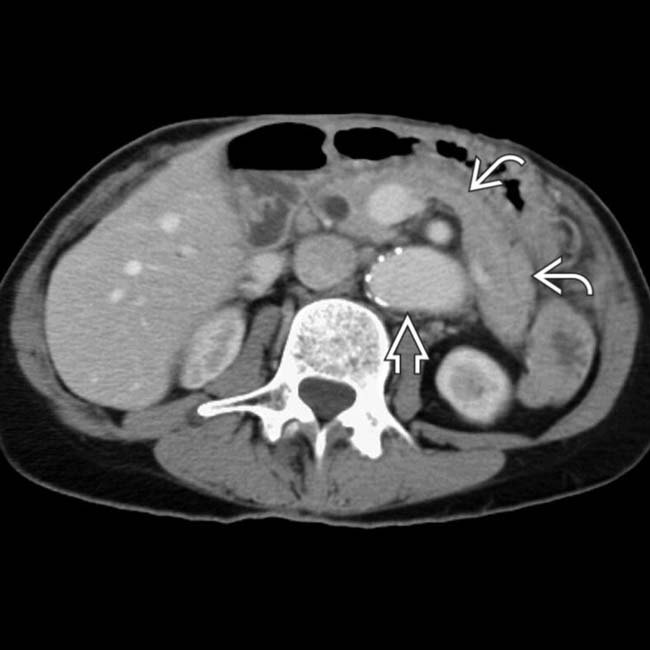
 and the pancreatic allograft
  .
.
 . All 3 transplanted organs functioned normally, and the patient no longer required parenteral nutrition nor insulin.
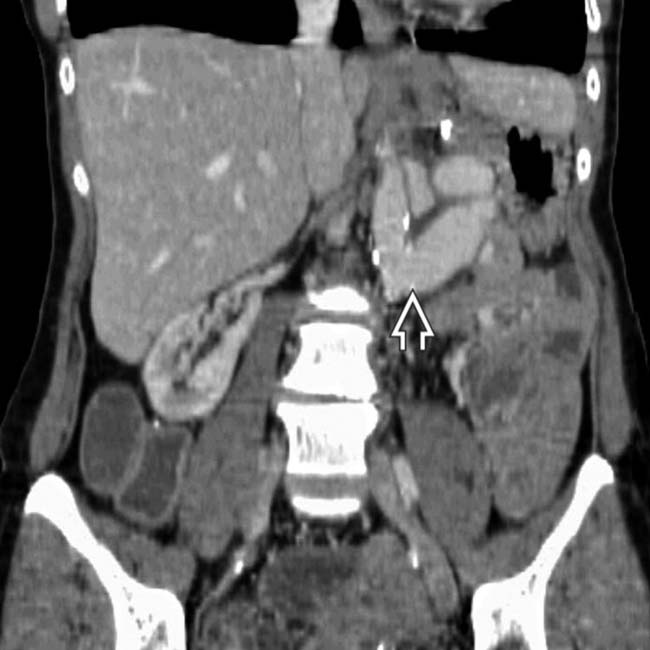
 , which supplied blood to all 3 allografts.
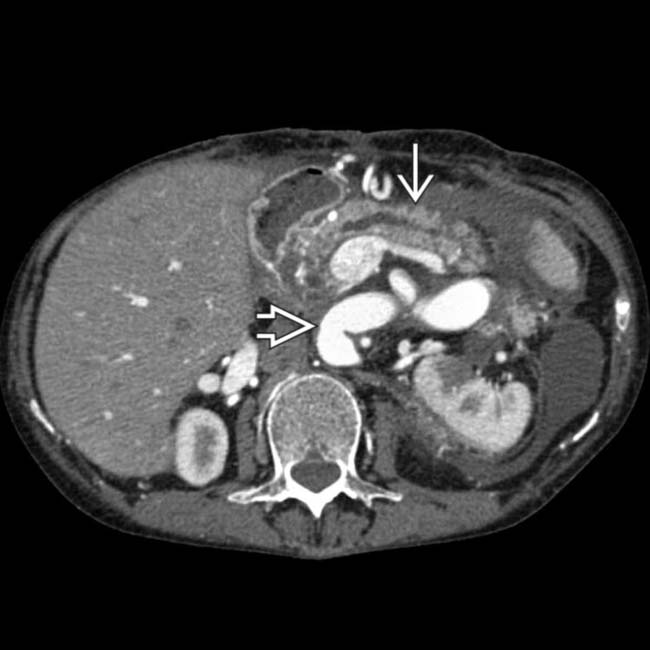
 and liver allografts. The small bowel allograft was normal in appearance on more caudal sections (not shown). The aortic anastomosis
  is noted on this axial CT.
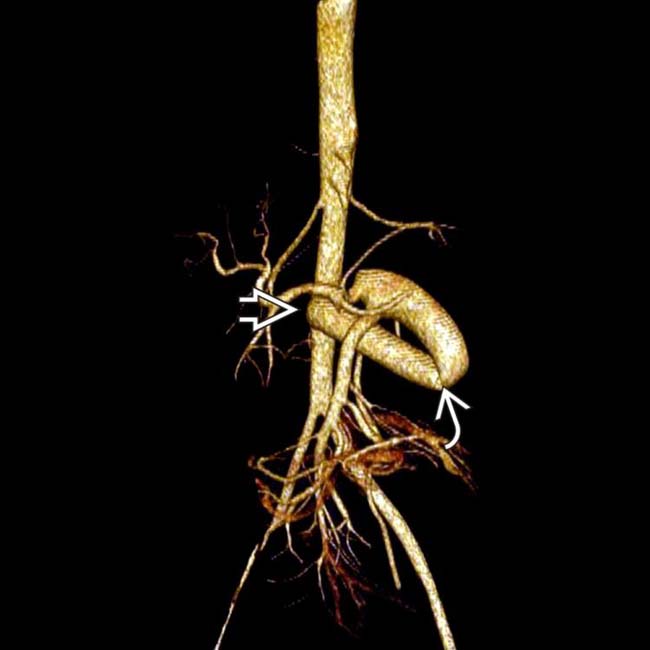
 , causing luminal narrowing and requiring surgical revision. The anastomosis
  with the native aorta is seen.
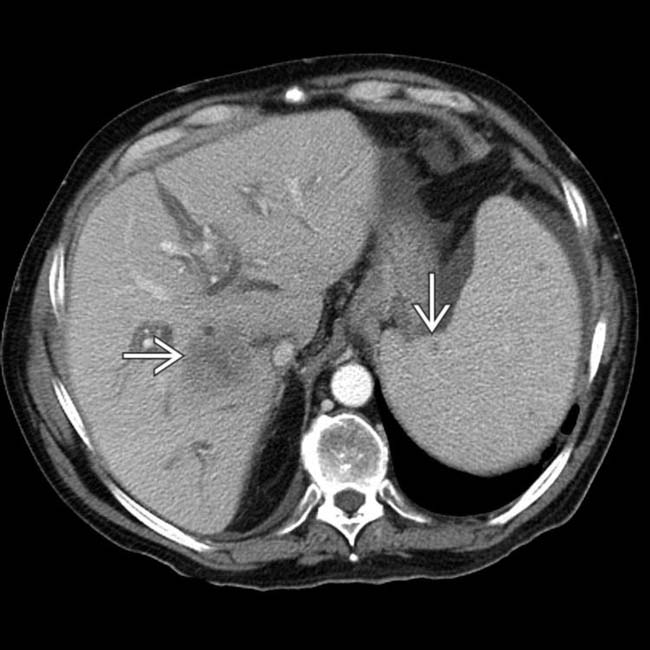
 within both organs.
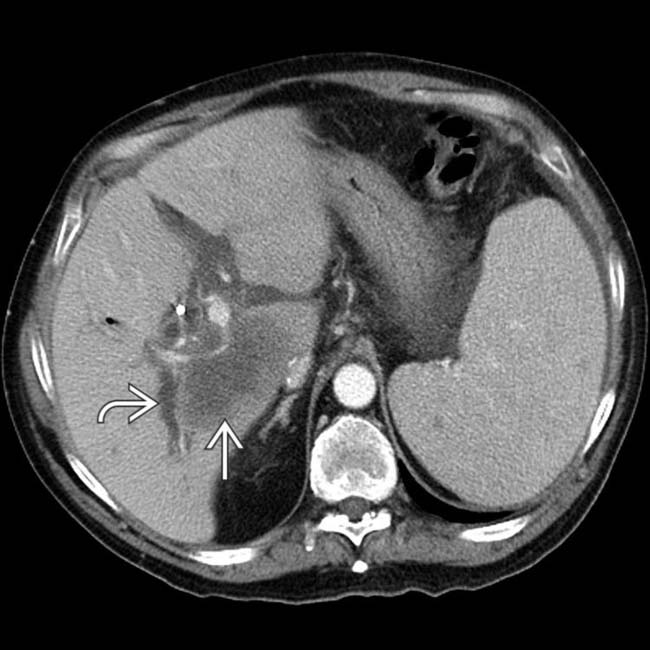
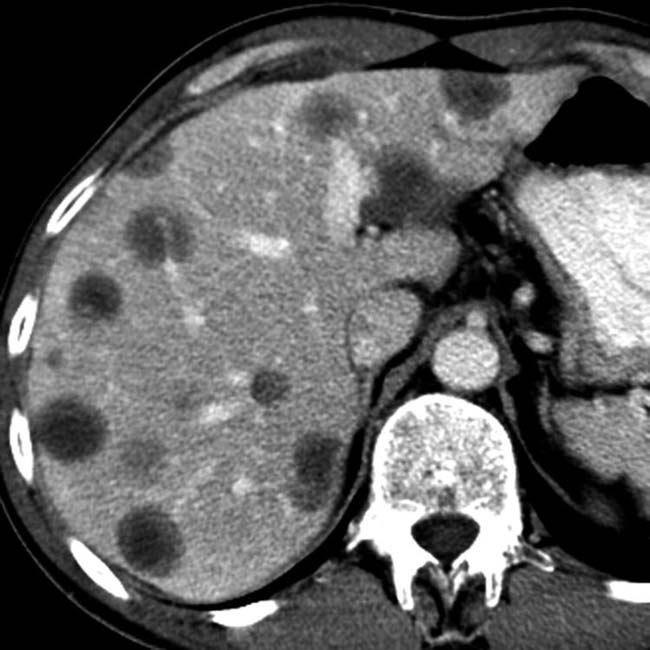
 due to a combination of the hepatic tumor
  and porta hepatic adenopathy.
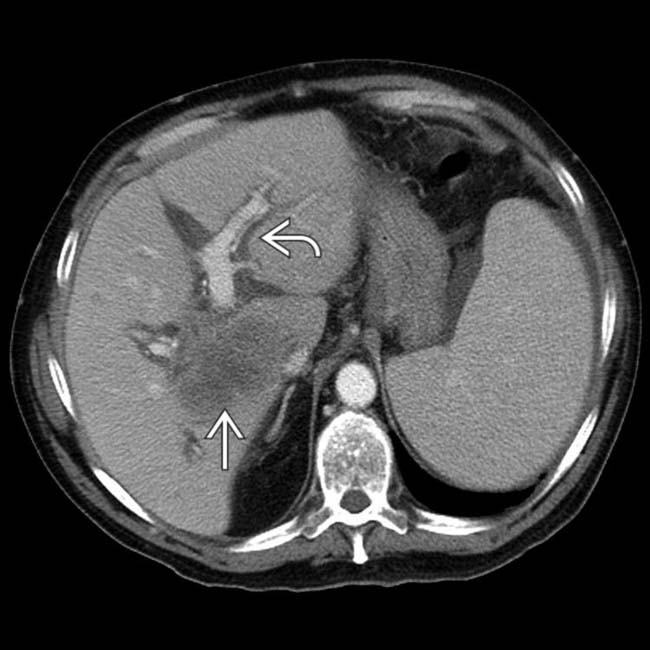
 ) and the obstructed bile ducts
  .
.
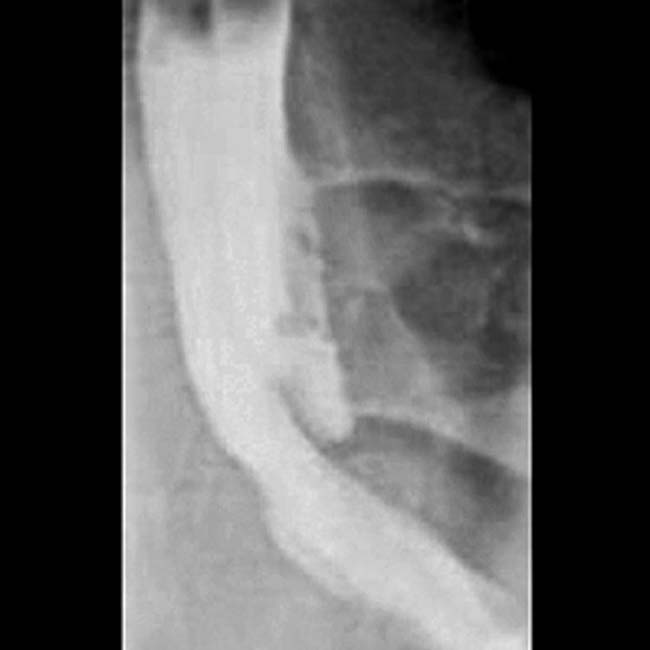
 that contributed to the biliary obstruction. This was partially relieved by a biliary stent
  . All of these features are typical of PTLD following hepatic transplantation.
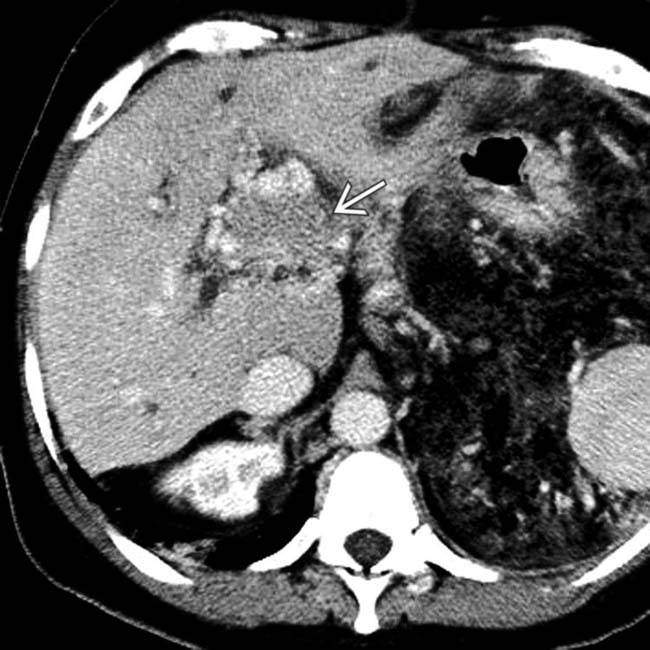
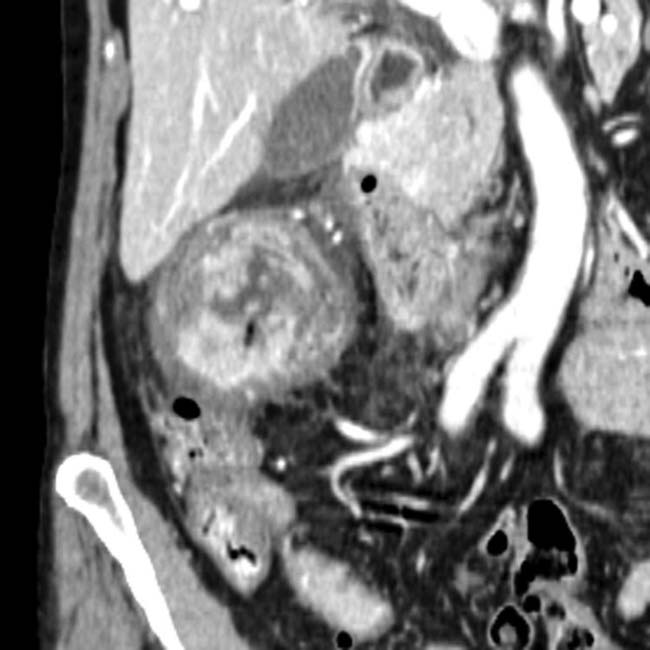
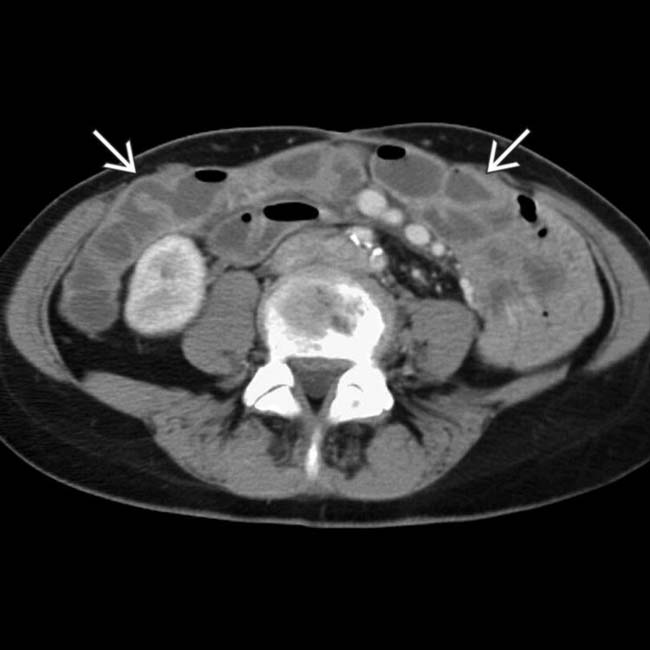
 in the hilum that compresses the portal vein and central bile ducts. Biopsy of the mass proved PTLD within the hepatic allograft.
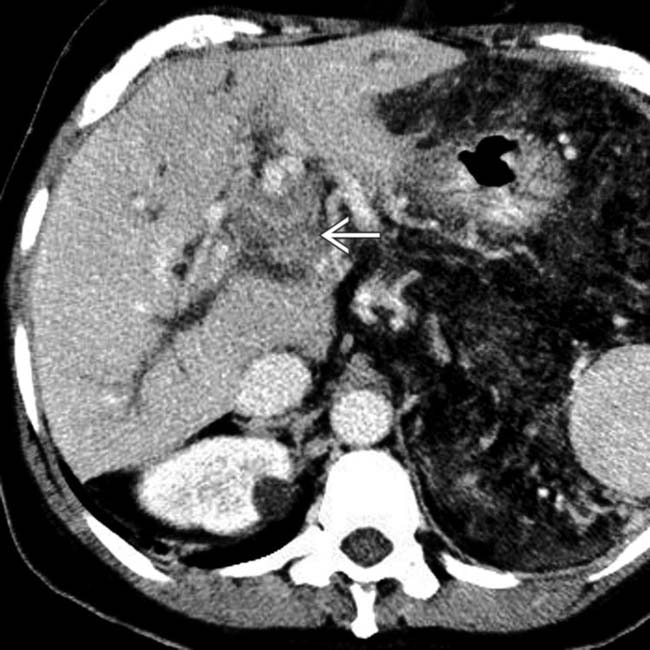
 that compresses and partially obstructs the portal vein and common hepatic duct.
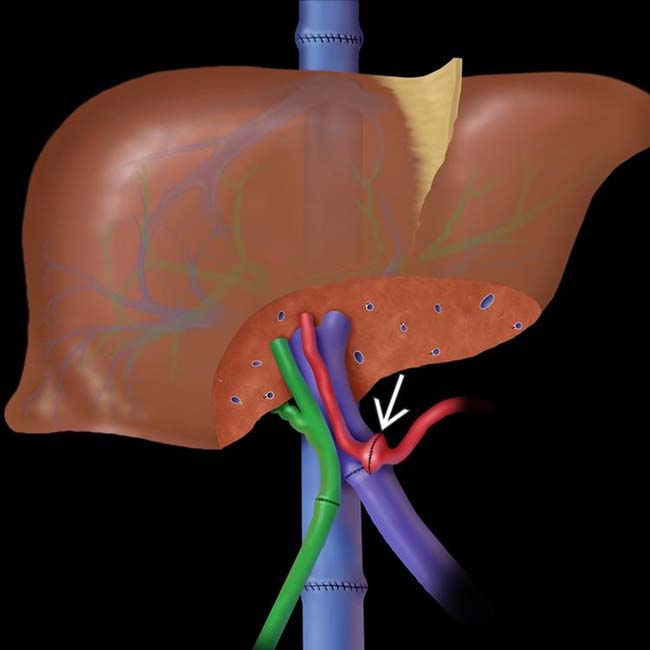
 .
.