Arterial phase: Early peripheral, nodular or globular, discontinuous enhancement


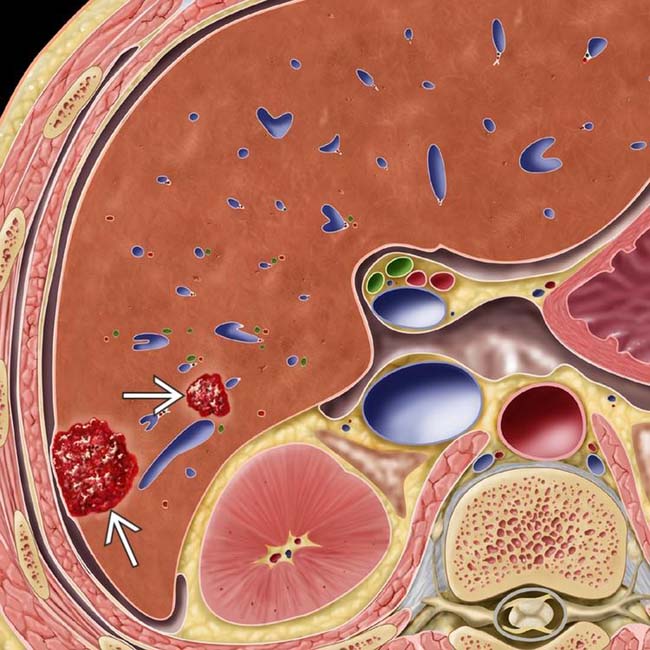
 as nonencapsulated collections of blood within enlarged sinusoidal spaces. The liver is otherwise normal.
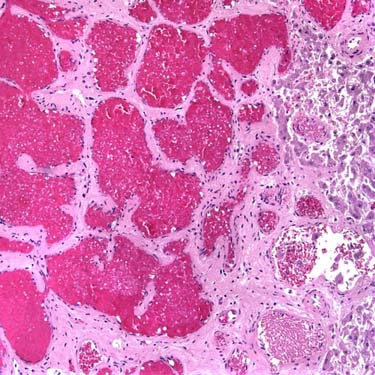
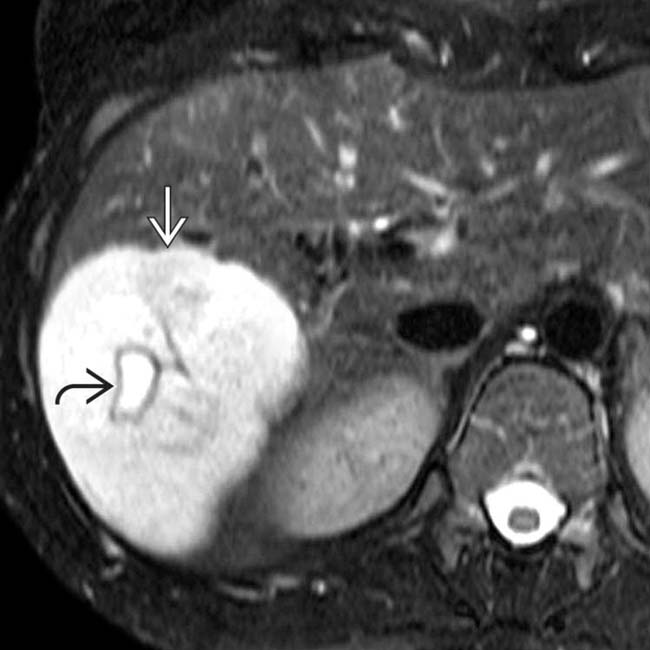
 with marked hyperintensity, similar to that of CSF. A central scar
  within the mass is even more hyperintense, a typical feature of a large or giant hemangioma.
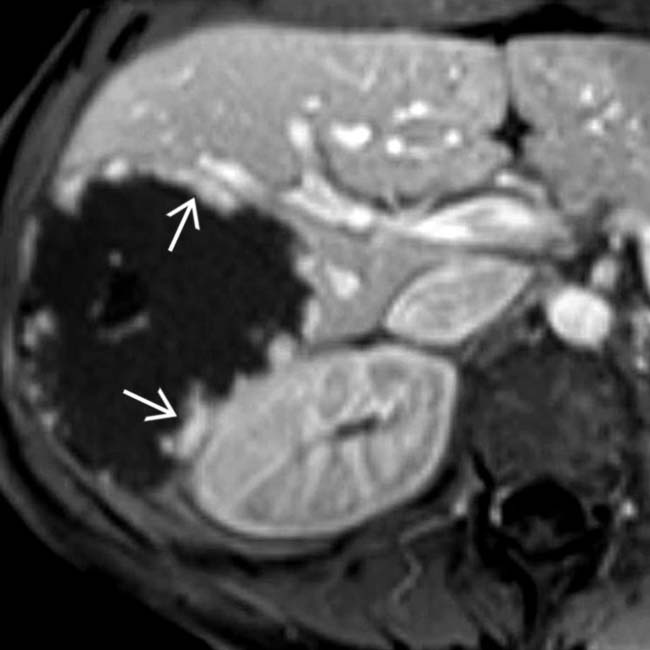
 of the hemangioma, isointense to hepatic vessels, that persisted and progressed on subsequent phases (not shown).
IMAGING
General Features


CT Findings


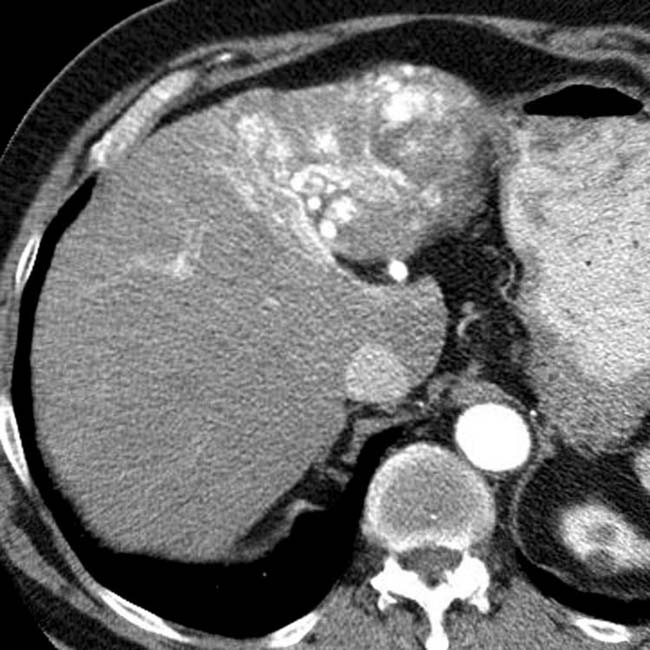
 with nodular, discontinuous, peripheral enhancement that is nearly isodense to blood vessels. The lesion was also isodense with blood on an unenhanced CT (not shown) and showed progressive centripetal “fill-in” on delayed CECT.
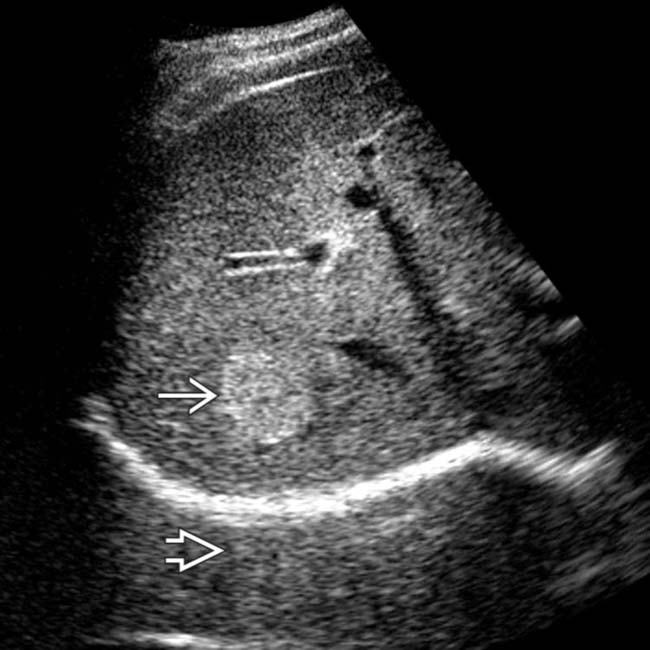
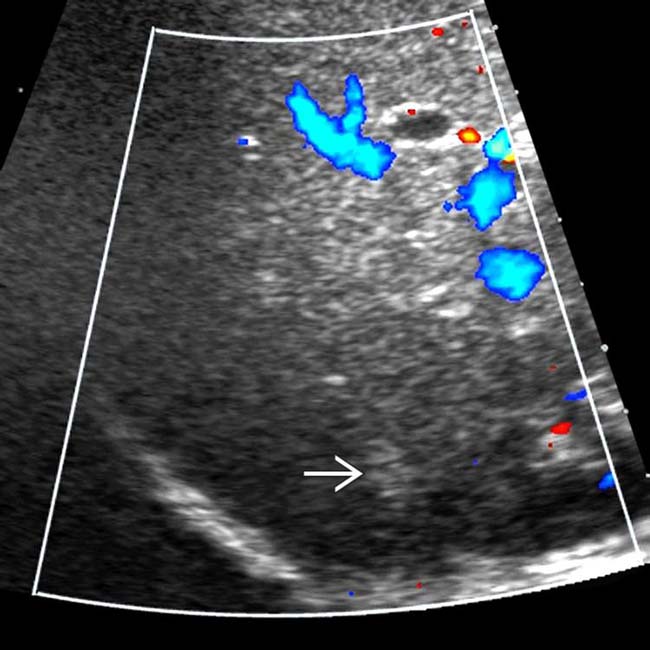
 in the peripheral right lobe, with possible acoustic enhancement
  , typical features of hemangioma.
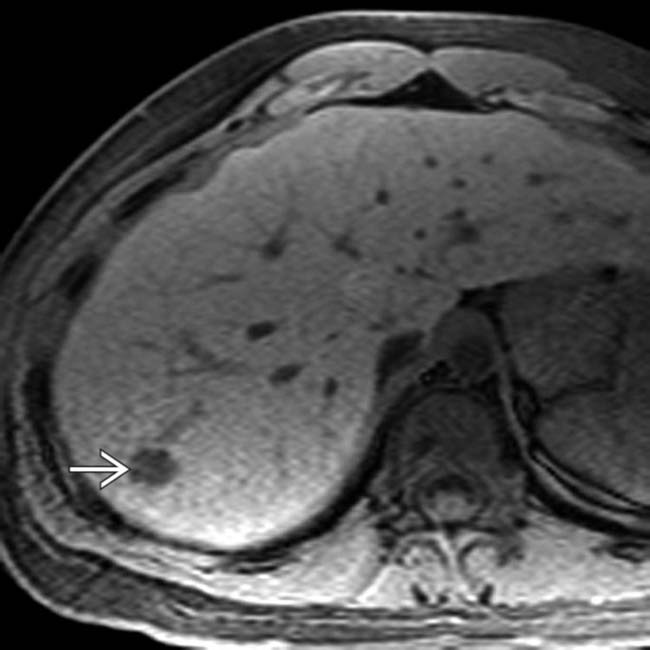
 is seen, representing hemangioma.
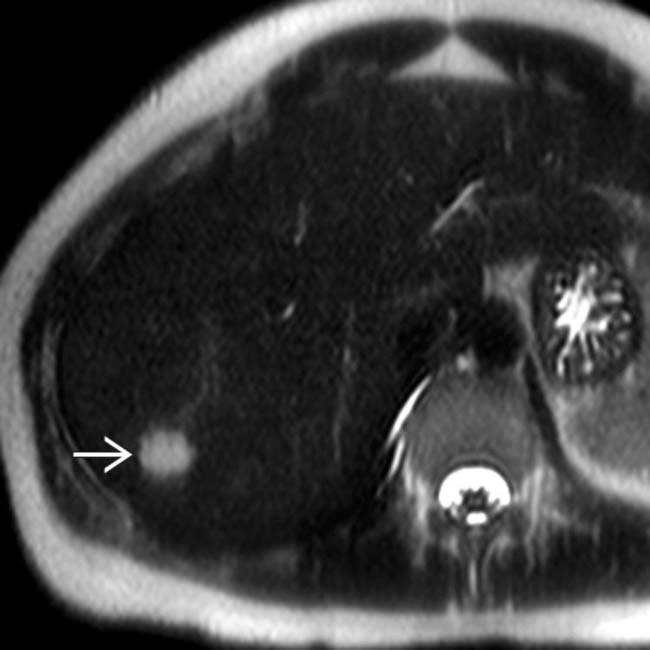
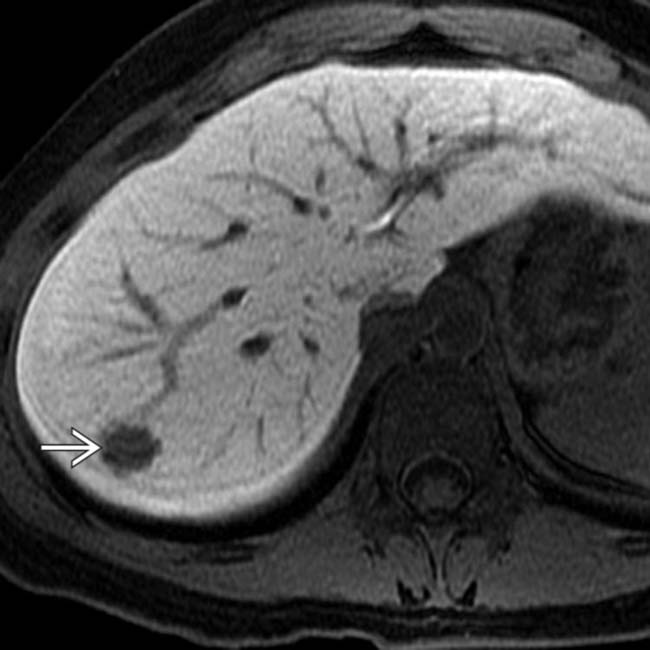
 is seen as hyperintense to normal liver.
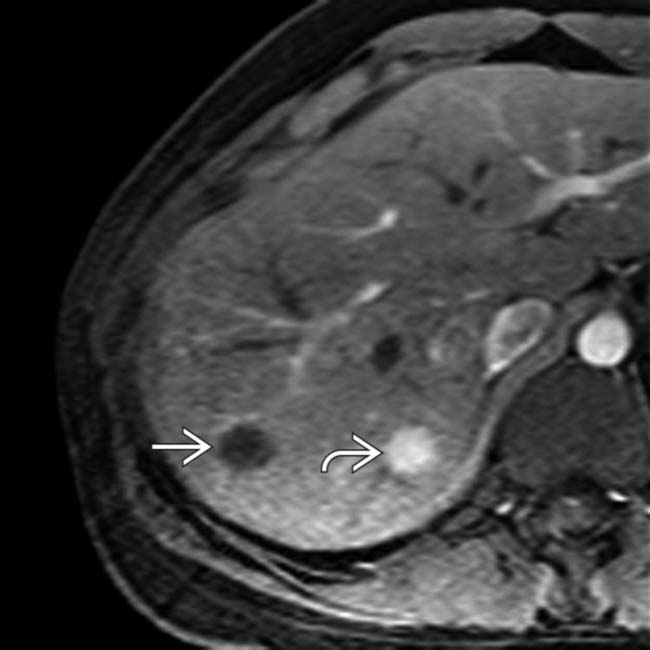
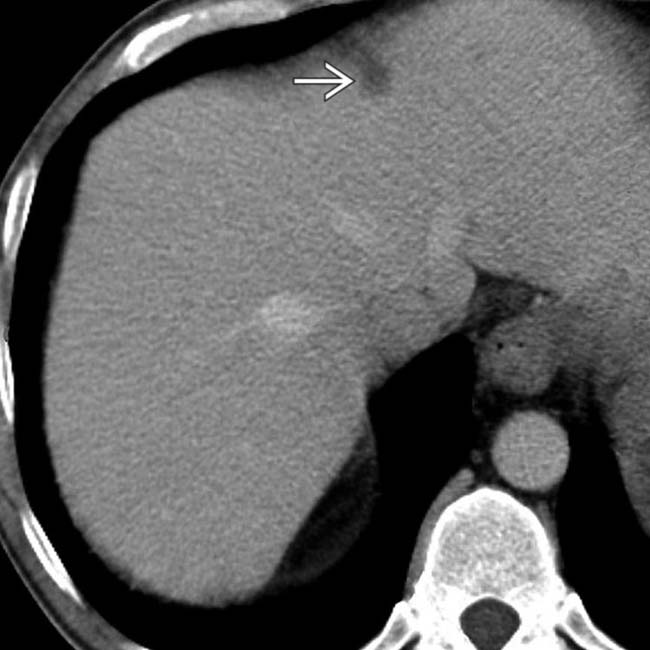
 is evident, typical of FNH. There is only subtle nodular, peripheral enhancement of the hemangioma
  .
.
 . The relatively subtle nodular enhancement of the hemangioma may be due to weak vascular enhancement by gadoxetate compared with other MR contrast agents.
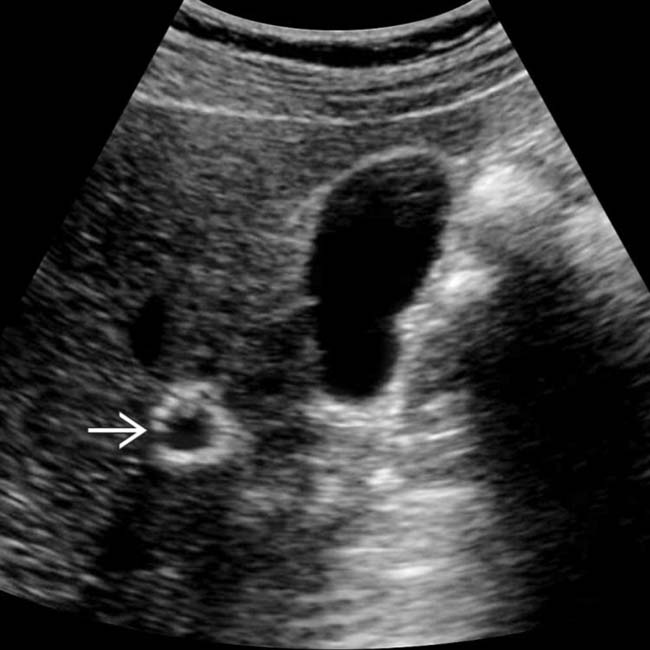
 with a very echogenic rim.
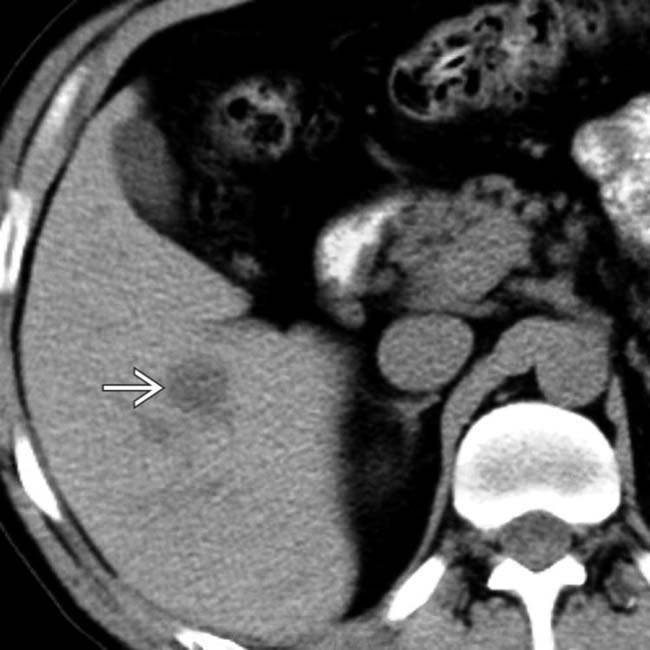
 is isodense with blood.
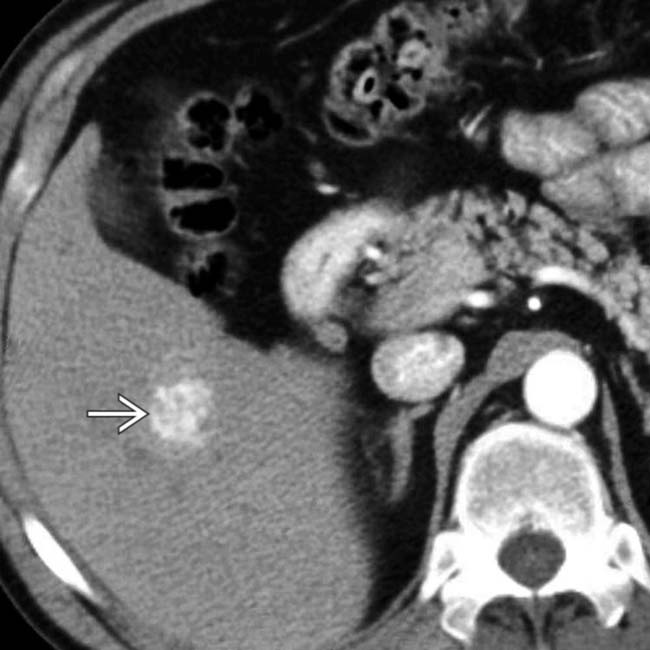
 that is nearly isodense with hepatic vessels.
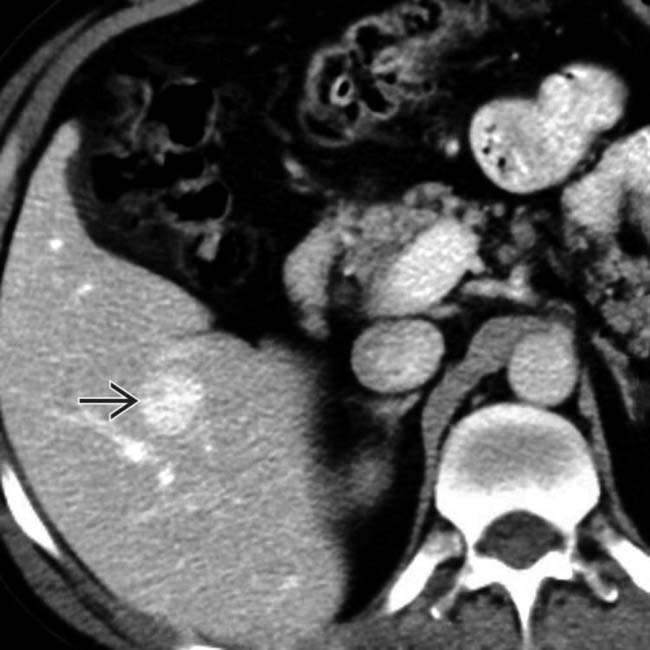
 is still isodense to blood vessels, unlike the lesion washout that would be expected with other hepatic tumors.
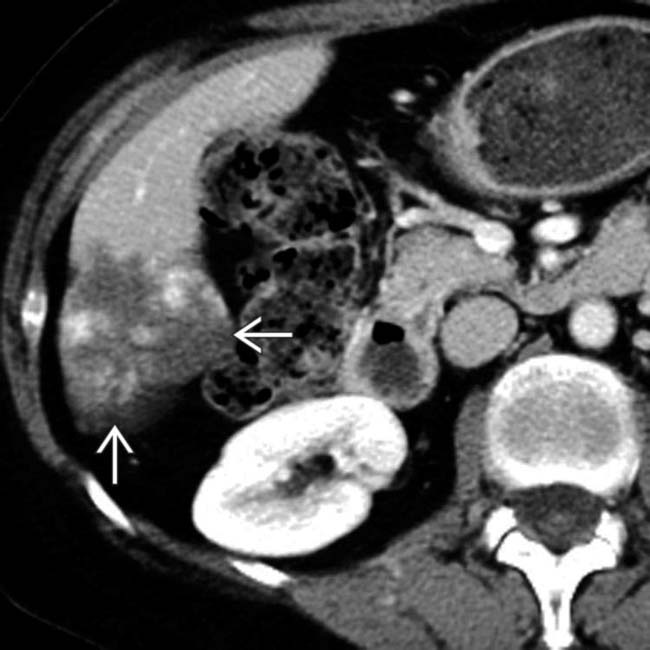
 arising from the right lobe of the liver. The mass has a nodular, peripheral, discontinuous pattern of enhancement that is isodense to hepatic blood vessels, identifying it as a cavernous hemangioma.
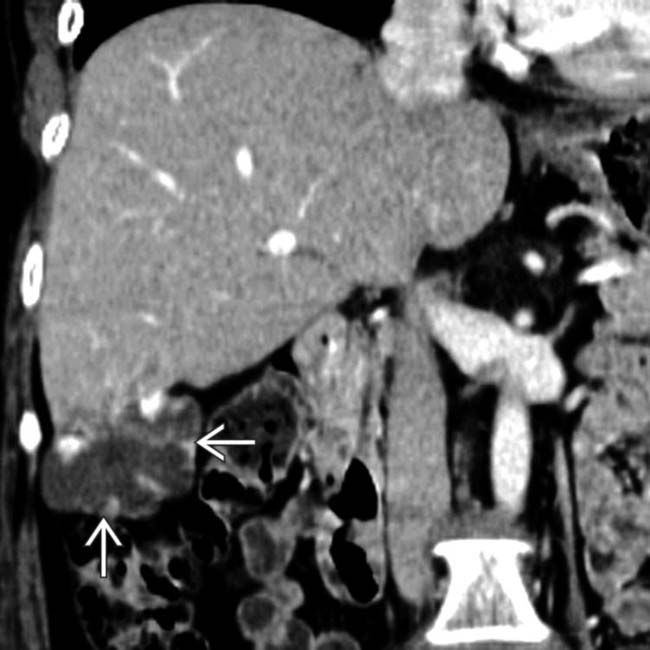
 as “suspended” from the right lobe of the liver. The exophytic and exposed position of this lesion would make it more susceptible to trauma. This hemangioma was resected.
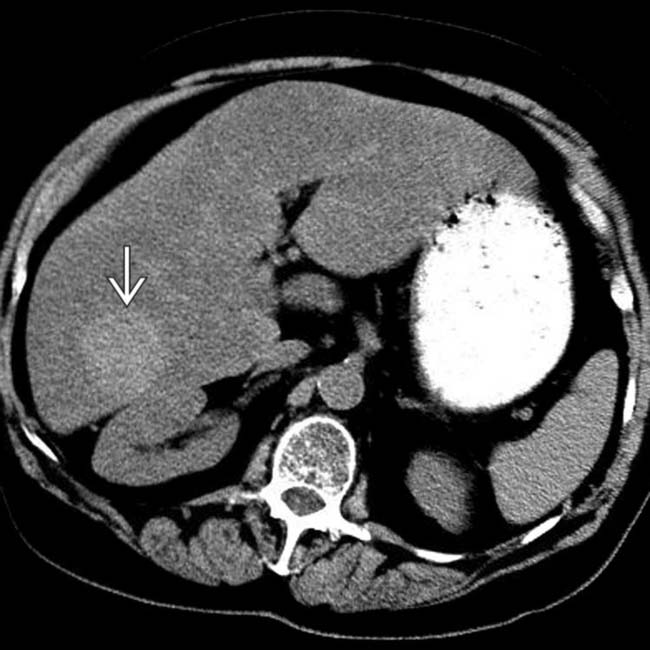
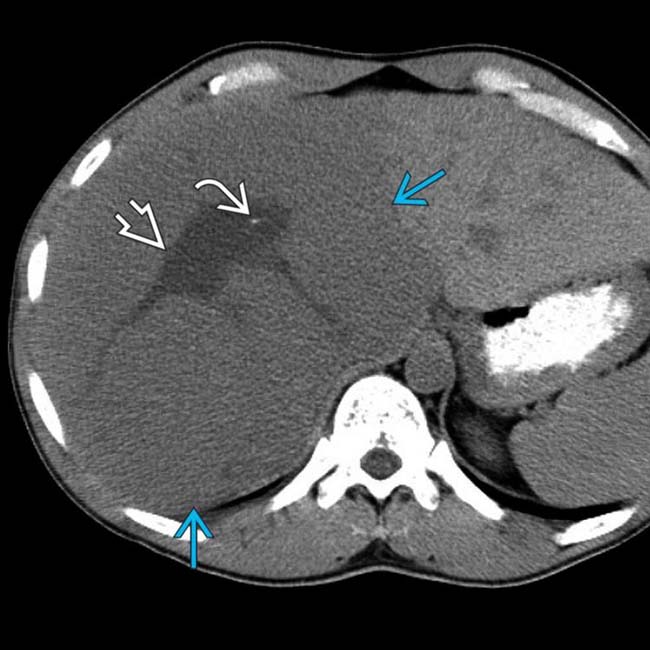
 that is hyperdense to the liver, which is itself hypodense to the spleen, indicating steatosis (fatty infiltration). The mass is nearly isodense with blood pool, such as the aorta.
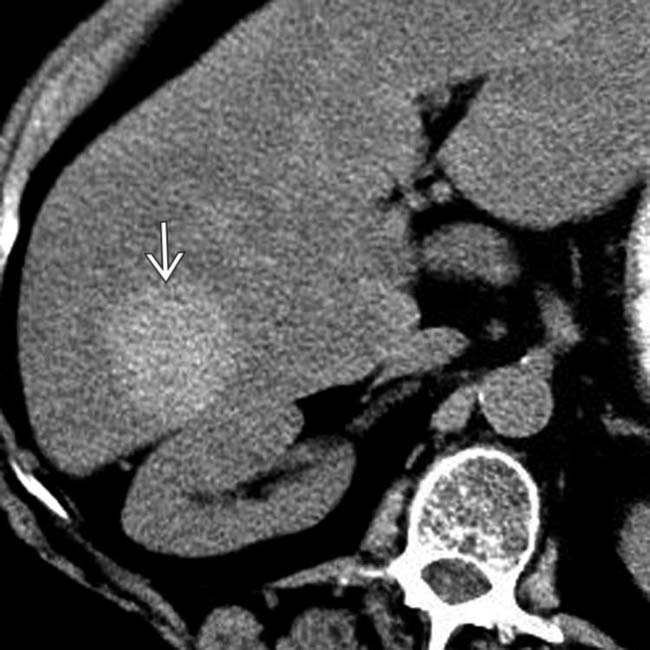
 as a homogeneous lesion that is hyperdense to the fatty liver but isodense to blood pool.
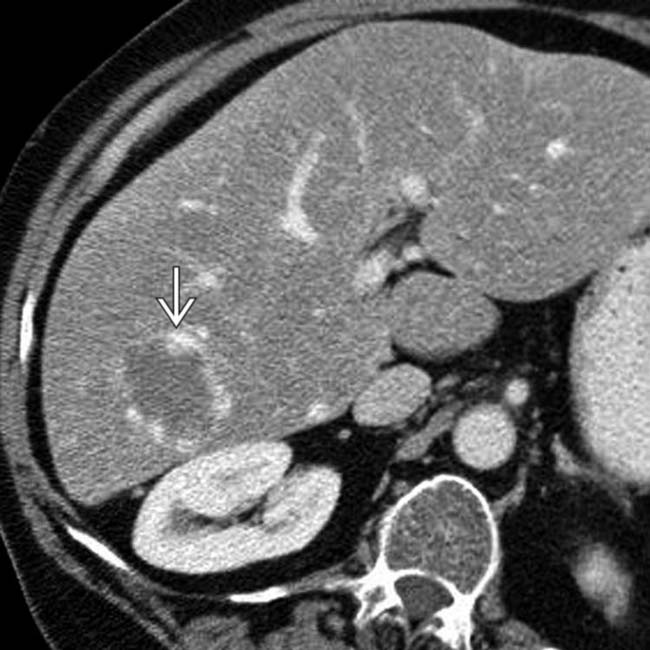
 , with the enhanced portions remaining isodense with vessels.
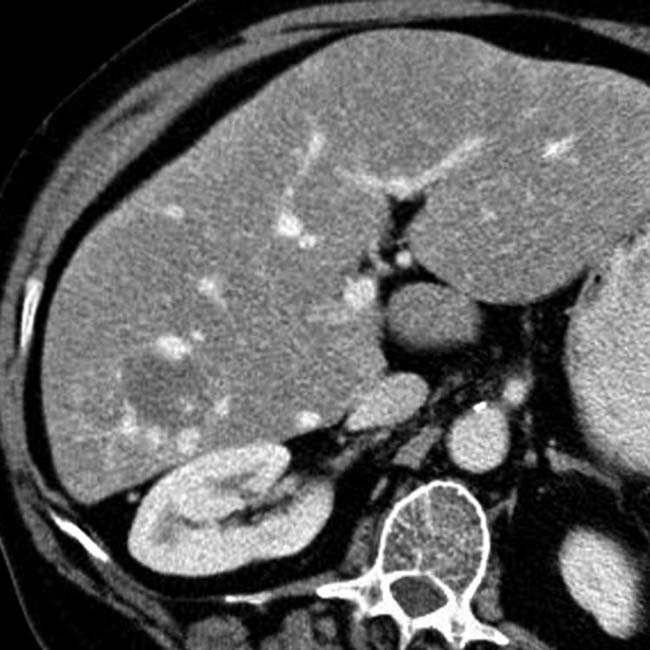
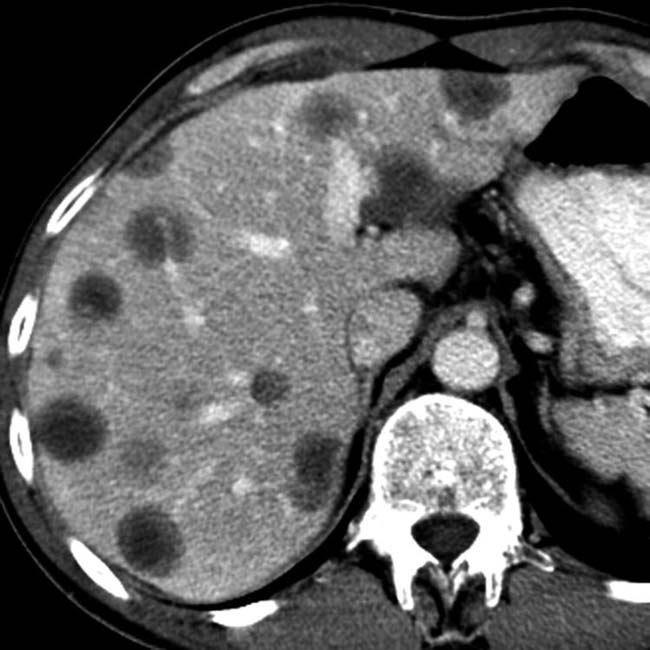
 within a normal-appearing liver. There is little apparent flow within the lesions as compared with hepatic vessels.
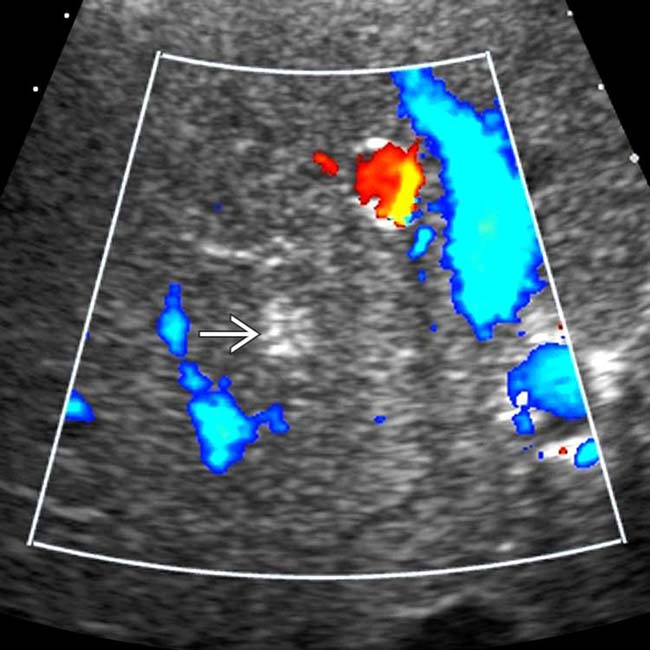
 . In a healthy person with no known tumor, these findings can be considered essentially diagnostic of small cavernous hemangiomas.
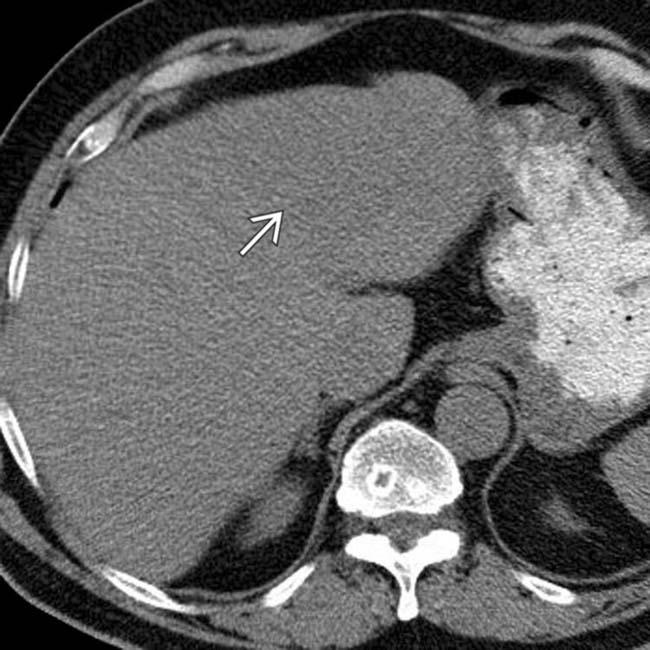
 that is homogeneous and nearly isodense to blood vessels and liver.
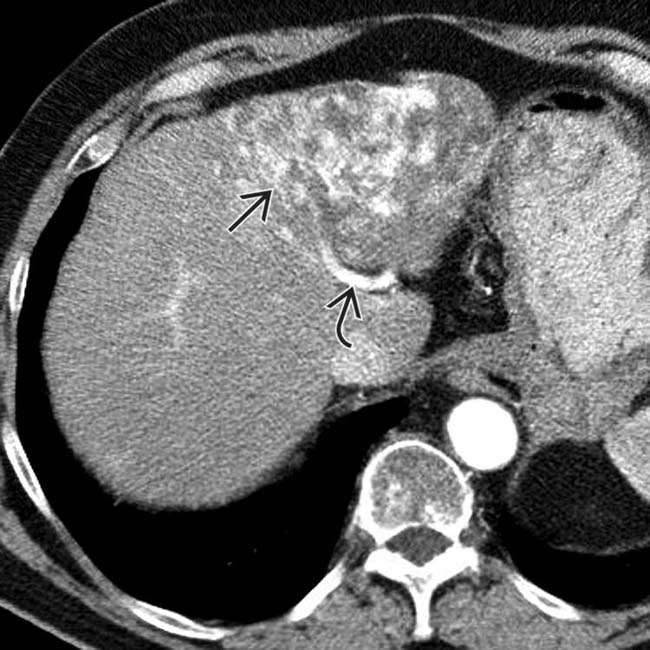
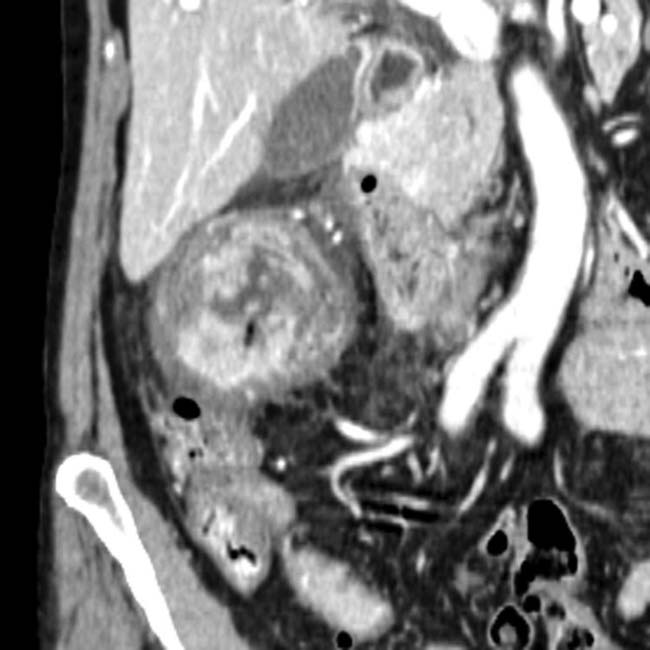
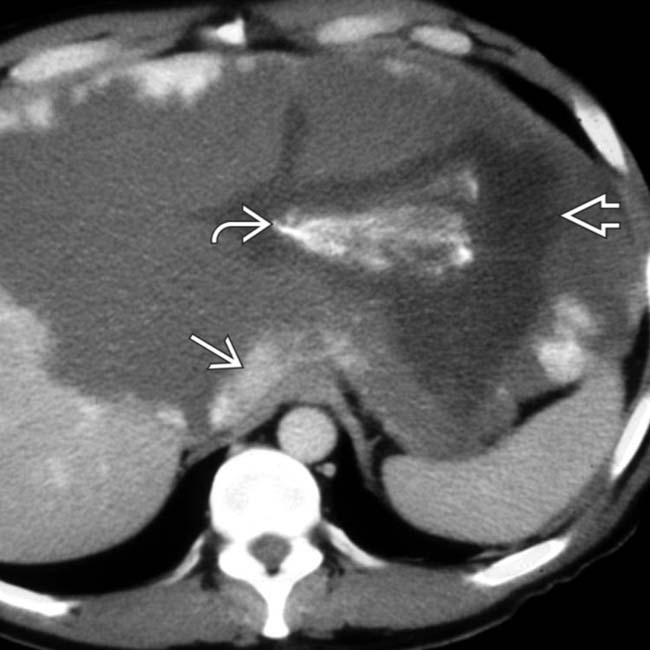
 enhances heterogeneously with some areas appearing nodular or cloud-like, but not showing the typical peripheral, centripetal enhancement pattern of most hemangiomas. Note the large hepatic artery
  .
.
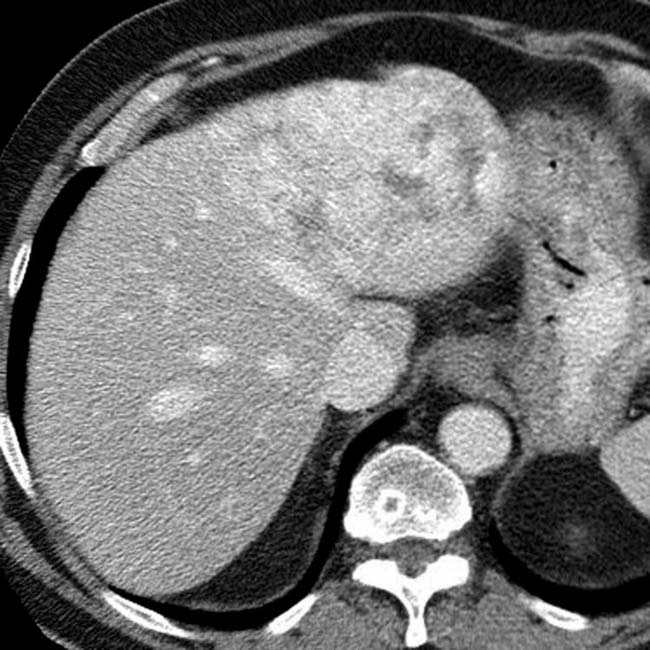
 in the liver.
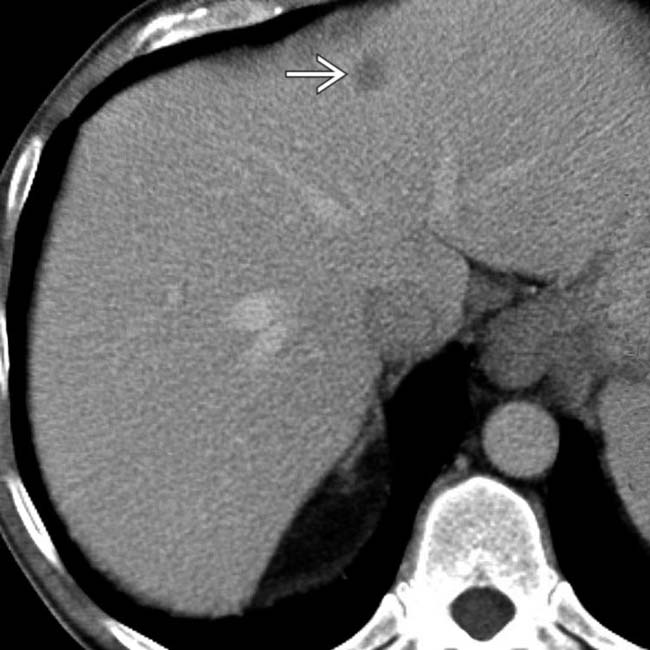
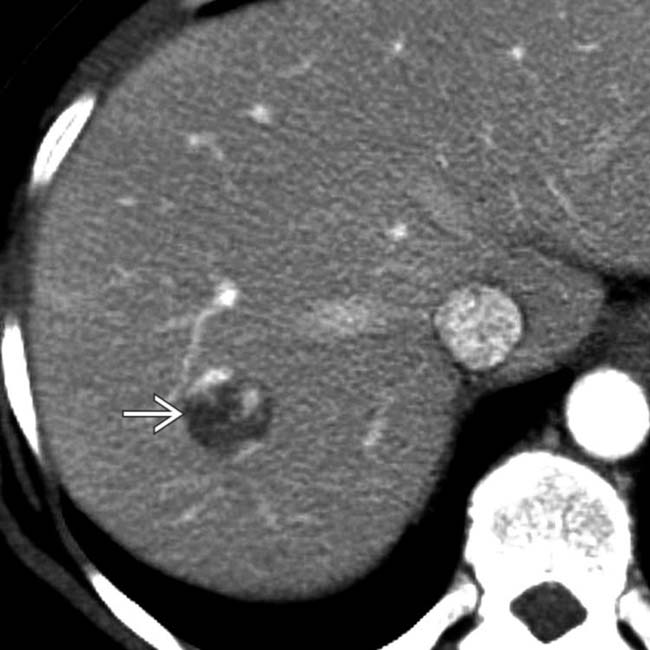
 in the same patient. On an abdominal MR study several years prior (not shown), this lesion had all the characteristic features of a cavernous hemangioma. Many authorities believe that “solitary necrotic nodule” is the end result of fibrosis or sclerosis of a cavernous hemangioma.
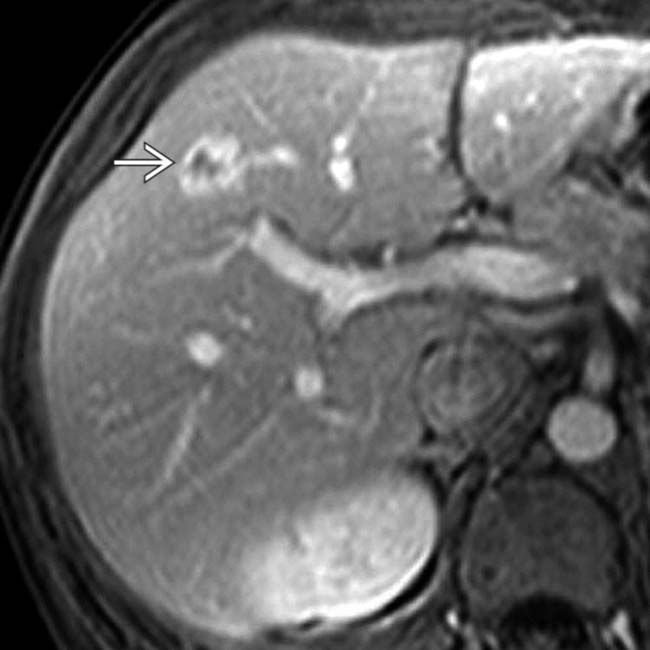
 with solid ring enhancement, an unusual feature for cavernous hemangioma.
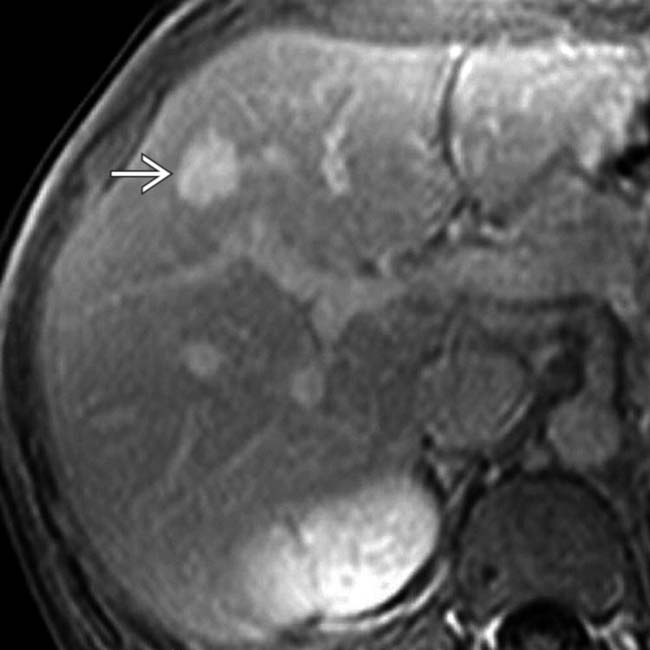
 in the same patient demonstrates rapid and complete fill-in on the portal venous phase image and remained isointense to blood pool on delayed phase images rather than washing out, as would be expected for most malignant hepatic masses.
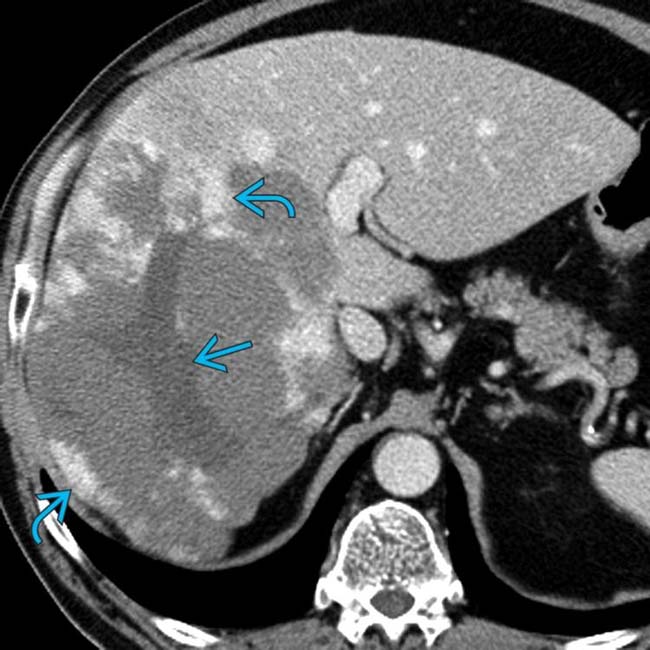
 and a nonenhancing central scar
  . This was a proven giant hemangioma.
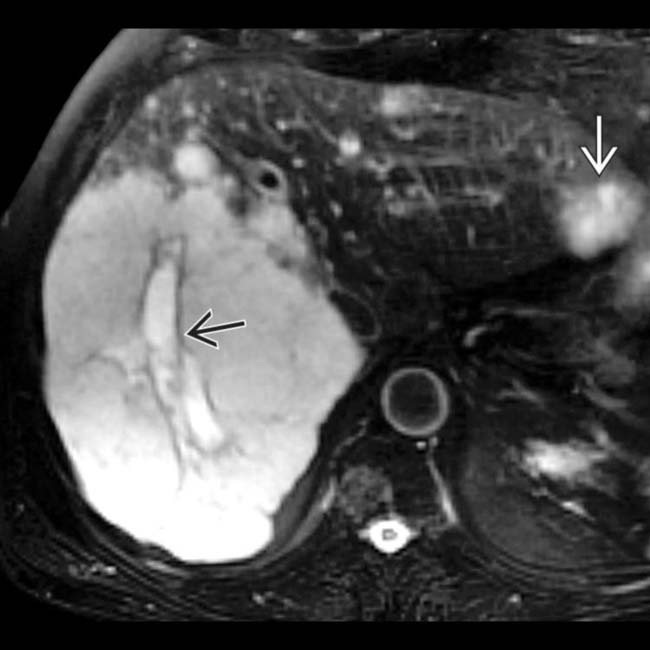
 that is even more intense. Several other hemangiomas were also noted
  .
.
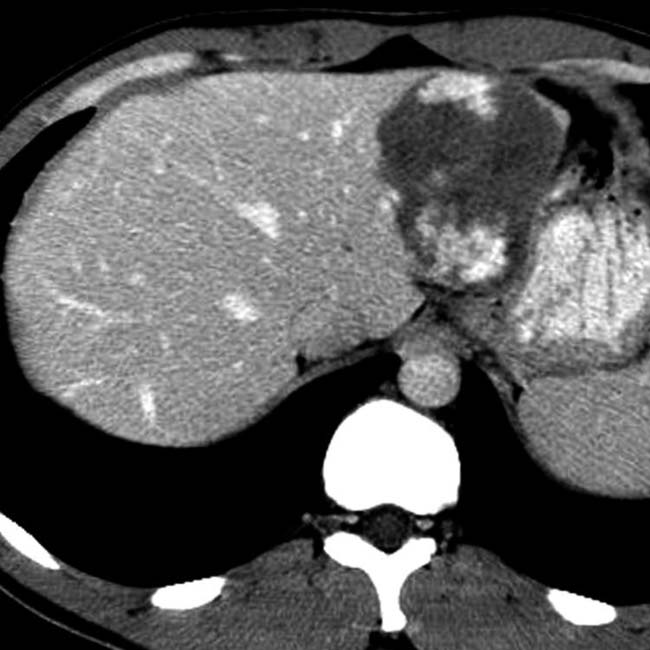
 that fills the right lobe of the liver. Most of the mass is isodense with blood pool, except for a central scar
  that has a small focus of calcification
  .
.
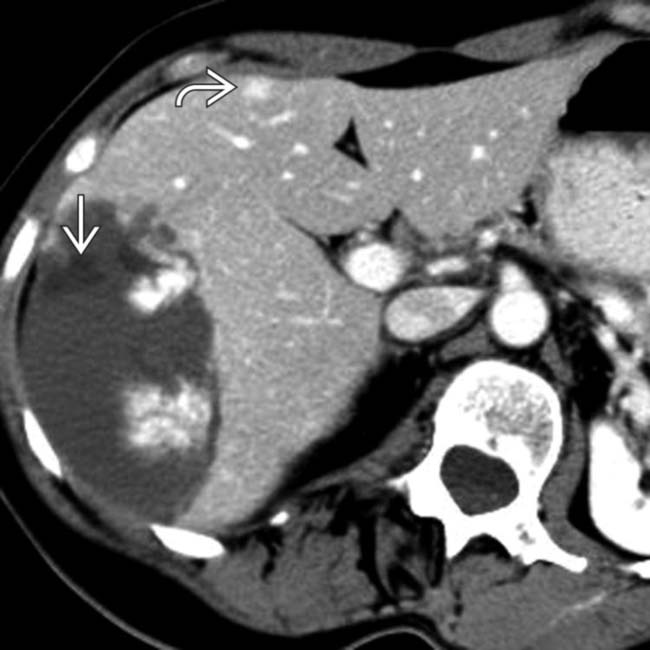
 identifies this as a hemangioma. Like most giant hemangiomas, it has an eccentric fibrosed scar
  and a focus of calcification
  within the scar.
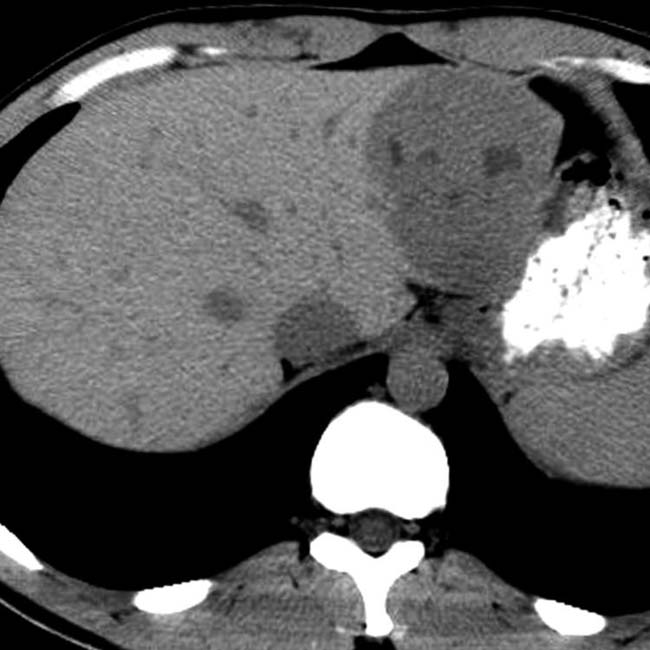
 . Note the capillary hemangioma
  isodense to vessels in all phases.