[level-membership-for-critical-care-medicine-category]36
Hemodynamic monitoring considerations in the intensive care unit
William Harvey: De motu cordis. In The circulation of the blood and other writings (1628), translated by Kenneth J. Franklin (1957), Chapter 8, pp 57-58.
Overview
In critical care, the goals of hemodynamic monitoring include mainly detection of cardiovascular insufficiency and diagnosis of the underlying pathophysiology. At the bedside, clinicians are faced with the challenge of translating concepts such as preload, contractility, and afterload into determinants of stroke volume and hence cardiac output. Ultrasound and echocardiography offer unique insight into ventricular filling and systolic function. In recent years there has been a general trend away from invasive hemodynamic monitoring. This was initially motivated by published data suggesting an association between the pulmonary artery catheter (PAC) and excess mortality in critically ill patients.1 Despite specific risks, subsequent randomized controlled trials have not sustained the concerns about excess mortality.2 The PAC should not be regarded as obsolete.
Hemodynamic monitoring devices
An overview of critical care hemodynamic monitoring would be incomplete without putting ultrasound in the context of the techniques available for estimating cardiac output, including nonultrasonic modalities. This broader topic is covered well in the literature3 and is outlined only briefly here. Demonstrating an association between any monitoring modality and improved outcome is challenging. Monitoring must be coupled with an effective change in therapy for a positive association to be observed. Clinical practice is characterized by the subtleties of interpretation, ongoing review, and titration of therapy to response. This does not translate easily into large-scale, randomized, controlled trial designs.
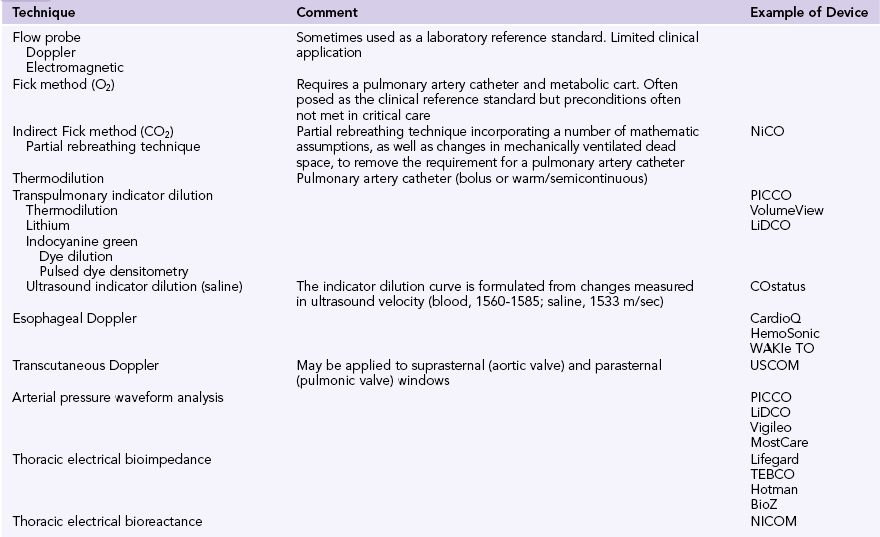
Any form of hemodynamic monitoring (Table 36-1) should be viewed as an adjunct to the clinical examination and must be interpreted as an integration of all available data.3–5 These may include the patient’s mental state, urine output, and peripheral perfusion (temperature and capillary refill time). Heart rate, arterial blood pressure, jugular venous pressure (or central venous or right atrial pressure [RAP]), and electrocardiography should also be incorporated. Other adjuncts to the interpretation of hemodynamic data might include Svo2, Scvo2, lactate, blood gases, capnography, gastric tonometry, or other assessment of the microcirculation.
Ultrasound indicator dilution is a novel application of ultrasound technology. Unlike transpulmonary thermodilution, which bases estimates of cardiac output on changes in blood temperature, ultrasound indicator dilution measures changes in ultrasound velocity. Normothermic isotonic saline is injected into a low-volume arteriovenous loop between arterial and central venous catheters. The change measured in ultrasound velocity (blood, 1560 to 1585; saline, 1533 m/sec) allows the formulation of an indicator dilution curve and calculation of cardiac output.6
Invasive hemodynamic monitoring
As mentioned previously, observational studies raised questions about increased morbidity and mortality with the use of PACs1; however, subsequent randomized trials indicated that PACs are generally safe and may yield important information.2 The PAC has a trailblazing role in defining cardiovascular physiology and pathophysiology. The method provides “cardiodynamic insight” that other hemodynamic monitoring technologies still fail to elucidate. A PAC is not a therapy and cannot affect the prognosis, but it can be used to guide therapy. The usual clinical indications for placement of a PAC are shown in Box 36-1.
Echocardiographic hemodynamic monitoring
A comprehensive echocardiographic examination is time-consuming. In the management of potentially unstable, critically ill patients, physicians will often prefer to focus their examination on pertinent variables. Several focused hemodynamic echocardiographic protocols have been developed and applied. Among others, these protocols include FOCUS (focused cardiac ultrasound7), ELS (Echo in Life Support8) and HART scanning (hemodynamic echocardiographic assessment in real time9).
As well as being minimally invasive (transesophageal [TEE]) or noninvasive (transthoracic [TTE]), echocardiography also offers unique diagnostic insight into a patient’s cardiovascular status. The presence of intracardiac shunts renders many hemodynamic monitoring devices invalid. Such shunts may be difficult to diagnose without echocardiographic techniques. Likewise, pericardial effusions, collections, and tamponade can also be difficult to diagnose without echocardiography.
Volumetric techniques
Doppler techniques
Doppler flow transducers and monitoring devices
Numerous compact devices based on Doppler principles (using either PWD or CWD) are available to critical care physicians (see Table 36-1). Differences exist in the site of application (transthoracic or transesophageal) and determination of the CSA of flow (estimated from 2D imaging or a normogram).
Echocardiography
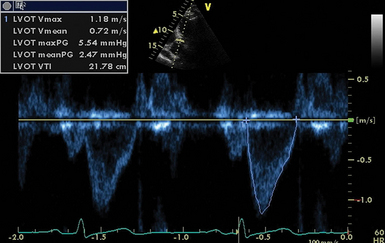
Echocardiography can incorporate both PWD and CWD techniques. For patients in sinus rhythm, data from 3 to 5 cardiac cycles may be averaged; however, in patients with irregular rhythms such as atrial fibrillation, 5 to 10 cycles may be required to ensure that the results are accurate. It is essential that CSA (2D echocardiography) be measured reliably at the same site as the VTI (Doppler) while keeping in mind that accurate measurement of flow diameter (to calculate CSA) and flow velocity (VTI) potentially requires a perpendicular transducer alignment (Figure 36-1). The sites recommended for determining stroke volume are the LV outflow tract (LVOT) or aortic annulus, the mitral annulus, and the pulmonic annulus.
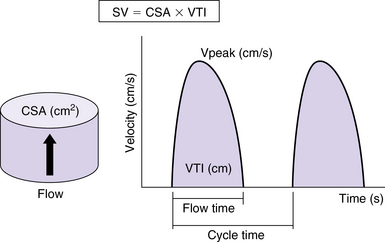
Figure 36-1 Calculation of stroke volume with Doppler. The cross-sectional area of flow (CSA) is calculated as a circle from echocardiographic measurements or from nomogram-based estimations. The velocity-time integral (VTI) is the integral of Doppler velocity with regard to time. Stroke volume (SV) is calculated as the product of CSA and VTI (mL/sec in this example). Cardiac output is calculated as the product of SV and heart rate. Peak velocity of flow (Vpeak) is also indicated. (Used with permission from Sturgess DJ. Haemodynamic monitoring. In Bersten A, Soni N, editors: Oh’s intensive care manual, ed 7, Sydney, Butterworth Heinemann, in press.)
Pulsed wave doppler.
PWD is used in combination with 2D echocardiography to measure flow at discrete sites. The LVOT is the most widely used site. The aortic annulus is circular and the diameter is measured on a zoomed parasternal long-axis view. Measurement is performed during early systole and bridges (inner edge to inner edge) from the junction of the aortic leaflets anteriorly with the septal endocardium and posteriorly with the mitral valve (Figure 36-2). The largest of three to five measurements should be used to avoid underestimation because of the tomographic plane.
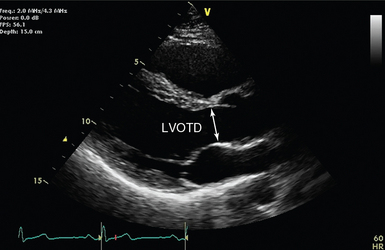
Figure 36-2 Parasternal long-axis view (transthoracic echocardiography) with the left ventricular outflow tract diameter (LVOTD) indicated by an arrow. The current view is not zoomed, to improve appreciation of the nearby anatomy.
LV outflow velocity is usually recorded from an apical five-chamber view, with the sample volume positioned just about proximal to the aortic valve. The closing click of the aortic valve (but not the opening click) is often seen when the sample volume is correctly positioned (Figure 36-3).
Continuous wave doppler.
Unlike PWD, CWD records the velocities of all blood cells moving along the path of the ultrasound beam (see Chapter 1). The CWD recording therefore consists of a full spectral envelope with the outer border corresponding to the fastest moving blood cells. In CWD the velocities are always measured from the outer border (velocity envelope). In addition to the sites named for PWD, CWD is also used from the suprasternal notch to measure flow velocity in the ascending aorta.
The main limitation of CWD is that the velocity envelope reflects only the highest velocities, with all other velocity information being obscured. In turn, this represents flow only through the smallest CSA. This narrowest point may be difficult to localize or measure and may not be obvious on 2D images. For instance, CWD across the LVOT will usually reflect flow through the aortic valve rather than the annulus. The actual valve area (best approximated by an equilateral triangle) is challenging to visualize and measure with 2D TTE.
Noncardiac ultrasound hemodynamic monitoring
Additional hemodynamic data can be derived from noncardiac ultrasound, including the integration of lung ultrasound and superior (SVC) and inferior (IVC) vena cava analysis (respiratory variations) in hemodynamic monitoring. Noncardiac ultrasound methods are analyzed extensively elsewhere (see Chapters 39 to 42).
In brief, characteristic artifacts on lung ultrasound (B-lines) reflect underlying interstitial pulmonary edema and presumably an associated hemodynamic disturbance. The sonographically detected interstitial syndrome (“wet lung”) may appear at a preradiologic and preclinical stage (see Chapters 20 to 25). In contrast, the presence of solely A-lines (artifacts representing reflections of the pleural line) in hemodynamic terms reflects a “dry lung” or normal profile. The latter has been used to underpin cases of redistributive shock (e.g., septic shock) in the FALLS protocol (fluid administration limited by lung sonography).11 However, one of the main diagnostic difficulties is that septic patients in the intensive care unit (ICU), who usually require fluid therapy, may well have a B-line profile because of various factors (e.g., pulmonary infection, acute respiratory distress syndrome, mixed type of pulmonary edema in which a cardiac component is integrated as well). Therefore, suggestions were made to incorporate Doppler and tissue Doppler echocardiographic indices (e.g., mitral flow E/E ratio) as measures of LV filling pressure in an effort to further clarify lung ultrasound-derived hemodynamic profiles.11 Further analysis of this perspective is beyond the scope of this chapter.
Analysis of the sonographically detected respiratory variations in SVC and IVC size and diameter is a dynamic method that can be used for hemodynamic ICU monitoring. The aforementioned variations may at least partially reflect RAP and therefore right ventricular filling pressure. In a spontaneously breathing patient, estimation of RAP is improved by M-mode evaluation of IVC diameter and response to a brief sniff. A small IVC (1.2 cm) with spontaneous collapse suggests hypovolemia. Normally, the IVC is less than 1.7 cm, and normal inspiratory collapse (≥50%) suggests normal RAP (0 to 5 mm Hg). A mildly dilated IVC (>1.7 cm) with normal inspiratory collapse suggests mildly elevated RAP (6 to 10 mm Hg). Inspiratory collapse of less than 50% suggests RAP of 10 to 15 mm Hg. A dilated IVC without inspiratory collapse suggests RAP higher than 15 mm Hg. Notably, more refined vena cava analysis algorithms have been implemented in mechanically ventilated patients (Chapters 39 and 40). In general, dynamic indices of cardiac preload (e.g., respiratory variations in Doppler-derived indices of aortic flow or vena cava analysis) and dynamic tests (e.g., the expiratory pause in mechanical ventilation or passive leg raising) are preferred over static indices for prediction of fluid responsiveness in the ICU.
The hola (holistic approach) ultrasound concept in hemodynamic monitoring
In terms of pathophysiology, two critical parameters may be used to optimize noninvasive hemodynamic monitoring in the ICU. The first refers to the ability to “pinpoint” the hemodynamic status of an individual patient as an exact spot on the Frank-Starling curve (and track the spot’s path on the curve) during various therapeutic interventions (e.g., fluid loading, diuresis, changes in body posture). In this case the interventions represent a dynamic element that can be used to detect changes in various ultrasound-derived parameters (e.g., B-lines on lung ultrasound or respiratory variations in aortic flow VTI). The Starling curve relates stroke volume to end-diastolic ventricular volume (EDV). EDV is determined by transmural pressure, which is the difference between LV intracavitary end-diastolic pressure and pericardial constraint. When determining where a patient is on the Starling curve, these two confounding pressures must always be considered in a critically ill patient. Should the patient move along the Starling curve toward more cardiac output, was it because transmural pressure increased, and if so, did LV end-diastolic intracavitary pressure increase or did pericardial constraint decrease? The major issue when implementing dynamic elements in the equation is timing. For example, it takes time to identify the possible effects of fluid loading or diuresis on various ultrasound-derived parameters. Moreover, dynamic maneuvers that are considered to have a rather more “acute” effect (e.g., passive leg raising or expiratory pause in mechanical ventilation) are subject to various limitations. Our group is testing the recently introduced thigh cuff technology (Braslet-M) as a dynamic maneuver because of the fact that most of its effect on central hemodynamics is almost immediate (Figure 36-4).12 Ultrasound should be helpful in determining the effect of acute hypovolemia induced by cuffs. In the case of volume overload and poor diastolic filling (reduced LV transmural pressure in the presence of increased RAP and pulmonary edema), reduced RAP and improved pulmonary edema are seen with increased EDV. This effect is identical to what occurs with the administration of nitroglycerin except for the absence of a confounding drop in afterload. Furthermore, release of the cuffs should generate an opposite effect. This same pericardial-ventricular interaction can be seen with high pulmonary vascular resistance such as pulmonary embolism. If thigh cuffs acutely improve the cardiac indices and LV EDV seen on echocardiography and reduce septal shift, volume loading of this patient to improve LV EDV might not be the preferred therapy.13 Echocardiography provides real-time insight into the dynamic cardiac changes incurred by thigh cuff–induced fluid sequestration and subsequent release. Furthermore, other relatively load-independent parameters (e.g., Tei index) may be used to evaluate myocardial performance during the aforementioned dynamic bedside interventions.14 The real-time combination of invasive monitoring, ultrasound, and bedside interventions should be investigated further.
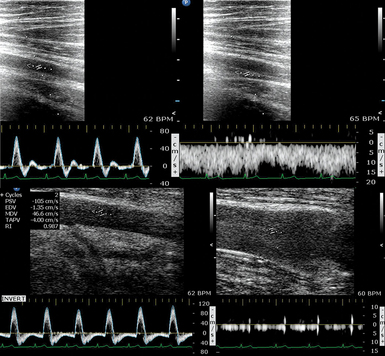
Figure 36-4 A healthy volunteer is lying supine at −30 degrees (head-down tilt) and wearing thigh cuffs (Braslet-M, Kentavr-Nauka, Moscow, Russia) tightened to an average skin-level pressure of approximately 35 mm Hg. However, the amount of pressure applied can be individualized until venous stasis is identified sonographically. The device remains tightened for only a few minutes and is immediately removed once an effect on central hemodynamics is registered (e.g., previous studies in healthy volunteers have depicted significant changes in parameters such as left ventricular stroke volume, E mitral velocity, lateral é on tissue Doppler imaging, right Tei index, and internal jugular vein area in just 10 minutes after the thighs were restrained).12 Top images, Normal flow in the femoral artery and vein before inflation of the cuffs. Bottom images, A distended femoral vein with a distinctively hyperechoic lumen because of rouleaux formation in stasis conditions (slow steady flow is preserved in the real-time ultrasound used for monitoring). The Doppler waveform of the femoral artery shows diastolic flow reversal secondary to venous stasis (a dramatic increase in vascular resistance!). These images show sequestration of a large volume of blood in the lower extremity. Further tightening of the Braslet would create unsafe conditions that could possibly affect perfusion after interstitial edema eventually developed and therefore cannot be sustainable for long periods. In general, thigh cuffs should be used for only a very short time in patients and only for vital indications in those with coagulation disorders or a history of venous thrombosis for obvious reasons. Further analysis is beyond the scope of this chapter. (Images courtesy Braslet Investigation Grant Experiment Team, National Space Biomedical Research Institute Grant No. SMST1602, 2011.)
The multimodal (integrating lung ultrasound, vena cava analysis, and echocardiography) HOLA ultrasound concept could well operate on binary logistics such as guiding fluid resuscitation with the intention of avoiding alveolar edema (“wet lung”) and impaired gas exchange or optimizing diuretic therapy in patients with cardiogenic (or mixed-type) pulmonary edema. These and some additional ultrasound-derived static and dynamic components are being considered thoroughly by our team for integration into a theoretic model and a resultant straightforward algorithm that will, we hope, be presented in the second edition of this textbook.
Pearls and highlights
• Hemodynamic monitoring must be interpreted in the clinical context as an integration of all available data.
• Hemodynamic monitoring is not therapy, but it can guide therapy.
• Ultrasound and echocardiography complement other hemodynamic monitoring modalities by either aiding catheterization or providing additional information to aid in interpretation.
• Determining where a patient is on the Frank-Starling curve and monitoring alterations in cardiovascular morphology provide vital hemodynamic information.
• Ultrasound techniques for evaluating stroke volume and cardiac output include volumetric (linear, 2D, and 3D) techniques, as well as Doppler applications.
• Placement of a PAC is still indicated in certain patients because it may yield useful hemodynamic information.
• Lung ultrasound and vena cava analysis can be used in conjunction with echocardiography for noninvasive monitoring of volume status.
• All invasive and noninvasive hemodynamic monitoring methods have limitations.
References
1. Connors, AF, Jr., Speroff, T, Dawson, NV, et al. The effectiveness of right heart catheterization in the initial care of critically ill patients. SUPPORT Investigators. JAMA. 1996; 276:889–897.
2. Rajaram, SS, Desai, NK, Kalra, A, et al. Pulmonary artery catheters for adult patients in intensive care. Cochrane Database Syst Rev. 2, 2013. [CD003408].
3. Vincent, JL, Rhodes, A, Perel, A, et al, Clinical review: update on hemodynamic monitoring—a consensus of 16. Crit Car. 2011; 15:229.
4. Sturgess DJ. Haemodynamic monitoring. In: Bersten A, Soni N, Oh’s intensive care manual, ed 7, Sydney, Butterworth Heinemann, in press.
5. Sturgess, DJ, Pascoe, RL, Scalia, G, Venkatesh, B, A comparison of transcutaneous Doppler corrected flow time, b-type natriuretic peptide and central venous pressure as predictors of fluid responsiveness in septic shock: a preliminary evaluation. Anaesth Intensive Car. 2010; 38:336–341.
6. de Boode, WP, van Heijst, AF, Hopman, JC, et al, Cardiac output measurement using an ultrasound dilution method: a validation study in ventilated piglets. Pediatr Crit Care Me. 2010; 11:103–108.
7. Labovitz, AJ, Noble, VE, Bierig, M, et al, Focused cardiac ultrasound in the emergent setting: a consensus statement of the American Society of Echocardiography and American College of Emergency Physicians. J Am Soc Echocardiog. 2010; 23:1225–1230.
8. Hayhurst, C, Lebus, C, Atkinson, PR, et al, An evaluation of echo in life support (ELS): is it feasible? What does it add. Emerg Med . 2011; 28:119–121.
9. H.A.R.T, scan. Haemodynamic echocardiographic assessment in real time, 2012. Available at http://www.heartweb.com.au/workshops/hartscan, July 12, 2012. [Accessed].
10. Lang, RM, Badano, LP, Tsang, W, et al. EAE/ASE recommendations for image acquisition and display using three-dimensional echocardiography. J Am Soc Echocardiogr. 2012; 25:3–46.
11. Lichtenstein, D, Karakitsos, D. Integrating lung ultrasound in the hemodynamic evaluation of acute circulatory failure (the fluid administration limited by lung sonography protocol). J Crit Care. 2012; 27:533e11–533e19.
12. Hamilton, DR, Sargsyan, AE, Garcia, K, et al. Cardiac and vascular responses to thigh cuffs and respiratory maneuvers on crewmembers of the International Space Station. J Appl Physiol. 2012; 112:454–462.
13. Belenkie, I, Smith, ER, Tyberg, JV, Ventricular interaction: from bench to bedside. Ann Me. 2001; 33:236–241.
14. Tei, C, Nishimura, RA, Seward, JB, Tajik, AJ, Noninvasive Doppler-derived myocardial performance index: correlation with simultaneous measurements of cardiac catheterization measurements. J Am Soc Echocardiog. 1997; 10:169–178.
[/level-membership-for-critical-care-medicine-category][not-level-membership-for-critical-care-medicine-category]36
Hemodynamic monitoring considerations in the intensive care unit
William Harvey: De motu cordis. In The circulation of the blood and other writings (1628), translated by Kenneth J. Franklin (1957), Chapter 8, pp 57-58.
Overview
In critical care, the goals of hemodynamic monitoring include mainly detection of cardiovascular insufficiency and diagnosis of the underlying pathophysiology. At the bedside, clinicians are faced with the challenge of translating concepts such as preload, contractility, and afterload into determinants of stroke volume and hence cardiac output. Ultrasound and echocardiography offer unique insight into ventricular filling and systolic function. In recent years there has been a general trend away from invasive hemodynamic monitoring. This was initially motivated by published data suggesting an association between the pulmonary artery catheter (PAC) and excess mortality in critically ill patients.1 Despite specific risks, subsequent randomized controlled trials have not sustained the concerns about excess mortality.2 The PAC should not be regarded as obsolete.
Hemodynamic monitoring devices
An overview of critical care hemodynamic monitoring would be incomplete without putting ultrasound in the context of the techniques available for estimating cardiac output, including nonultrasonic modalities. This broader topic is covered well in the literature3 and is outlined only briefly here. Demonstrating an association between any monitoring modality and improved outcome is challenging. Monitoring must be coupled with an effective change in therapy for a positive association to be observed. Clinical practice is characterized by the subtleties of interpretation, ongoing review, and titration of therapy to response. This does not translate easily into large-scale, randomized, controlled trial designs.
Any form of hemodynamic monitoring (Table 36-1) should be viewed as an adjunct to the clinical examination and must be interpreted as an integration of all available data.3–5 These may include the patient’s mental state, urine output, and peripheral perfusion (temperature and capillary refill time). Heart rate, arterial blood pressure, jugular venous pressure (or central venous or right atrial pressure [RAP]), and electrocardiography should also be incorporated. Other adjuncts to the interpretation of hemodynamic data might include Svo2, Scvo2, lactate, blood gases, capnography, gastric tonometry, or other assessment of the microcirculation.
Ultrasound indicator dilution is a novel application of ultrasound technology. Unlike transpulmonary thermodilution, which bases estimates of cardiac output on changes in blood temperature, ultrasound indicator dilution measures changes in ultrasound velocity. Normothermic isotonic saline is injected into a low-volume arteriovenous loop between arterial and central venous catheters. The change measured in ultrasound velocity (blood, 1560 to 1585; saline, 1533 m/sec) allows the formulation of an indicator dilution curve and calculation of cardiac output.6
Invasive hemodynamic monitoring
As mentioned previously, observational studies raised questions about increased morbidity and mortality with the use of PACs1; however, subsequent randomized trials indicated that PACs are generally safe and may yield important information.2 The PAC has a trailblazing role in defining cardiovascular physiology and pathophysiology. The method provides “cardiodynamic insight” that other hemodynamic monitoring technologies still fail to elucidate. A PAC is not a therapy and cannot affect the prognosis, but it can be used to guide therapy. The usual clinical indications for placement of a PAC are shown in Box 36-1.
Echocardiographic hemodynamic monitoring
A comprehensive echocardiographic examination is time-consuming. In the management of potentially unstable, critically ill patients, physicians will often prefer to focus their examination on pertinent variables. Several focused hemodynamic echocardiographic protocols have been developed and applied. Among others, these protocols include FOCUS (focused cardiac ultrasound7), ELS (Echo in Life Support8) and HART scanning (hemodynamic echocardiographic assessment in real time9).
As well as being minimally invasive (transesophageal [TEE]) or noninvasive (transthoracic [TTE]), echocardiography also offers unique diagnostic insight into a patient’s cardiovascular status. The presence of intracardiac shunts renders many hemodynamic monitoring devices invalid. Such shunts may be difficult to diagnose without echocardiographic techniques. Likewise, pericardial effusions, collections, and tamponade can also be difficult to diagnose without echocardiography.
