Hemodynamic Monitoring
I Systemic Arterial Blood Pressure
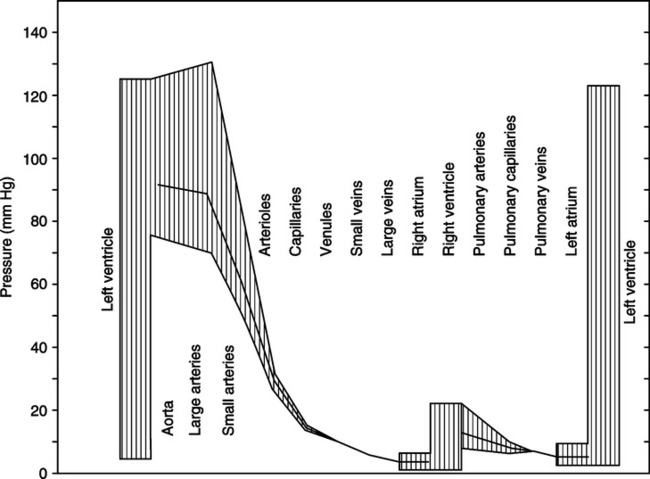
Systemic arterial blood pressure is expressed as a systolic pressure over a diastolic pressure (Figure 12-1).
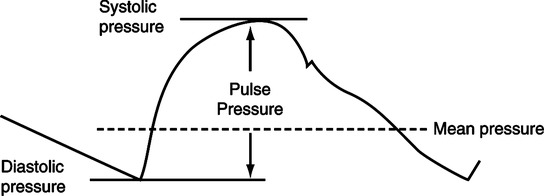
A Systolic pressure is the highest pressure attained in the artery and is determined by three major factors:
1. Stroke volume of left ventricle
a. Increased stroke volume generally causes increased systolic pressure.
b. Decreased stroke volume generally causes decreased systolic pressure.
B Diastolic pressure is the lowest pressure attained in the artery and is determined by three major factors:
1. Magnitude of preceding systolic pressure
a. In general, the higher the preceding systolic pressure, the higher the resulting diastolic pressure.
b. The lower the preceding systolic pressure, the lower the resulting diastolic pressure.
C Measurement of arterial blood pressure generally assesses left ventricular function by systolic pressure and peripheral resistance by diastolic pressure. The most significant factor responsible for systolic pressure is stroke volume, and the factor principally responsible for diastolic pressure is the state of peripheral resistance.
D Thus it is assumed that the greater the difference between systolic and diastolic pressures, the greater the resultant flow. The difference between systolic and diastolic pressures is called the pulse pressure.
< ?xml:namespace prefix = "mml" />
 (1)
(1)2. Therefore widening of pulse pressure is generally thought to indicate increased blood flow 
3. By the opposite mechanism, narrowing of pulse pressure is generally thought to indicate decreased flow.
4. It should be noted that widening of pulse pressure could occur without increased blood flow. Normal blood flow also can exist with a narrow pulse pressure. These phenomena occur by alterations in the other factors (i.e., diastolic interval and arterial elasticity) that determine systolic and diastolic pressure. Therefore it is imperative to assess all factors responsible for systolic and diastolic pressure before blindly stating that an increased or decreased pulse pressure represents increased or decreased blood flow in a given patient.
5. In the absence of pulmonary artery catheterization and/or serial cardiac output measurements, the trend in pulse pressure is used as a gross indicator of trends in cardiac output.
E The mean arterial pressure (MAP) represents the average pressure over one complete systolic and diastolic interval.
1. The MAP can be directly measured via a systemic arterial line or estimated by the following formula:
 (2)
(2)2. The MAP is the average pressure in the arterial tree over a given time and therefore generally is used to assess the average pressure to which the arterial system is exposed.
3. The pressure gradient across the systemic circulation is generally expressed as MAP – central venous pressure (CVP; see Section II, Central Venous Pressure).
4. The MAP is also commonly used as an indicator of left ventricular afterload, thus representing the resistance (in terms of pressure) against which the left ventricle must pump.
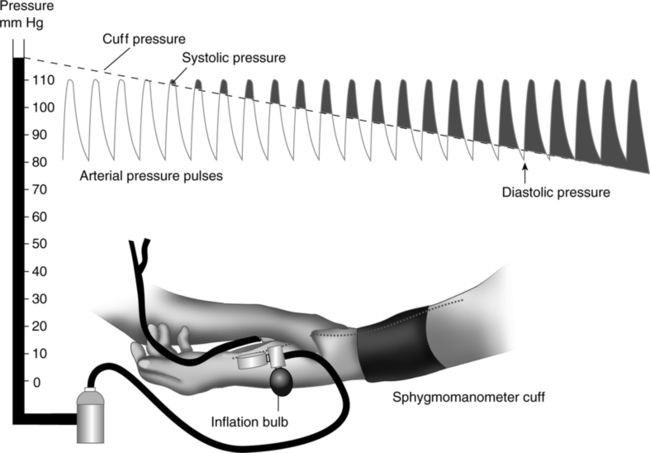
F Arterial blood pressure and mean arterial blood pressure can be directly measured by an intraarterial line (catheter). Alternately arterial blood pressure can be indirectly measured using a sphygmomanometer (Figure 12-2), and the MAP can be calculated from the obtained systolic and diastolic values.
G Normal values for arterial blood pressure in the adult are as follows:
| Systolic: | 90 to 140 mm Hg |
| Diastolic: | 60 to 90 mm Hg |
| Mean: | 70 to 105 mm Hg |
The CVP usually is expressed as a single number representing the mean right atrial pressure 
A The numerical pressure value of CVP is the result of the following factors:
1. The pump capabilities of the right side of the heart in part determine the CVP. If the right ventricle pumps what it receives, blood will not back up in the atrium, and the CVP should be normal. If the right side of the heart is not pumping adequately, there will be a backup of blood in the atrium that will be reflected in elevated CVP.
2. The venous tone determines CVP because venous tone is responsible for determining the venous vascular space. It thus has major implications in venous return and filling pressure of the right atrium.
3. Blood volume, which in part determines CVP, must be adequate to fill the venous vascular space, or venous return to the heart will be impeded.
4. If the pump capabilities of the right side of the heart are adequate, the CVP will directly reflect the venous vascular volume (blood volume)-to-venous vascular space relationship. Fluid therapy and diuresis are frequently gauged in terms of the CVP’s reflection of this relationship.
B The CVP is commonly used as an indicator of right ventricular preload when measured as the right ventricular end-diastolic pressure (RVEDP).
1. The RVEDP represents compliance of the right ventricle.
2. The RVEDP also represents the filling pressure necessary for the ensuing right ventricular contraction.
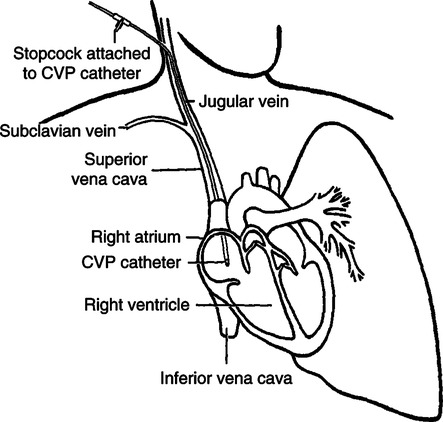
C The CVP is measured directly through a catheter inserted in a peripheral vein that traverses the vena cava with its tip resting in the right atrium (Figure 12-3) or from a four-lumen pulmonary artery catheter having a proximally located open channel in the right atrium (see Figure 12-8).
III Pulmonary Artery Pressure (PAP)
The PAP is expressed as systolic pressure over diastolic pressure.
A Systolic pressure is the highest pressure attained in the pulmonary artery and is determined by the same three factors that determine systolic pressure in the systemic arterial system:
B Diastolic pressure is the lowest pressure attained in the pulmonary artery and is determined by the same three factors that determine diastolic pressure in the systemic arterial system:
1. Magnitude of preceding systolic pressure
2. Length of ventricular diastolic interval
3. State of peripheral resistance of the pulmonary arterial tree.
C Measurement of PAP generally assesses right ventricular function by systolic pressure and pulmonary arterial resistance by diastolic pressure. Thus PAP is used in precisely the same fashion as systemic arterial pressure. In this light it should be noted that all factors contributing to systolic and diastolic PAP should be fully assessed before inferences concerning blood flow are made from these values.
D The mean pulmonary artery pressure  represents the average pressure over one complete systolic and diastolic interval.
1. The  is the average pressure in the pulmonary artery over a given time and is used to assess the average pressure head (or front) to which the pulmonary arterial system is exposed.
2. Thus the pressure gradient across the pulmonary circulation is generally represented by the expression  – pulmonary wedge pressure (PWP), or mean left atrial pressure, also referred to as the pulmonary artery opening pressure (PAOP) or pulmonary capillary wedge pressure (PCWP; see Section IV, Pulmonary Wedge Pressure).
3. The  is commonly used to assess right ventricular afterload, thus representing the resistance (in terms of pressure) against which the right ventricle must pump.
a. Afterload generally reflects an inverse relationship with stroke volume the more compromised the state of the right ventricle.
b. Afterload always represents a direct relationship with myocardial oxygen consumption and therefore myocardial work.
c. Afterload of the right and left ventricles may vary dramatically and, when monitoring allows, should be independently evaluated.
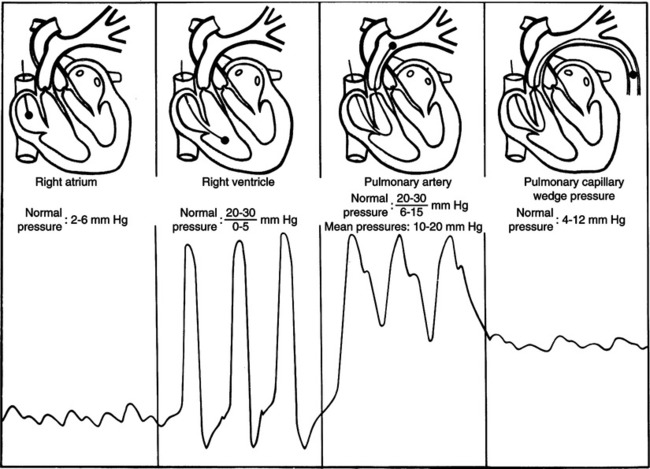
E The PAP and  are directly measured using a pulmonary artery catheter. The pulmonary artery catheter is inserted through a peripheral vein and traverses the vena cava, right atrium, and ventricle, with its tip resting in the pulmonary artery. As the catheter is advanced, the typical pressure curves (deflection) generated on an oscilloscope are observed to monitor its distal location (Figure 12-4).
F Normal values for pulmonary arterial blood pressure in the adult are as follows:
| Systolic: | 15 to 28 mm Hg |
| Diastolic: | 5 to 16 mm Hg |
| Mean: | 10 to 22 mm Hg |
IV Pulmonary Wedge Pressure (PAOP or PCWP)
PWP is expressed as a single number representing the mean left atrial pressure 
A The numerical pressure value of the PWP will be the result of the following factors:
1. The pump capabilities of the left side of the heart in part determine the PWP. If the left ventricle pumps what it receives, blood will not back up into the atrium, and the PWP should be normal. If the left ventricle is not pumping adequately, there will be a backup of blood into the atrium that will be reflected as elevated PWP.
2. Blood return to the left atrium is largely the result of an adequate blood volume-to-pulmonary venous (venomotor tone) vascular space relationship.
3. If the left ventricle is pumping adequately, the PWP depends on the aforementioned vascular volume-to-vascular space relationship.
B The PWP is commonly used as an indicator of left ventricular preload when measured as the left ventricular end-diastolic pressure (LVEDP).
1. The LVEDP represents compliance of the left ventricle.
2. The LVEDP also represents the filling pressure necessary for the ensuing left ventricular contraction.
3. Preload generally varies directly with the size of the ensuing stroke volume and therefore cardiac output as may be experienced with fluid therapy.
4. However, in the failing ventricle or fluid-overloaded patient, preload varies inversely with stroke volume and cardiac output. Such a situation also represents increases in myocardial oxygen consumption and work.
5. Preload of the left and right ventricles may also vary dramatically and therefore should be separately assessed with the availability of a pulmonary artery catheter.
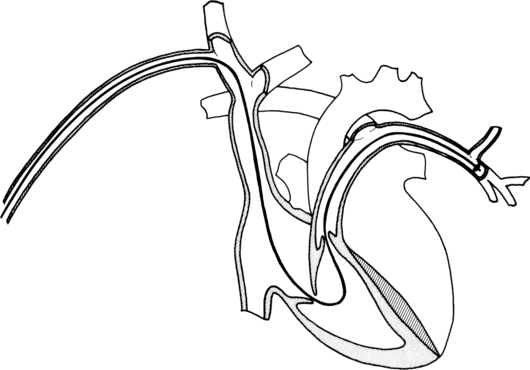
C The PWP is measured directly through a pulmonary artery catheter by the intermittent inflation of a balloon that occludes the local branch of the pulmonary artery (Figure 12-5). Pressure readings are taken from the tip of the catheter, which is distal to the balloon. The inflated balloon obstructs the systolic and diastolic pulmonary artery pressures (the characteristic pressure contour should be absent). Therefore the pressure measurement reflects backpressure (through a low resistance system) from the left atrium.
V Calculation and Comparison of Systemic and Pulmonary Vascular Resistance
 (3)
(3) = cardiac output or flow expressed in L/min.
B Systemic vascular resistance (SVR) (Figure 12-6)equals:
 (4)
(4)where MAP = mean arterial pressure;  = mean right atrial pressure (CVP); and
  = cardiac output.
2. Replacing the factors with representative normal values results in
 (5)
(5)C Pulmonary vascular resistance (PVR) (see Figure 12-6) equals:
 (6)
(6)where  = mean pulmonary arterial pressure;
  = mean left atrial pressure (PWP); and
  = cardiac output.
2. Replacing the factors with representative normal values results in
 (7)
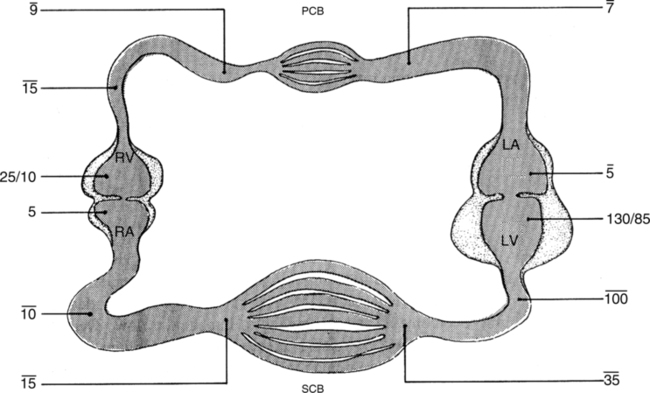
(7)D In this example, SVR equals 19 mm Hg/L/min and PVR equals 2 mm Hg/L/min. This relationship results in SVR being approximately 9.5 times the PVR. Stated otherwise, a pressure gradient 9.5 times as great is required of the left ventricle when compared with the right ventricle to create the same (5 L) left and right cardiac output (Figure 12-7).
E In the aforementioned example, vascular resistance is represented by an arbitrary vascular resistance unit (VRU) for simplicity. Vascular resistance in the clinical and research setting is reported as a proper scientific representation of resistance expressed as dyne-sec/cm5 with a conversion factor of 1 VRU = 80 dyne-sec/cm5. Hence in the aforementioned example, PVR = 2 VRU = 80 dyne-sec/cm5 or 160 dyne-sec/cm5 and SVR = 19 VRU = 80 dyne-sec/cm5 or 1520 dyne-sec/cm5.
F Vascular resistance should be independently assessed and serially tracked as indices of the effectiveness or necessities of interventional therapies, such as:
VI Summary of Normal Hemodynamic Values (Table 12-1)
TABLE 12-1
Normal Ranges of Systemic and Pulmonary Hemodynamic Values
| Systemic | Pulmonary | |
| Systolic | 90-140 mm Hg | 15-28 mm Hg |
| Diastolic | 60-90 mm Hg | 5-16 mm Hg |
| Mean | 70-105 mm Hg | 10-22 mm Hg |
| CVP or PWP | 0-8 mm Hg | 2-12 mm Hg |
| Vascular R | 1200-2000 dyne-sec/cm5 | 160-400 dyne-sec/cm5 |
| Cardiac index | 2.5-4 L/min/m2 | 2.5-4 L/min/m2 |
CVP, Central venous pressure; PWP, pulmonary wedge pressure; R, resistance.
VII Techniques of Measuring Cardiac Output
1. The total amount of oxygen available for tissue utilization must be equal to arterial oxygen content (Cao2), expressed in vol%, times the volume of blood presented to the tissues per unit time ( or cardiac output), expressed in L/min:
 (8)
(8)2. The total amount of oxygen returned to the lung from the tissues must be equal to the mixed venous oxygen content (C o2) times the volume of blood presented to the lung per unit time (
 or cardiac output):
 (9)
(9)3. Therefore total tissue extraction of oxygen per unit time (Co2) must be equal to the total oxygen available minus the total oxygen returned:
 (10)
(10)4. Equation 10 may be simplified by extracting the common factor of ( ) and rewriting it as follows:
 (11)
(11)5. Equation 11 is called the Fick equation, and by solving for cardiac output ( ), it becomes:
 (12)
(12)6. Thus by measuring total oxygen consumption per minute and arterial and mixed venous oxygen content in vol%, the cardiac output can be easily calculated by equation 12.
a. Total oxygen consumption generally is calculated by analysis of exhaled gases.
b. Arterial oxygen content requires systemic arterial blood sampling.
c. Mixed venous oxygen content requires pulmonary arterial blood sampling.
7. Example: Given the following values:

the cardiac output must equal 5.6 L/min by the following calculation:
8. The cardiac output determination obtained by using the Fick equation is considered the most accurate. The Fick method is therefore the standard by which other methods of cardiac output determinations are compared for accuracy.
1. A dye (typically indocyanine green) that can be analyzed by a spectrophotometer is used as an indicator.
2. A known amount (milligrams) of dye is injected rapidly into the right atrium or pulmonary artery.
3. The dye is allowed to mix in the pulmonary circulation, and a continuous representative sampling of blood is drawn from the sampling catheter located in a major systemic artery.
4. Blood samples are analyzed by spectrophotometry for concentration of dye, and the concentrations are plotted on a graph against time.
5. Knowing the number of milligrams of dye injected and plotting the measured concentrations against time allow calculation of the cardiac output () by the following equation using a computer normally associated with the device:
 (13)
(13) = cardiac output; d0 = mg of dye injected;
  = mean concentration of dye; and t = time from appearance to disappearance of dye at sampling site.
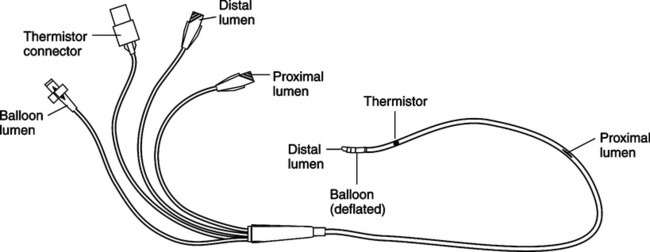
1. This technique uses a four-lumen pulmonary artery catheter (Swan-Ganz catheter) with a port approximately 30 cm proximal from the end of the catheter (Figure 12-8).
2. This proximal port usually lies in the right atrium and is used for injection of a known volume (usually 10 ml) of fluid (D5W) at a known temperature (usually 0° C).
3. At the distal end of the catheter is a thermistor, which senses changes in temperature. This device normally resides in a branch of the pulmonary artery.
4. The bolus of cold solution is injected into the right atrium. The right ventricle is used as the mixing chamber, and the blood is continually sampled by the thermistor for changes in temperature.
5. The changes in blood temperature can be plotted on a graph against time.
6. The principle underlying cardiac output determination by thermal dilution is identical to that previously described for dye dilution.
7. Knowing the volume of the injected solution and the blood and solution temperatures and plotting the changes in blood temperature against time allow calculation of the cardiac output by the following equation using a computer that is normally attached to the device:
 (14)
(14) = cardiac output; V = volume of solution injected; Tb = temperature of blood; Ts = temperature of solution injected;
  = mean change in temperature of blood; and t = time from appearance to disappearance of temperature change at sampling site.
8. The measurement typically is made using a bedside computer and integrated software to instantaneously provide the calculation. Three sequential measurements are customarily taken, and if all are within a given range of variance (<20%), the mean of the three measurements will be recorded as the cardiac output.
9. The simplicity of the thermal dilution method, along with the unrequired simultaneous sampling of systemic and pulmonary arterial blood, makes this the standard method used to serially measure cardiac output (Table 12-2).
TABLE 12-2
Comparison of Fick versus Thermodilution Cardiac Output Measurement
| Fick | Thermodilution | |
| Accuracy in low cardiac output, high intrapulmonary shunt, or cardiac valvular insufficiencies | Accurate | Not accurate |
| Simplicity of measurement | Complex | Simple |
| Availability of data | Protracted | Immediate |
| Reproducibility | Excellent | Good |
D The cardiac output of different individuals varies greatly according to body size. Therefore cardiac output is frequently expressed in terms of body size and is then called the cardiac index (CI).
1. The CI is equal to the cardiac output in liters per minute per body surface area (BSA) in square meters.
2. The BSA is obtained from a standardized chart using the individual’s height and body weight in the determination.
3. The CI becomes a more meaningful value when comparing cardiac outputs of different individuals.
4. Because the CI is a more consistent value among different individuals, it has a narrow normal range of 2.5 to 4 L/min/m2.
5. Some prefer to monitor stroke index (SI), which is derived from the CI as follows:
 (15)
(15)6. Normal values for SI range from 30 to 70 ml/contraction/m2.
VIII Assessing Myocardial Contractility
A Ventricular performance curves (Figure 12-9)
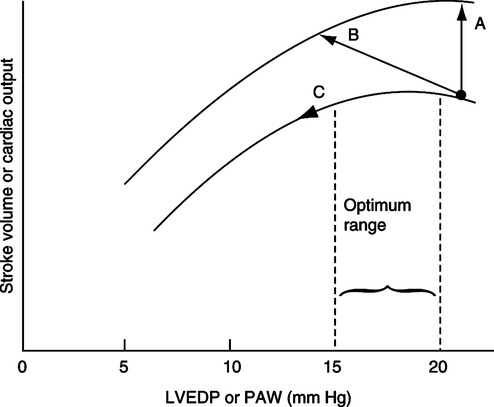
1. Typically these graphs have some index of preload (PWP) on the horizontal (x) axis and some index of cardiac output on the vertical (y) axis.
2. As increases in preload are made by incremental additions of fluid administration, the resulting cardiac output is measured and graphically plotted.
3. The resulting curve is a representation of the ventricular performance and captures the state of contractility at that moment. By itself it represents a small amount of data; however, when compared with other curves it provides relative changes in contractility.
1. Defined as the percentage of blood ejected by the ventricle with each contraction. In equation form:
 (16)
(16)a. Generally measured by two-dimensional echocardiography at the bedside and performed on the left ventricle, although either can be assessed.
2. Nuclear ventriculogram (MUGA scan) using a radioactive isotope and a gamma camera provides more reproducible results. The gamma cameras have built-in microprocessors and a generator that provides for bedside studies.
a. Modified thermodilution pulmonary artery catheter to sense rapid temperature changes
(1) Rapid thermistor at the distal tip
(2) Two sensitive electrocardiographic electrodes for R wave detection
b. Using a rapid beat-to-beat thermodilution technique the computer provides a derived measurement of right ventricular EF and right ventricular end-diastolic volume and right ventricular stroke volume.
c. This monitoring technique, although less accurate than traditional quantification of EF, is easily integrated into the critical care setting because of its:
IX Continuous Monitoring of Oxygenation Status
A Monitoring oxygenation of venous blood at the pulmonary capillary bed.
1. Noninvasive continuous monitoring of the oxygen saturation of arterial blood (Sao2) is easily accomplished using a pulse oximeter and sensor attached to the finger or bridge of the nose. The Spo2 is essentially equivalent to the Sao2.
2. This is commonly integrated into a computer module with display of the arterial pulse contour and numeric value for Spo2.
3. The respective Spo2 is a result of the collective oxygenation of venous blood in the pulmonary capillary bed.
4. The Spo2 is a reflection of Pao2 as displayed by the oxyhemoglobin dissociation curve.
5. Therefore the easily measured Spo2 is used as a continuous monitor of impending hypoxemia and pulmonary function.
6. Normally Spo2 <90% is considered abnormal.
7. Clearly it does not replace the necessity of arterial blood gas analysis for complete oxygenation and acid-base status.
B Monitoring deoxygenation of arterial blood at the systemic capillary bed
1. Invasive continuous monitoring of the oxygen saturation of mixed venous blood (S o2) is accomplished using a specialized pulmonary artery catheter with a channel containing optical fibers, which will transmit and collect light wavelength data from its distal tip in similar fashion to a standard oximetry probe.
2. These data are commonly integrated into a computer module and displayed as a continuous graph and instantaneous numeric value.
3. The respective S o2 is a result of the collective deoxygenation of arterial blood in the systemic capillary bed.
4. The The S O2 is a reflection of P
 o2 as displayed by the oxyhemoglobin dissociation curve.
5. Therefore S o2 is used as a continuous monitor of gross tissue oxygen demand and is the average resultant of oxygen supply versus oxygen demand.
6. However, S o2 is also affected by metabolic rate and cardiac output.
7. Many use changes in S o2, increased CO.
8. Normally the range for S o2 is 60% to 80%.
9. S o2 < 60% generally represents an oxygen demand that exceeds the oxygen supply.
10. Note that a normal S o2 is the result of the collective average oxygen use of all tissue beds, allowing for the possibility of some being underperfused and others being overperfused.
X Hemodynamic monitoring via a pulmonary artery catheter continues to be the mainstay used to evaluate the physiologic status and/or response to therapy in critical care. However, increased efforts have been made to develop less invasive or noninvasive monitoring methods of hemodynamic monitoring such as:
A Arterial transpulmonary thermodilution and arterial pulse contour analysis
1. Uses a CVP line and a noncardiac thermodilution arterial line with the thermistor normally placed in the femoral artery.
2. Intermittent injection of cold saline into the CVP and the resulting measurement by the thermistor in the femoral arterial line using a computer-executed algorithm generate a cardiac output measurement.
3. An arterial pressure curve is concurrently generated, and correlation of the cardiac output to the curve is performed using the computer.
4. Changes in the area under subsequently generated pressure curves are compared with the reference (measured cardiac output) arterial pressure curve and are computer interpolated as changes in cardiac output.
5. This provides for continuous, non–personnel-driven generation and monitoring of cardiac output.
B Transesophageal echocardiography derives cardiac output from ultrasound echo Doppler shift reflected by red blood cell flow in the left ventricular outflow tract using an intraesophageal probe.
C Inductive plethysmography derives cardiac output from two thoracic surface electrodes, which measure electrical resistance changes across the chest. By subtracting the resistance generated by normal ventilatory (motion) fluctuations, the remaining changes in resistance are attributed to the volume of blood entering and leaving the heart and are correlated with a cardiac output measurement. Although not accurate as yet, this is a totally noninvasive means of continuously measuring cardiac output.
D Lithium dilution using a CVP and arterial line: injection of lithium solution and subsequent measurement at the arterial site generate a dye dilution curve. Analysis of the area under the curve provides a cardiac output measurement. Concurrent generation of the arterial pulse contour (reference) is correlated to the cardiac output measurement. The cardiac output can be continuously measured and displayed by an ongoing computer comparison of subsequent arterial pulse contours with the reference contour. The amount of radiation exposure from this technique is approximately the same as standard chest x-ray.
XI Data Obtained from Arterial and Venous Lines
2. Systemic diastolic pressure
3. Systemic mean arterial blood pressure
 o2
o2XII Complications of Arterial and Venous Lines
XIII Effects of Ventilation on Intrathoracic Hemodynamic Pressure Values
A Alterations during spontaneous ventilation
1. Pulmonary and CVPs follow intrathoracic pressure changes.
2. During spontaneous inspiration, intrathoracic pressure decreases and thereby decreases all pulmonary arterial and CVPs.
a. This phenomenon is exaggerated by deep inspiratory efforts and in patients who are experiencing increased work of breathing.
3. During spontaneous exhalation, intrathoracic pressure increases and thereby increases all pulmonary arterial and CVPs.
B Alterations during spontaneous ventilation with positive end-expiratory pressure (PEEP; continuous positive airway pressure)
1. As in spontaneous ventilation, intrathoracic pressure, pulmonary arterial pressure, and CVP decrease on inspiration and increase on exhalation.
2. However, as a result of the increased intrathoracic pressure transmitted by PEEP, the measured pulmonary arterial pressure and CVP will be elevated by that factor.
C Alterations during positive pressure ventilation
1. As in spontaneous ventilation, pulmonary arterial and CVPs follow intrathoracic pressure changes; however, they are influenced to a greater degree.
a. The extent of the influence depends on the combination of transmitted intrathoracic and intraairway pressures resulting from the following factors:
2. During positive pressure inspiration, intrathoracic pressure increases and thereby increases all pulmonary arterial and CVPs.
3. During positive pressure exhalation, intrathoracic pressure decreases and thereby decreases all pulmonary arterial and CVPs.
D Whether the patient is breathing spontaneously or receiving continuous positive airway pressure, intermittent mandatory ventilation, intermittent positive pressure ventilation, or continuous positive pressure ventilation, the aforementioned effects on intrathoracic and subsequent hemodynamic pressures need to be considered. However, minimizing the artifact of positive-negative intrathoracic pressure swings is best accomplished by making the hemodynamic pressure recording at end exhalation regardless of the mode of ventilation.
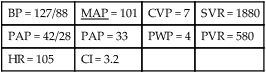
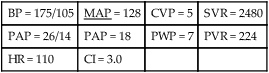
XIV Representative Hemodynamic Profiles
| BP = 127/88 | MAP = 101 | CVP = 7 | SVR = 1880 |
| PAP = 42/28 | PAP = 33 | PWP = 4 | PVR = 580 |
| HR = 105 | CI = 3.2 |
| BP = 175/105 | MAP = 128 | CVP = 5 | SVR = 2480 |
| PAP = 26/14 | PAP = 18 | PWP = 7 | PVR = 224 |
| HR = 110 | CI = 3.0 |
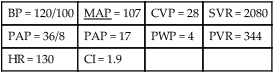
| BP = 120/100 | MAP = 107 | CVP = 28 | SVR = 2080 |
| PAP = 36/8 | PAP = 17 | PWP = 4 | PVR = 344 |
| HR = 130 | CI = 1.9 |
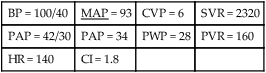
| BP = 100/40 | MAP = 93 | CVP = 6 | SVR = 2320 |
| PAP = 42/30 | PAP = 34 | PWP = 28 | PVR = 160 |
| HR = 140 | CI = 1.8 |
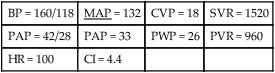
| BP = 160/118 | MAP = 132 | CVP = 18 | SVR = 1520 |
| PAP = 42/28 | PAP = 33 | PWP = 26 | PVR = 960 |
| HR = 100 | CI = 4.4 |
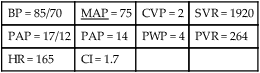
| BP = 85/70 | MAP = 75 | CVP = 2 | SVR = 1920 |
| PAP = 17/12 | PAP = 14 | PWP = 4 | PVR = 264 |
| HR = 165 | CI = 1.7 |
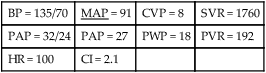
G Normovolemia with continuous positive pressure ventilation
| BP = 135/70 | MAP = 91 | CVP = 8 | SVR = 1760 |
| PAP = 32/24 | PAP = 27 | PWP = 18 | PVR = 192 |
| HR = 100 | CI = 2.1 |