Chapter 6 Hemodynamic Monitoring
4 In what situations should arterial line placement be considered?


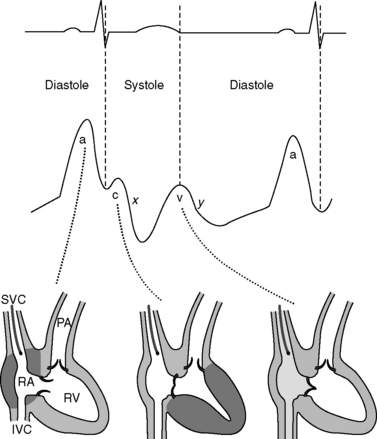
7 Describe the central venous waveform components. Which part of the waveform cycle should be reported as the central venous pressure?
Central venous pressures have predictable waveforms. These waveforms have upward deflections representing atrial contraction (“a” wave), ventricular contraction that causes the tricuspid valve to bulge into the atrium (“c” wave), and passive venous return of blood during diastole (“v” wave). (Note the somewhat counterintuitive fact that ventricular contraction coincides with the “c” wave, not the “v” wave.) The downslope after the “c” wave is called the “x” descent, and the downslope after the “v” wave is called the “y” descent. See Figure 6-1.
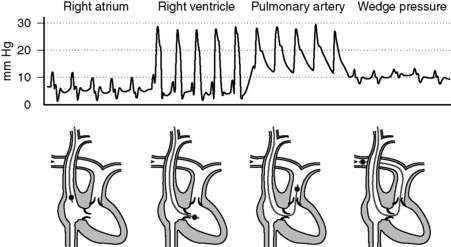
10 Describe normal pressures and waveforms encountered as a PAC is advanced
The right atrial pressures are similar to central venous pressures described in question 7. Right ventricular pressures will have systolic components that are in phase with (i.e., occur synchronously with) systemic arterial systolic pressures and have low diastolic pressures that increase during diastole. Systolic pulmonary arterial pressures will also be in phase with systemic arterial systolic pressures and have similar waveforms that gradually decrease during diastole. The pulmonary artery occlusion pressure (PAOP)—or wedge pressure if no balloon is used—reflects the left atrial pressure and thereby left ventricular filling. Because the wedge pressure reflects the left atrial pressures, it may have “a,” “c,” and “v” waves, although in practice these may difficult to identify. Large “v” waves due to mitral regurgitation can occur on the PAOP trace, but these large “v” waves will occur during late systole and early diastole. See Figure 6-2.
11 Normally, central venous pressures gauge right ventricular end-diastolic volume and pulmonary arterial occlusion pressures gauge left ventricular end-diastolic volume. What factors alter these relationships?
 Transducers measure atrial pressures as surrogates for ventricular end-diastolic volumes. In patients with severely stenotic valves, pressures will be elevated and therefore overestimate the volumes.


12 Describe how thermodilution with a PAC can be used to determine cardiac output
The modified Stewart-Hamilton equation describes this:
14 Can arterial lines tell us anything more than pressure?
 Fluid responsiveness: If central veins are not adequately filled (i.e., with a patient with hypovolemia), changes in intrathoracic pressure during positive-pressure variation can result in highly significant effects on cardiac output and blood pressure. Variation in pulse pressure or systolic pressure of greater than 10% to 12% is predictive of positive fluid responsiveness. Note that this technique holds only for sedated patients (with no spontaneous respirations) receiving positive-pressure ventilation with regular cardiac rhythm.

17 How is Fick’s principle used to measure cardiac output?

Rearranging, cardiac output is calculated as

In this equation, oxygen content of blood, C, is calculated as

19 Describe some of the general applications of bedside ultrasound examination to monitor hemodynamics in the ICU
20 Is it possible to look more directly at tissue perfusion?
 Gastric tonometry: Carbon dioxide accumulation in gut mucosa typically results from decreased perfusion. Therefore measurement of gastric carbon dioxide via nasogastric or orogastric tube can provide a gauge for whether tissue perfusion is adequate.


Key Points Hemodynamic Monitoring
1. Hemodynamic monitoring is our way of attempting to determine whether tissue perfusion is adequate; it provides data to guide therapy but is not by itself therapeutic.
2. Arterial transducers must first be zeroed and leveled to eliminate the effects of atmospheric pressure and hydrostatic pressure on readings. In addition, system readings should be monitored for damping (where readings erroneously converge to the mean pressure) and resonance (where readings erroneously diverge from the mean pressure).
3. Central lines have predictable waveforms with upward deflections during atrial contraction (the “a” wave), ventricular contraction (the “c” wave), and passive venous return (the “v” wave). To gauge end-diastolic volume, the pressure reported should be at the valley immediately preceding the “c” wave.
4. Fluid responsiveness in critically ill patients can be assessed with fluid challenge, the passive leg raise test, systolic pressure variation, pulse pressure variation, ultrasound examination of the inferior vena cava, and several other methods.
1 Brennan J., Blair J., Goonewardena S., et al. Reappraisal of the use of inferior vena cava for estimating right atrial pressure. J Am Soc Echocardiogr. 2007;20:857–861.
2 Chatterjee K. The Swan-Ganz catheters: past, present and future: a viewpoint. Circulation. 2009;119:147–152.
3 Cholley B., Payen D. Noninvasive techniques for measurements of cardiac output. Curr Opin Crit Care. 2005;11:424–429.
4 Isakow W., Shuster D. Extravascular lung water measurements and hemodynamic monitoring in the critically ill: bedside alternatives to the pulmonary artery catheter. Am J Physiol Lung Cell Mol Physiol. 2006;291:1118–1131.
5 Jensen M., Sloth E., Larsen K., et al. Transthoracic echocardiography for cardiopulmonary monitoring in intensive care. Eur J Anesthesiol. 2004;21:700–707.
6 Karamanoglu M., O’Rourke M., Avolio A., et al. An analysis of the relationship between central aortic and peripheral upper limb pressure waves in man. Eur Heart J. 1993;14:160–167.
7 Monnet X., Rienzo M., Osman D. Passive leg raising predicts fluid responsiveness in the critically ill. Crit Care Med. 2006;34:1402–1407.
8 Munis J., Lozada L. Giraffes, siphons and starling resistors: cerebral perfusion pressure revisited. J Neurosurg Anesthesiol. 2000;12:290–296.
9 Pittman J., Ping J., Mark J. Arterial and central venous pressure monitoring. Int Anesthesiol Clin. 2004;42:13–30.
10 Seneff M. Arterial line placement and care. In: Irwin R.S., Rippe J.M. Irwin and Rippe’s Intensive Care Medicine. 6th ed. Philadelphia: Lippincott Williams & Wilkins; 2008:36–45.
