[level-membership-for-basic-science-category]
Chapter 5 Health technology assessment
Health technology assessments bridge the gap between licensing and everyday clinical practice.
The critical steps involve:
• A systematic review of the evidence.
• Estimating cost-effectiveness.
• Drawing appropriate conclusions on which decision-makers can act.
A cost–effectiveness analysis attempts to provide a rational basis for decision-making in the face of resource constraints.
There are three stages in the health technology assessment of a product:
The scope
1. Obviously the product, or group of products, under investigation needs to be characterised.
2. The nature of the comparator health technology (or technologies) also requires definition. Depending on the circumstances, the comparator might be another pharmaceutical product indicated for the same condition; it might be a device or procedure used for the same or similar purposes; or it might be ‘best supportive care’. In any event, the comparator should reflect current clinical practice.
3. At the start of any health technology assessment, the clinical outcome(s) of interest should be decided. The most desirable, of course, is the ‘ultimate outcome’, such as dead versus alive or recovered versus not recovered. There are circumstances, however, when an assessment is focused on an ‘intermediate’ (or surrogate) outcome where there is confidence that this reflects the ultimate outcome. For example, in the assessment of statins for the treatment of hypercholesterolaemia, a decision would need to be taken as to whether the long-term ‘ultimate’ outcome (i.e. reduction in coronary artery disease) should be used; or whether the assessment should be concerned with an ‘intermediate’ outcome (i.e. a reduction in LDL cholesterol).
4. The type of evidence required to demonstrate the effectiveness of a product must also be determined. In many instances this may be restricted to the results of randomised controlled trials. There may be circumstances where other study designs are more appropriate. In the assessment of a vaccine, for example, evidence from randomised controlled trials may usefully be supplemented by the results of observational studies that have examined its efficacy under circumstances that more closely reflect its performance in the ‘real world’.
5. Decisions must also be made about the form any economic evaluation should take. These include the economic perspective and the type of analysis that is most appropriate. These issues are discussed later.
Clinical effectiveness
3 Analysing the data
• The study’s bibliographic reference.
• The type of study (e.g. randomised controlled trial, case–control study).
• Number of patients in each arm.
• Patient characteristics (e.g. age, gender).
• Study setting (e.g. hospital inpatients, GPs’ surgeries).
• Intervention(s) including dose(s) and route(s) of administration.
• Comparator interventions (e.g. placebo, active comparator).
The evidence table may also include some attempt to assess the quality of each study. There is no generally accepted approach to doing this but one of the more common methods is to use the Jadad score (see Table 5.1). This itemises those elements in the design and conduct of a study (i.e. randomisation and blinding) that contribute most to a study’s internal validity. A score of 5 would indicate that the particular study appeared to avoid both selection and ascertainment biases. A score of 0 would cast considerable doubt on a study’s internal validity.
| Item | Score |
|---|---|
| Was the study described as randomized? | 0/1 |
| Was the method of randomization described and appropriate? | 0/1 |
| Was the study described as double blind? | 0/1 |
| Was the method of double blinding described and appropriate? | 0/1 |
| Was there a description of withdrawals and dropouts? | 0/1 |
| Deduct 1 point if the method of randomization was described and was inappropriate? | 0/−1 |
| Deduct 1 point if the study was described as double blind but the method of blinding was described and inappropriate? | 0/−1 |
Quantitative synthesis (meta-analysis)
A meta-analysis (see also, Chapter 4, p. 49), at its most simple level, involves extracting the summary statistical data for each study. The relevant data are the mean differences in outcomes at the end of the study with their 95% confidence intervals. Estimates of the effect size for of the included studies, and the pooled estimate from all the studies, are often depicted as a ‘forest plot’1; an example is shown in Figure 5.1.
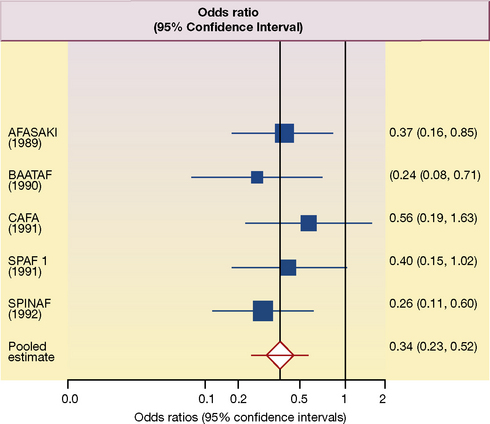
This forest plot summarises the results of each of five placebo-controlled trials, designed to assess the effect of anticoagulation with warfarin on the frequency of ischaemic stroke in patients with non-valvular atrial fibrillation.2 In a typical forest plot, there is an abbreviated reference to each trial on the left. The point estimate (mean) of the results of each study is represented as a square; and the horizontal line running through the square is its 95% confidence interval. The size of each square is proportional to the size of the study compared to the others. The column at the right shows the individual odds ratios (the expression of benefit used in this meta-analysis), and their 95% confidence intervals, for each study. By convention, improvement (a decrease in the frequency of ischaemic stroke) is shown to the left of the vertical ‘no effect’ line; a worsening (an increase in the frequency of ischaemic stroke) is shown to the right.
In the forest plot in Figure 5.1 the outcome is expressed as odds ratios. In each of five studies, the frequency of ischaemic stroke is reduced by treatment with warfarin and all five ‘squares’ are to the left of the ‘no effect’ (odds ratio = 1) vertical line. In three of the studies the 95% confidence interval does not cross the ‘no effect’ line and the results would be statistically significant with P values of less than 0.05. In the other two studies, the upper boundaries of the 95% confidence interval cross the ‘no effect’ line and would not reach conventional levels of statistical significance (i.e. the P value is more than 0.05). The overall pooled mean effect size, taking account of the results of all five studies, is shown as a diamond in Figure 5.1; and the horizontal line again represents its 95% confidence interval.
4 Drawing conclusions
Scrutiny of Figure 5.1 suggests that it would be reasonable, by any standards, to regard warfarin as effective in the prevention of ischaemic stroke in patients with non-valvular atrial fibrillation. Moreover, the authors were able to estimate that about 25 strokes and about 12 disabling or fatal strokes would be prevented yearly for every 1000 patients with atrial fibrillation treated with warfarin.
Cost–effectiveness
3 Type of analysis
Cost–utility analysis
In this form of analysis the ICER is expressed as the ratio of the incremental costs to the incremental utility gain. The most common expression of this form of ICER is as cost (£) per incremental gain in the quality adjusted life years (£ per QALY). Examples of ICERs for some cancer drugs are shown in Table 5.2.
Table 5.2 Incremental cost–effectiveness ratios for some cancer drugs appraised by the National Institute for Health and Clinical Excellence (after Rawlins 2010, in Oxford Textbook of Medicine, fifth edition.)
| Treatment | Condition | Incremental cost–effectiveness ratio (£/QALY) |
|---|---|---|
| Rituximab | Aggressive non-Hodgkin’s lymphoma | 6100 |
| Paclitaxel | Metastatic ovarian cancer | 8500 |
| Gemcitabine | Metastatic pancreatic cancer | 12 500 |
| Vinorelbine | Metastatic breast cancer | 14 500 |
| Trastuzumab | Early breast cancer | 18 000 |
| Temozolomide | Recurrent glioma | 25 300 |
| Imatinib | Inoperable or metastatic gastrointestinal stromal tumour | 32 000 |
| Temozolomide | Newly diagnosed glioma | 35 000 |
| Bevacizumab | Metastatic colorectal cancer | 62 860 |
| Cetuximab | Metastatic breast cancer | 72 210 |
In conclusion
One of the most critical issues, in the assessment of the clinical data, is the extent to which the benefits in trials can be extrapolated beyond the data. In the trials depicted in Figure 5.1, the average duration of follow-up was 1.5 years. Does this mean that treatment should be stopped after this? The mean age of participants was 69 years and with very few under the age of 50 years or over the age of 80 years. Does this mean that treatment should be denied to younger people? Or to the very elderly?
These are the decisions that decision-makers themselves must make. A reasonable decision-maker could reasonably conclude that to stop warfarin treatment after 1.5 years would be wrong, and that denying the very likely benefits to those younger and older than those in the trials would be equally wrong. These decisions are ones that require judgements to be made rather than strict adherence to the tenets of health technology assessment. Health technology assessment plays a crucial role in underpinning evidence-based clinical practice but it does not supplant the place of judgement!3
Higgins J.P.T., Green S. Cochrane Handbook for Systematic Reviews of Interventions. Chichester: John Wiley; 2008.
Matthews J.N.S. An Introduction to Randomized Controlled Trials. London: Chapman and Hall; 2006.
Morris S., Devlin N., Parkin D. Economic Analysis in Health Care. Chichester: John Wiley; 2007.
Rawlins M.D., The evaluation and provision of effective medicines: Warrell. D.A., Cox T.M., Firth. J.D., Benz E.J. Oxford Textbook of Medicine, fifth ed, Oxford: Oxford University Press, 2010.
Rawlins M.D. Therapeutics, Evidence and Decision-making. London: Hodder, 2011.
1 The ‘forest plot’ is so called because (to some – though not to the author’s – eyes) the ‘plot’ resembles a forest!
2 Aguilar M I, Hart R 2005 Oral anticoagulants for preventing stroke in patients with non-valvular atrial fibrillation and no previous history of stroke or transient ischemic attacks. Cochrane Database of Systematic Reviews Issue 3, Art. No.: CD001927. DOI: 10.1002/14651858.CD001927.pub2.
3 Rawlins M D 2010 The evaluation and provision of effective medicines. In: Warrell D A, Cox T M, Firth J D, Benz E J (eds) Oxford Textbook of Medicine, 5th edn. Oxford University Press, Oxford
[/level-membership-for-basic-science-category][not-level-membership-for-basic-science-category]
Chapter 5 Health technology assessment
Health technology assessments bridge the gap between licensing and everyday clinical practice.
The critical steps involve:
• A systematic review of the evidence.
• Estimating cost-effectiveness.
• Drawing appropriate conclusions on which decision-makers can act.
A cost–effectiveness analysis attempts to provide a rational basis for decision-making in the face of resource constraints.
There are three stages in the health technology assessment of a product:
The scope
1. Obviously the product, or group of products, under investigation needs to be characterised.
2. The nature of the comparator health technology (or technologies) also requires definition. Depending on the circumstances, the comparator might be another pharmaceutical product indicated for the same condition; it might be a device or procedure used for the same or similar purposes; or it might be ‘best supportive care’. In any event, the comparator should reflect current clinical practice.
3. At the start of any health technology assessment, the clinical outcome(s) of interest should be decided. The most desirable, of course, is the ‘ultimate outcome’, such as dead versus alive or recovered versus not recovered. There are circumstances, however, when an assessment is focused on an ‘intermediate’ (or surrogate) outcome where there is confidence that this reflects the ultimate outcome. For example, in the assessment of statins for the treatment of hypercholesterolaemia, a decision would need to be taken as to whether the long-term ‘ultimate’ outcome (i.e. reduction in coronary artery disease) should be used; or whether the assessment should be concerned with an ‘intermediate’ outcome (i.e. a reduction in LDL cholesterol).
4. The type of evidence required to demonstrate the effectiveness of a product must also be determined. In many instances this may be restricted to the results of randomised controlled trials. There may be circumstances where other study designs are more appropriate. In the assessment of a vaccine, for example, evidence from randomised controlled trials may usefully be supplemented by the results of observational studies that have examined its efficacy under circumstances that more closely reflect its performance in the ‘real world’.
5. Decisions must also be made about the form any economic evaluation should take. These include the economic perspective and the type of analysis that is most appropriate. These issues are discussed later.
Clinical effectiveness
3 Analysing the data
• The study’s bibliographic reference.
• The type of study (e.g. randomised controlled trial, case–control study).
• Number of patients in each arm.
• Patient characteristics (e.g. age, gender).
• Study setting (e.g. hospital inpatients, GPs’ surgeries).
• Intervention(s) including dose(s) and route(s) of administration.
• Comparator interventions (e.g. placebo, active comparator).
[/not-level-membership-for-basic-science-category]
