Chapter 11 Health Services Research in Radiation Oncology
What Is Health Services Research?

What is the Scope of Health Services Research?
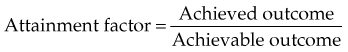
Figure 11-1 shows a general framework for a program of HSR aimed at improving some specific aspect of health system performance. The first step is to select, define, and validate appropriate indicators of the aspect of performance that has been targeted for investigation. The next two steps are to develop methods of measuring system performance in terms of the chosen indicator(s) and to prescribe standards or targets for system performance in terms of the chosen indicators. These two steps, which often involve the use of very different methods, can sometimes be undertaken in parallel. Once standards have been set and methods for measuring performance have been established and validated, it becomes possible to evaluate the performance of the system against the standards. This, in turn, permits further explanatory studies aimed at identifying factors that are associated with better or worse performance. This information can be used to design interventions aimed at improving performance. The interventions may then be implemented and systematically evaluated. Interventions may be refined through further cycles of improvement, before they are suitable for dissemination and incorporation into routine practice.
Studies on the Accessibility of Radiotherapy
Concept of Health Care Accessibility
The term accessibility was originally used narrowly to describe the ability of patients to obtain entry into the health system.1 It is now used more broadly to represent the overall “degree of fit between the clients and the system.”2 Accessibility can be seen as having a number of dimensions that determine that overall degree of fit (Table 11-1). Availability describes the total volume of the service available in relation to the total number of clients that would benefit from it. Availability depends on the adequacy of supply of health care workers and on the adequacy of facilities and equipment. For any given level of resources, availability also depends on the degree of efficiency in production of services. Spatial accessibility describes the geographic relationships between the places where services are provided and the places where potential clients reside. Accommodation describes the extent to which the system is designed and operated to facilitate clients’ access to service, for example, by operating at convenient hours or by providing transportation for patients who may need it. Affordability describes the relationship between the cost of health services and clients’ ability and willingness to pay. It depends not only on the direct cost of services but also on indirect costs, for example, loss of earnings during a protracted course of treatment. Awareness describes the extent to which those who need the service know that it is available and that they might benefit from it. In the context of a specialized service such as RT, patients’ awareness of the potential benefits of RT depends largely on their attending physician’s awareness of the indications for RT.
| Availability |
Need for Studies on Access to Radiotherapy
There are compelling reasons for doing research aimed at optimizing the accessibility of RT. To achieve optimal cancer outcomes at the population level it is necessary to make effective treatments accessible to every patient who needs them. RT is known to be effective in many clinical situations and the World Health Organization recognizes RT as a key component of any overall program of cancer control. In its 2005 declaration on Cancer Control, the World Health Organization stated that “recognizing that the technology for treatment of cancer is mature and that many cases of cancer can be cured…., all nations should improve access to appropriate technologies.”3 Many nations aspire to providing adequate and equitable access to health care for all of their citizens, but there is remarkably little information available about how successful they are in achieving this laudable goal with respect to RT. In reality, the widespread reports of waiting lists for RT in the medical literature and the news media suggest that access to RT remains suboptimal in many parts of the world.
Waiting Lists for Radiotherapy
Long waiting times for RT were first identified as a cause for concern in the medical literature in a report from Norway more than 20 years ago.4 Waiting lists for RT have since been reported in many other countries, including Australia,5 the United Kingdom,6 New Zealand,7 Canada,8 Denmark,9 Germany,10 Spain,11 and Italy.12 In the countries affected by waiting lists they have been a major concern for both patients and the providers of RT. The problem of waiting lists for RT is an ongoing challenge for health services researchers in radiation oncology, but the first step in dealing with the problem is to learn how to measure waiting times for RT.
Measuring Waiting Times for Radiotherapy
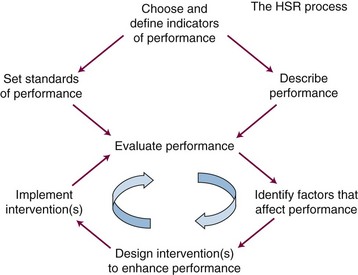
Mail surveys and email surveys can provide a lot of information about waiting times from multiple institutions at modest expense. They also can be used to compare waiting times between different centers within one country or can compare waiting times between different countries. Surveys can be structured to elicit information about delays in RT in a number of specific clinical situations. In the 1990s, a survey of heads of radiation oncology at comprehensive cancer centers in the United States and Canada showed that waiting lists for RT were widespread throughout Canada but revealed no evidence of similar problems anywhere in the United States. Median waiting times for a range of indications for RT were two to three times longer in Canada than in the United States.13 Figure 11-2 shows, for example, that at almost every Canadian center, patients with laryngeal cancer waited longer for RT than they did at almost any U.S. center. However, the validity of such surveys may be questioned because they rely on the veracity of self reports and because the primary information on which each report is based may differ from center to center.
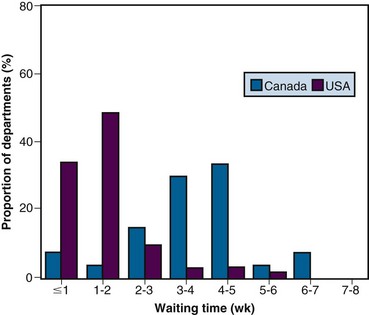
Retrospective analysis of data that have been gathered for other purposes is also relatively inexpensive and can provide more objective information about waiting times for RT. This may be an important first step in addressing this type of problem. At the beginning of the 1990s, reports of long waiting lists for RT in Ontario were frequently in Canadian news media. Health system managers believed that these reports were unduly alarmist and at first denied that there was any systemic problem.7 To clarify the situation, an analysis of waiting times for RT was undertaken based on computerized electronic records of all visits to the province’s radiotherapy centers over the preceding decade. Once these administrative records had been linked to the province’s cancer registry, waiting times for RT for various specific conditions were able to be described.7 For example, Figure 11-3A shows that waiting times from diagnosis to start of radical RT for laryngeal cancer increased dramatically through the late 1980s and early 1990s. Similar large increases in waiting times were found in many other clinical situations. The administrative data archived at the cancer centers also allowed us also to calculate waiting times between various milestones along the pathway from diagnosis to start of treatment. Figure 11-3A shows that the observed increases in overall waiting time between diagnosis and treatment were entirely the result of increases in the waiting time between the first visit to a radiation oncologist and the start of RT. There was no increase in the interval between diagnosis and referral to radiation oncology or between referral and consultation. These findings pointed to rate-limiting problems in access to planning and/or treatment machines. It is useful, whenever possible, to report observed waiting times in relation to standards or guidelines. At the time of this first report the Canadian Association of Radiation Oncologists (CARO) had already set standards for acceptable waiting times for RT: the maximum acceptable delay between referral to, and consultation by, a radiation oncologist was deemed to be 2 weeks, and the maximum acceptable delay between consultation and the start of RT was deemed to be 2 weeks.7 Although these standards were based only on expert opinion, they provided a useful framework for comparison. Figure 11-3B shows trends in compliance with these standards over time. Most patients met the CARO standard for prompt consultation throughout the study period, but the proportion of patients meeting the CARO standard for prompt start of RT fell from 90% to 10%. This simple study, which merely quantified the magnitude of the problem in our community, was useful because it led to public recognition of the seriousness of the problem.7 This proved to be an important first step in promoting the reinvestment in the infrastructure of the provincial RT system.
Causes of Waiting Lists for Radiotherapy
Kinetics of Waiting Lists
When demand for RT exceeds supply, waiting times inevitably increase and a waiting list for RT starts to grow. In theory, the waiting list will then continue to grow for as long as demand continues to exceed supply. In reality, waiting lists for RT do not grow indefinitely. When waiting times for RT become longer than the referring physicians believe is acceptable, they may begin to offer their patients alternative treatments, in circumstances in which RT would normally have been their first choice. For example, when long waiting lists for RT developed in Ontario in the early 1990s, there was a significant decline in the use of primary RT in the management of head and neck cancer, followed by a rebound when waiting lists decreased after a major reinvestment in facilities.14,15 It has been shown that there is a significant negative association between the prevailing waiting time for RT and the proportion of patients receiving postoperative RT after a partial mastectomy for breast cancer.16 Furthermore, tumor progression or deterioration in a patient’s general condition during the delay may render the patient ineligible for RT that would initially have been appropriate, and these cases drop off the list. Decreasing referrals and increasing dropoffs from the waiting list serve to reduce demand for RT. As demand declines, the balance between supply and demand is eventually restored; the waiting list then ceases to grow, waiting times stabilize at a higher level, and RT utilization rates stabilize at a lower level. This phenomenon has been referred to as implicit rationing, because it limits utilization without explicitly limiting access to care.17
Even when average supply is equal to average demand for RT, random fluctuations in referral rates may produce transient peaks in demand that exceed supply, and this may be sufficient to cause a substantial waiting list.18 This risk can be reduced by forward planning that provides a buffer of reserve capacity or by building flexibility of capacity into the system. The smaller the functional unit, the greater is the impact of random fluctuations, and the more reserve capacity is required to avoid a waiting list.18
A Canadian Case Study
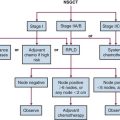
Why did waiting lists for RT become such a widespread problem around the world in the 1990s? Was there an increase in demand or a decrease in supply or both? Ontario’s experience serves as a useful case study. Analysis of historical data showed that three different factors conspired to cause a huge increase in demand for RT over the critical period.15 First, the incidence of cancer increased inexorably by approximately 3% per year, owing primarily to the aging of the Ontario population.15 Second, there was a dramatic increase in the proportion of patients referred for RT in three very common cancers. The proportion of new breast cancer cases referred for RT increased, consistent with the evidence-based trend toward breast conservation surgery and postoperative RT.15 The proportion of new cases of rectal cancer referred for RT increased, consistent with the evidence-based adoption of postoperative RT and chemotherapy. The proportion of prostate cancer patients treated with RT increased owing to an increase in the proportion of early-stage cases detected after the widespread adoption of screening for prostate-specific antigen.15 Third, there was a significant increase in the average number of fractions prescribed per course of RT. This was driven by an increase in the number of fractions per curative or adjuvant course, which outweighed a concomitant but smaller decrease in the number of fractions per palliative course of RT.15 There was no decrease in treatment capacity. In fact, the number of treatment machines in the province increased faster than the incidence of cancer.15
Consequences of Waiting Lists for Radiotherapy
Delays in starting RT are a source of great concern both to the patients and to those involved in their care. The potential adverse effects of a waiting list for RT are summarized in Table 11-2. Delays have both direct and indirect effects on the well-being of patients, and waiting lists also have broader economic and social consequences. It is useful to classify the direct effects of delay on the well-being of individual patients as nonstochastic or stochastic.19 These terms are used here as they have been used in the field of radiation protection, where they provide a useful distinction between the effects of radiation that depend on chance and those that do not. The nonstochastic effects of delay include the psychological distress caused by the delay and the physical symptoms resulting from the untreated cancer. They occur in most cases and often increase in intensity with time, although they may not occur at all until some initial threshold period has been exceeded. The stochastic effects of treatment delay include the development of metastases and failure to achieve local control with radiation. These are all-or-nothing phenomena. Their probability increases as a function of time, but their severity is independent of time, and there is no lower limit of waiting time below which they will not occur. Waiting lists may also have indirect adverse effects on patient care, mediated by changes in medical practice. In addition to their effects on health outcomes, waiting lists have important economic and societal implications.19
TABLE 11-2 Effects of Waiting Lists for Radiotherapy on Well-Being of Patients
| Direct Effects |
RT, radiotherapy.
Measuring the Direct Effects of Delays in Radiotherapy
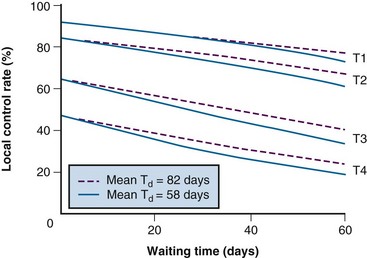
The risk of carcinogenesis has been estimated by mathematical modeling using the best available clinical data combined with principles derived from laboratory studies. Given the very scant direct evidence that was available about the impact of delay on outcomes in the early 1990s, a similar approach was initially used to estimate the risks of treatment delay.19 Figure 11-4 shows the predicted effects of delay in RT on local control in cancer of the oropharynx, derived from a mathematical model.19 The model was based on radiobiologic principles that had been validated in experimental systems, and it incorporated the best available clinical information about tumor doubling times and the relationship between tumor volume and local control.19 The model predicted a decrease in local control rates of between 5% and 10% per month of delay in the start of RT. Others have since made similar predictions.20,21 Although this approach was credible to radiation oncologists, it did not prove to be any more persuasive than expert opinion from the perspective of health system managers in our community. When decisions about the allocation of scarce resources are at stake, there is no substitute for direct clinical evidence.
Measuring the magnitude of the stochastic effects of treatment delay is not straightforward. It is inherently difficult to measure the risk of treatment failure resulting from delay, because local failures caused by delay are absolutely indistinguishable from treatment failures resulting from other causes. The problem is analogous to that of defining the risk of carcinogenesis associated with low-dose radiation. One cannot simply count the cancers caused by radiation because they are usually indistinguishable from the many other cancers that may occur in the population as the result of causes other than radiation. Rates of failure must, therefore, be compared in groups of patients who have been exposed to longer and shorter delays, and the challenge is to ensure that those groups are comparable with respect to all other relevant prognostic factors. A randomized trial would be the best way of creating truly comparable groups, but it would be unethical to randomize patients to timely RT versus delayed RT because there is no conceivable benefit in delay. Comparisons of the outcomes of RT in nonrandomized groups of patients who have waited longer or shorter periods of time are subject to all the biases that may affect any retrospective observational study. However, in this context, such studies are very important because they represent the best available direct source of information.22,23
Recent systematic reviews have identified a growing number of observational studies that have investigated the association between treatment delay and the outcome of radiotherapy in certain clinical situations.24 Figure 11-5 summarizes the results of the 20 high-quality studies included in the most recent published meta-analysis.24 Most of these studies had been done in the context of head and neck cancer and breast cancer. In these two disease groups, meta-analysis has shown a significant increase in the risk of local recurrence in patients who waited longer for RT.24 A very large population-based outcomes study, not included in this meta-analysis, recently confirmed that delay was associated with a higher risk of local failure after postlumpectomy RT for breast cancer.25 No evidence of a threshold below which delay was free of risk was found. Moreover, although there was less evidence of an association between delay and local control in sites other than breast and head and neck, there were insufficient data available to conclude that delay in RT is free of this risk in any situation.
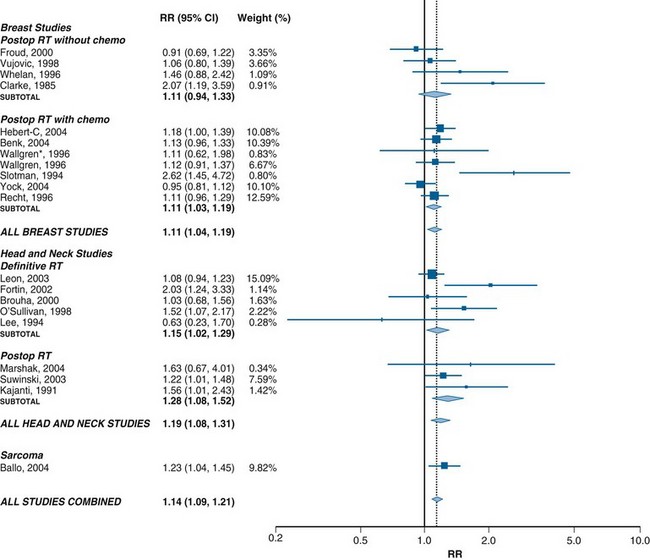
No significant association was found between delay in RT and the risk of distant metastasis, although there was less information available about this outcome.24 There was a small but significant decrease in survival with increasing delay in head and neck cancer.24
The relative risk of local recurrence of 1.1 per month of delay in starting postoperative RT for breast cancer translates into an absolute increase in recurrence rate of about 1% per month of delay in a population with a baseline rate of local recurrence of 10%.24 Although this is a small risk for any individual, it has the potential to cause an important increase in the number of recurrences at the population level. The increase in the relative risk of recurrence by 1.15 per month of delay in patients undergoing definitive RT for head and neck cancer translates into an absolute increase in risk of recurrence of 3% in a population with a baseline risk of failure of 20% or an absolute increase of 6% in a population with a baseline risk of failure of 40%.24 Interestingly, these findings are consistent with those predicted by the mathematical models described earlier.19,21 Thus a few weeks of delay in RT may have an adverse effect on outcome that is sufficient to cancel out all the improvements in outcome achieved by advances in the practice of RT over the past 20 years.21,22 Given that there is no theoretical reason to think that there is a threshold below which delay is safe, it would be prudent to adopt the principle that delays in RT should be as short as reasonably achievable (ASARA), modeled on the as low as reasonable achievable (ALARA) principle, which guides risk management in the field of radiation protection.22
Indirect Effects of Waiting Lists for Radiotherapy on Patient Care
The indirect effects of waiting lists on patient care and population health are summarized in Table 11-2. The phenomenon of implicit rationing by which waiting lists reduce the use of RT has already been described (see Kinetics of Waiting Lists). Waiting lists may also increase the use of alternative treatments that may be less effective, more morbid, and more expensive than RT. There is evidence that long waiting lists may cause radiation oncologists to modify the way they prescribe RT. A study from the Queensland Radium Institute showed a significant negative correlation between waiting times and the number of fractions prescribed per course.26 This was due primarily to decreases in palliative fractionation as waiting times increased.20 A similar association between prevailing waiting time and the choice of fractionation for bone metastases was found in Ontario.27 There are obviously serious risks in deviating from accepted practice in radiation oncology for the sole purpose of getting more patients treated. However, in circumstances in which randomized trials have demonstrated that shorter courses of RT are equivalent to longer courses of treatment, adoption of the more parsimonious approach has the potential to reduce overall workload and greatly increase the availability of RT, without adversely affecting outcomes.28 The challenge is to ensure that shorter-than-standard courses of RT are used only in circumstances in which they have been shown to be medically appropriate. Under conditions of scarcity of resources, it is particularly important to have explicit standards of care to prevent deterioration of quality in the attempt to maintain accessibility.
Societal Effects of Waiting Lists for Radiotherapy
Waiting lists for RT are potentially costly (see Table 11-2). Patients require both care and counseling during delays, and the costs of alternative treatments may be considerably higher than those of RT. Waiting lists have sometimes caused patients to be referred to distant centers for RT with loss of continuity of care and support for patients and added costs to the health system. The inability to provide timely RT may also be frustrating and distressing for the staff of RT programs. Waiting lists also expose RT providers to legal liability. In Quebec, a class action suit was launched against the hospitals responsible for providing RT, on behalf of several thousand women who had to wait long periods for adjuvant RT after surgery for breast cancer. The judge accepted the evidence that delay was associated with an increase in the risk of local failure, and the case was ultimately settled with financial compensation for approximately 10,000 women who had waited for longer than 12 weeks to begin postoperative RT after lumpectomy.29 Chronic waiting lists for RT and other important medical services eventually became an important political issue. Waiting lists are often used as evidence of the need for change, both by advocates of privatization of the health system and by those who favor reinvestment in the public system. By the early 2000s, public opinion polls showed that “wait times” for medical care had become the greatest concern of most Canadian voters and there were increasing demands that government set waiting time standards.
Measuring Access to Radiotherapy
Limitations of Waiting Times as an Indicator of Access to Radiotherapy
The existence of a long waiting list for RT is a symptom of inadequate access to RT. The duration of the waiting time for RT may be directly related to the probability of an adverse outcome, and waiting times may therefore serve as a quantitative measure of the quality of care. The length of a waiting list, however, provides no information about the magnitude of the shortfall between supply and demand, and waiting times cannot, therefore, serve as a quantitative measure of accessibility. The absence of a waiting list does not mean that access is optimal. Waiting lists develop only in response to supply-side problems in the availability of services. Waiting times are entirely insensitive to demand-side problems with respect to spatial accessibility, accommodation, affordability, or awareness (see Table 11-1). Problems in those dimensions of accessibility, in fact, reduce demand and may serve to reduce or avoid waiting lists. To ensure appropriate access to RT, it is necessary to monitor RT utilization rates as well as waiting times.
Defining Accessibility of Radiotherapy
The best quantitative measure of the accessibility of any service is the rate of its appropriate utilization, that is, the proportion of patients who need a service who actually receive it. The term need is used here as defined by Cuyler,30 who states that “the need for medical care exists when an individual has an illness for which there is effective and acceptable treatment.”
Measuring Accessibility of Radiotherapy
The incidence of cancer (i.e., number of new cases diagnosed in the population of interest, over the period of interest) may be used as the denominator for describing the rate use of RT in the initial management of the disease. The best way to establish the proportion of cases that are treated with RT is to follow all of them forward in time from the date of diagnosis and find out if and when the patient received RT. The approach was first used in the Netherlands31 and subsequently was used to describe the use of RT in Ontario.14 The estimated rate of use of RT in the initial management of cancer depends on the cutoff point in time used to define initial RT. If a short cutoff point is chosen to define initial RT (e.g., RT within 3 months of diagnosis), the indicator will miss some patients who receive adjuvant RT after surgery. If a longer cutoff point is chosen (e.g., RT within 1 year), the indicator will include almost all patients who receive RT as part of their initial management, but it will also wrongly include some patients who are actually receiving RT for an early recurrence after primary surgery. The best cutoff point depends on the specific disease under consideration. For practical purposes, the proportion of incident cases treated within 1 year of diagnosis has been used to describe the initial use of RT in the general cancer population.14 Figure 11-6A describes variations in the use of RT in the initial management of cancer in Ontario in terms of this indicator (R1 year).
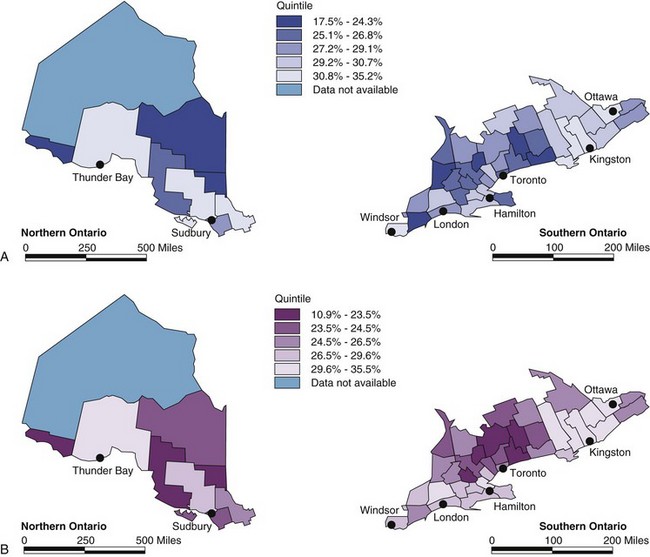
The incidence of cancer is a less suitable denominator for describing the utilization of palliative RT, because a high proportion of incident cases will never develop indications for palliative RT and many of those who ultimately do need palliative RT will not require it until years after the diagnosis. It is preferable to describe the use of palliative RT among patients who die of their cancer. This can be accomplished by identifying patients who died of their disease in a population-based cancer registry and following them back in time to identify those who received RT within a defined interval before death.32 Figure 11-6B describes variations in the use of palliative RT in the past 2 years of life among patients who died of their disease in Ontario. The same approach lends itself well to the description of the rates of use of other types of care in the terminal phase of the illness.
What Factors Affect the Rate of Radiotherapy in the General Cancer Population?
Figure 11-6 illustrates geographic variations in the rate of use of RT in Ontario, with the highest rates being observed in the counties where RT facilities are located.14 It has generally been found that rates of RT use are higher in urban than in rural areas33 and that proximity to an RT facility is associated with higher utilization rates.14 Taken together, these observations suggest that spatial accessibility is an important determinant of the accessibility of RT. In studying geographic variations in practice, it is obviously important to be able to distinguish systematic variation from variations caused by chance alone but modeling techniques have been developed that can be used to isolate the systematic component of variation.14 Multiple factors are involved in determining patients’ eligibility for RT, and multivariate analysis is helpful in distinguishing the impact of health system-related factors from patient-related factors on the use of RT.
Measurements of RT use have revealed unexpected inequities in access to care. Figure 11-7 shows that rates of use of palliative and adjuvant RT decrease with increasing age, and that this decrease is far greater than can be explained as the result of declining performance status.34 Table 11-3 shows the results of a multivariate analysis that examined factors associated with the use of palliative RT among patients in Ontario who died of their cancer. Rates of use of palliative RT proved to be significantly lower among patients whose diagnosis was made in a hospital without an RT facility,32 which confirms the concern that the lack of awareness of the indications for RT among other health care professionals may also be a significant factor in determining accessibility.33 Table 11-3 also illustrates that, even in the context of a publicly funded health care system, the socioeconomic status of the patient influences the likelihood of receiving palliative RT.
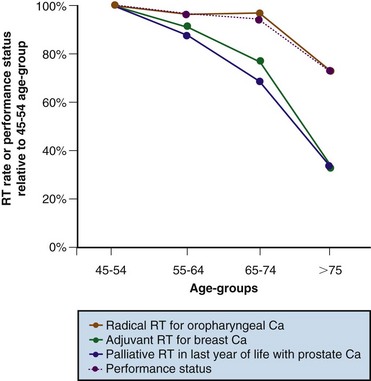
TABLE 11-3 Factors Affecting the Use of Palliative Radiotherapy in Ontario*
| Odds Ratio | 95% CI | |
|---|---|---|
| Median Household Income† | ||
| Low, <$20,000 | 1.00 | |
| Medium, $20,000-$50,000 | 1.09 | 1.04-1.15 |
| High, >$50,000 | 1.17 | 1.11-1.24 |
| RT Department in Diagnosing Hospital | ||
| No | 1.00 | |
| Yes | 1.35 | 1.30-1.40 |
| Proximity of Patient’s Home to Nearest RT Center | ||
| No RT center in county of residence | 1.00 | |
| RT center in county of residence | 1.24 | 1.21-1.27 |
| Region | ||
| Northeast Ontario | 0.84 | 0.79-0.90 |
| Toronto | 0.88 | 0.84-0.92 |
| Windsor | 0.90 | 0.84-0.97 |
| Ottawa | 1.00 | |
| London | 1.02 | 0.97-1.07 |
| Northwest Ontario | 1.04 | 0.96-1.13 |
| Kingston | 1.17 | 1.11-1.26 |
| Hamilton | 1.20 | 1.14-1.26 |
* From a logistic regression that controlled for age, sex, and primary site.
Measuring the Need for Radiotherapy
Given that the use of RT varies widely, it is important to ask what proportion of patients with cancer need RT. In the past, it was often stated that approximately 50% of patients with cancer should receive RT at some point in the course of the illness, but that recommendation was based almost entirely on expert opinion.35 Two more objective methods have since been developed for estimating the need for RT.
Evidence-Based Requirements Analysis
Evidence-based requirements analysis (EBRA) is an objective method that has been used to estimate the need for RT. The indications for RT are first identified by systematic review. Next, an epidemiologic approach is used to estimate how frequently each indication for RT occurs in the population of interest. Finally, the results of the systematic review and the epidemiologic analysis are combined to estimate the overall need for RT. In this context, the term need can be equated with the appropriate rate of utilization of RT,30 and the two terms may be used interchangeably. Tyldesley and associates36 described this method and used it first to estimate the need for RT lung cancer. This method subsequently has been refined and used in several other major cancer sites.37 The strengths of the method are that it is transparent, in that all the assumptions involved are explicit, and that it is flexible, and models can be adapted to reflect the case mix in any community of interest or to explore the implications of changes in the indications for RT. The main weaknesses of the approach are that it is complex and time consuming and, like any other type of modeling, its results are only as good as the information on which it is based. EBRA can be expected to produce valid results when it is applied to major cancers where the indications for RT are well defined and there is sufficient epidemiologic information available to estimate the frequency with which each indication occurs. Delaney and colleagues38 extended the use of this method to measure the need for RT across the whole spectrum of malignant disease and it is now being widely used to predict requirements for RT equipment.
Criterion-Based Benchmarking
An alternative way of estimating the appropriate rate of the use of RT is to use a series of observations to derive a “benchmark.” In the business world, benchmarking has been defined as “measuring products against the toughest competitors or those recognized as industry leaders.”39 In the field of health care, the equivalent is to measure outcomes against the best achieved anywhere or against those achieved in recognized centers of excellence. The same concept may be applied in setting benchmarks for the appropriate rate of utilization of any given treatment. The rate observed under certain specific conditions may be equated with the appropriate rate of utilization—in other words, with the need for treatment. Benchmarks for the utilization of RT should be set in communities where there is expert decision making about the use of RT and unimpeded access to RT. To ensure unimpeded access, there should be no financial barriers, referring physicians should be aware of the indications for RT, and patients should have convenient access to a nearby RT center that has sufficient capacity to provide prompt treatment. To ensure optimal decision making, decisions about the use of RT should be made by experts practicing in a multidisciplinary setting and, ideally, the decision to treat should not affect their remuneration. If these criteria are met, it is reasonable to expect that the observed rate of utilization of RT will approximate the appropriate rate. We call this approach criterion-based benchmarking.40
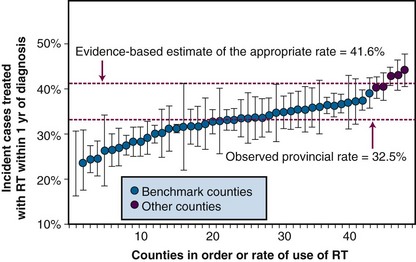
Communities in Ontario that meet the listed criteria have been used to set benchmarks for the appropriate rate of utilization of RT for lung cancer.40 Figure 11-8 shows that, in this context, estimates of the appropriate rate of RT generated by this method are very similar to those derived from the evidence-based approach. The criterion-based benchmarking method has several strengths:
It also has several weaknesses:
Once utilization and need have been measured, it is straightforward to calculate the level of unmet need. Consider the data shown for lung cancer in Figure 11-8. It was estimated that approximately 41.5% of patients with lung cancer need RT as part of their initial management but the observed rate of RT use was only was 32.5%. Thus only 78.3% of patients who needed RT actually received it. The approximately 22% shortfall between the observed rate and the appropriate rate represents an important opportunity for improving outcomes of lung cancer.
Studying the Quality of Radiotherapy
Concepts of Quality and Effectiveness in Health Care
Almost 40 years ago, Donabedian41 defined quality as “a property of, and a judgment upon, some definable unit of health care, and that care is divisible into at least two parts: technical and interpersonal.” The quality of technical care is measured by the extent to which “the application of medical science and technology maximizes its health benefits without correspondingly increasing its risks.” The quality of interpersonal care is measured by “how well the physician-patient interaction meets the socially defined norms of the relationship.”41 Although others may define it somewhat differently today, there is universal agreement that quality is a multidimensional concept that embraces both the technical and personal elements of care.
Donabedian41 also provided an approach for evaluating and improving quality, which Kramer and Herring42 soon astutely recognized as being appropriate for use in radiation oncology. Donabedian’s approach was to analyze the quality of programs in terms of structure, process, and outcome. The term process is used here to describe the way that care is delivered. In the context of radiation oncology, it includes pretreatment assessment, medical decision making, planning, delivery of RT, and supportive care during RT, and so on. The term structure is used broadly to include facilities, equipment, manpower, and organizational structures. The term outcome is used here, as in clinical practice, to describe the consequences of the care that has been provided. It is reasoned that (1) optimal process is necessary for optimal outcome; (2) adequate structure is necessary, although not sufficient, for optimal process; and (3) outcomes may be enhanced by identifying and correcting deficiencies in structure and/or deficiencies in process. This became the philosophy of the U.S. Patterns of Care Study (PCS) that was established by Kramer in 1970. It operates on the premise that practice variations exist, differences in process and outcome can be measured, and deficiencies can be corrected.42 The Patterns of Care Study continues this important work today under the new title of Quality Research in Radiation Oncology (QRRO).
Descriptive Studies of the Structure of Radiotherapy Programs
In a highly technical specialty such as radiation oncology, optimal care can be provided only when the necessary technologic infrastructure is in place, including the correct mix and quantity of equipment and the correct mix and quantity of personnel. Nationwide surveys of RT facilities have now been done in many different countries. In the United States, the PCS/QRRO has taken the lead in describing the basic structural characteristics of radiation oncology facilities for the entire country. Its comprehensive survey of the structure of U.S. facilities serves as the starting point for national surveys of treatment processes and outcomes and permits stratified sampling of different types of facilities.43 In addition to evaluating equipment and personnel, PCS/QRRO has described the structure of RT facilities in the following terms: (1) whether they have resident training programs or not, (2) volume of new cases treated per annum, (3) whether they were headed by a full-time or part-time radiation oncologist, and (4) participation in clinical trials.
In Europe a variety of government groups,44 agencies,45 and individual investigators46 have conducted national surveys of RT program infrastructure, primarily as a basis for planning. Most national surveys reveal considerable diversity with respect to the level of technology and expertise that is available in different RT centers, particularly with respect to brachytherapy. The European Society for Therapeutic Radiology (ESTRO) has more recently taken the lead describing and comparing the infrastructure of RT programs across Europe in a project called Quantification of Radiation Therapy Infrastructure and Staffing (QUARTS), funded by the European Commission.47 QUARTS involves an international survey of equipment and personnel, the establishment of guidelines for levels of staffing and equipment, and the estimation of future needs based on projected incidence and estimates of the need for RT.
The concept of program structure embraces not only physical infrastructure but also organizational structures, including systems of funding, management, and governance. These elements of structure in radiation oncology may also have important effects on processes, but they have generally received less attention than the physical elements of structure. Funding arrangements at European RT centers listed in the ESTRO directory were investigated as part of an international study of palliative RT.48 A broad range of funding mechanisms for RT departments is described, including a global budget, per case payments, fee for service, and all possible combinations thereof. RT centers in Spain, the United Kingdom, and the Netherlands were mainly funded by a global budget plus or minus per case payments, whereas the majority of centers in Germany and Switzerland received most of their funding through a fee-for-service arrangement.48
Prescribing Technology Assessment
New technologies are being developed rapidly, and the specialty of radiation oncology needs to develop better ways of evaluating them and of determining their appropriate place in routine clinical practice. Wherever possible, new treatment techniques should be evaluated in randomized clinical trials, but it is clear that this approach only lends itself to the study of relatively common presentations of relatively common diseases. A large component of the practice of radiation oncology, however, is directed toward patients who have one of the many less common cancers or one of the infinite range of unusual presentations of a common cancer. In neither of these situations is there ever going to be “level 1 evidence” to guide our practice, and it would be impossible for a new approach to treatment to achieve their full potential if level 1 evidence was demanded for its use in every situation. On the other hand, if the choice is made to make our decisions about the acquisition and use of new technologies based only on the manufacturers’ claims of enhanced precision, patients may be exposed to added risks and added costs without real benefits.49
Studies of Process in Radiotherapy
Research on Quality Assurance Processes in Radiotherapy
The RT community has long recognized the importance of routine QA because of the potential for a malfunctioning or wrongly calibrated machine to cause systematic errors in the treatment of a large number of patients. Detailed guidelines and protocols have therefore been developed for commissioning, maintenance, and calibration of treatment machines.50 However, neither the existence of such guidelines nor an organizational commitment to adhere to them is sufficient to guarantee patient safety. A seminal study undertaken some years ago by Horiot and coauthors51 on behalf of the European Organization for Research and Treatment of Cancer (EORTC) revealed that some centers made systematic errors in radiation dosimetry. This study also showed that feedback of the results of the initial survey diminished the frequency of such errors when the study was later repeated.52
Although QA on equipment reduces the chance of systematic error, the requirement for individualization of treatment plans creates the added risk of random error caused, for example, by lapses in human judgment or miscommunication. It has been shown that although well-defined care paths or intervention-specific guidelines can minimize the frequency of this type of error, it does not eliminate them. Real-time audit is necessary to avoid rare but potentially serious errors in the context of routine practice,53 and even in the controlled setting of clinical trials.54 The general rule that emerges from these analyses is that human errors cannot all be avoided but the vast majority can be detected before they have any adverse impact on the patient. Understanding why errors occur is now recognized as the key to development of better processes for their avoidance in future, and the epidemiology of medical errors is therefore a growing field of study.55 Because actual errors are rare, it is important also to investigate near misses56 and this is the approach that is now widely being used in the field of RT.57,58 Although several recent accidents have heightened awareness of the dangers of RT,59 serious errors that result in harm to patients are exceptionally rare in comparison to error rates in other fields of medicine.60 The low error rates in RT were not achieved by chance; they reflect a longstanding awareness of the dangers of RT and a tradition of commitment to QA that antedates the intense media attention directed to medical error over the past decade. Nonetheless, new technologies bring new risks of error, and there is a need for continuing research in field of QA in RT.
Research on Practice Patterns in Radiotherapy
During the past 30 years there have been numerous studies of patterns of care in radiation oncology using methods primarily developed by the PCS.61 Many different clinical situations have been studied. Most work has been done in the major sites in which RT plays an important role in curative treatment, but there have also been a number of studies of the practice of palliative RT, particularly in the context of bone metastasis. Striking variations in practice have been discovered in every situation that have been studied in detail. Practice has been shown to vary at many different points in the pathway of care: in pretreatment assessment; in fundamental aspects of the RT prescription, including target volumes, treatment techniques, and dose and fractionation; in decisions about adjunctive systemic treatment; in the planning process; in treatment delivery; in the way that treatment details are recorded; in supportive care during and after treatment; and in arrangements for long-term follow-up.
Why Does Practice Vary in Radiation Oncology?
Impact of Program Structure on the Practice of Radiotherapy
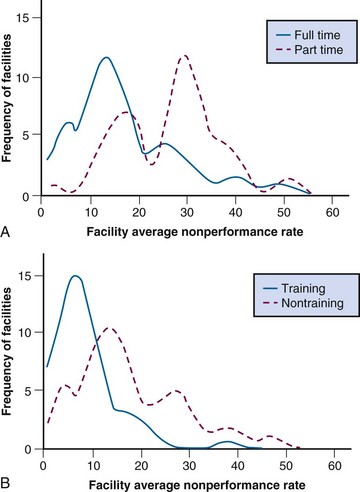
Consistent with Donabedian’s concept, there is abundant evidence that physical and organizational structures determine processes in RT. If the total availability of personnel and equipment is not adequate to permit prompt access to RT, referring physicians may choose alternative forms of treatment. Many studies have revealed that radiation oncologists’ choices of investigations, treatment techniques, and fractionation schemes are influenced by the resources available. The PCS has consistently found significant associations between the structural characteristics of facilities and the quality of processes involved in patient care. For example, in a now classic study of workup and treatment procedures in head and neck cancer,62 the PCS found significantly poorer compliance with its criteria of appropriateness of assessment, treatment, and other aspects of care among patients treated at nontraining facilities compared with training facilities (Fig. 11-9A) and at facilities headed by a part-time, rather than full-time, radiation oncologist (see Fig. 11-9B).
Impact of Scientific Evidence on the Practice of Radiotherapy
Practice varies most where there is least evidence available. Decision making about the use of RT has been shown to be highly variable in the context of adjuvant RT. This is most evident where the value of RT has not been confirmed in randomized trials. Although many indications for RT are supported by the results of randomized trials, there have been far fewer formal comparative studies of the details of RT prescriptions and techniques. Not surprisingly, technical practice of RT is even more variable than clinical decision making in radiation oncology. Even in situations in which there have been several consistent published reports that appear to indicate that one approach is superior to another, it has been shown that physicians may interpret these data very differently and therefore may still vary widely in their treatment recommendations.63
There has been much interest in enhancing the practice of medicine through the synthesis and dissemination of scientific knowledge in the form of treatment guidelines. Guidelines are clearly valuable for reference purposes, but it is not clear to what extent they have actually succeeded in modifying practice in the general population. Changes in practice have sometimes been reported after the introduction of treatment guidelines, but it is usually impossible to conclude that the guidelines themselves were responsible for those changes.64
Scientific evidence appears to vary in its impact depending on the practice environment and also on the demographic characteristics of the patients. In 2001, the U.S. Commission on Cancer reported that breast-conserving surgery was still used in less than 50% of U.S. patients with stage 1 and 2 breast cancer and that variations in its use were not consistent with existing practice guidelines.65 Breast conservation was more rapidly and completely adopted in urban than in rural areas and there were large geographic variations in its adoption across the United States, with much higher rates in the northeast than elsewhere. Older patients and patients from lower socioeconomic groups were less likely than others to have a partial mastectomy, and those who did were less likely to receive postoperative RT. There is also evidence that the characteristics of physicians and their type of practice influence the extent to which they rely on guidelines or other published information in reaching treatment decisions. Reliance on published information in decision making is greater in academic centers and decreases the longer the physician has been in practice.66 Local policies may affect practice more than national guidelines. A study from the United Kingdom, for example, showed that much of the variation in the use of postoperative RT for breast cancer was attributable to variations in the local management protocols of surgical units.67
Impact of Physicians’ Beliefs on the Practice of Radiotherapy
There is abundant evidence that physicians’ beliefs about appropriate treatment are shaped by factors other than universal knowledge. Physicians’ views about the indications for RT are strongly influenced by their training and experience. Because the key decisions about referral are usually made by surgeons, the views of the surgical community are a major determinant of the role that RT plays in cancer care at the population level. It has repeatedly been shown that surgeons are less likely to recommend RT than radiation oncologists, particularly when a choice has to be made between primary RT and primary surgery. For example, in comparison to radiation oncologists, urologists are less likely to recommend primary RT for prostate cancer68 and otolaryngologists are less likely to recommend RT for laryngeal cancer.69 Medical oncologists today have acquired a significant role in initiating referrals to radiation oncology, but their views about the indications for RT also differ significantly from those of radiation oncologists.63
Impact of Financial Incentives and Disincentives on the Practice of Radiotherapy
There is evidence that funding mechanisms may affect case selection for RT. For example, a study based on administrative claims data from Pennsylvania showed that a patient’s health insurance status was associated with the chance of receiving RT after a partial mastectomy. Postoperative RT was given in only 45% of Medicaid patients compared with greater than 75% of privately insured and Medicare patients and similar observations have been made elsewhere.70 Funding arrangements have also been shown to influence choices of fractionation in some studies. Lievens and colleagues71 have explored the effects of funding on patterns of palliative RT in Belgium. They found that fractionated courses of RT were prescribed more frequently than single treatments for bone metastases, at least in part because the funding mechanism in place at that time penalized the use of single fractions. In 2001, a new mechanism of funding of palliative RT was introduced in Belgium that removed the disincentive to single treatments. Since that time, there has been a trend to reduce the number of fractions prescribed in all except 3 of the 23 centers that responded to Lievens and colleagues’ most recent survey. Many of those centers reported that the change in the fee schedule was a significant factor in their decision to change practice.71 Lievens and colleagues have also shown significant associations between funding models and the practice of palliative RT in an international survey of RT centers across Europe. They found that centers funded by a global budget or per-case payment used a significantly lower number of fractions per course and were less likely to use shielding blocks than were centers funded by fee for service. The growing evidence that funding may shape the way that RT is practiced suggests that it may be possible to improve practice by appropriately manipulating reimbursement systems. However, there is also a high risk that poorly designed fee schedules may compromise quality of care.72 It has also been pointed out, under per-case funding arrangements, that profits may be inversely related to quality, making it very important to set clear baseline quality standards.73
Studies of Outcomes in Radiotherapy Programs
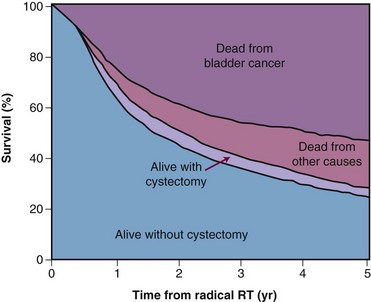
Surprisingly, it may be easier to measure outcomes than processes in the general population. Accurate information about vital status is usually available in cancer registries, and it may be quite straightforward to measure survival at the population level. Hospital records and billing files may provide information about subsequent surgical procedures that can sometimes provide surrogate measures of local control by RT. For example, survival without subsequent laryngectomy has been used as a surrogate for local control in measuring the success of radical RT for laryngeal cancer and survival without subsequent cystectomy has been used as a surrogate for local control after radical RT for bladder cancer (Fig. 11-10). The high statistical power of population-based studies also makes it possible to detect and quantify rare but serious late effects that it might be impossible to detect based on the analysis of experience of any individual institution.74
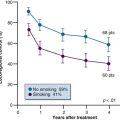
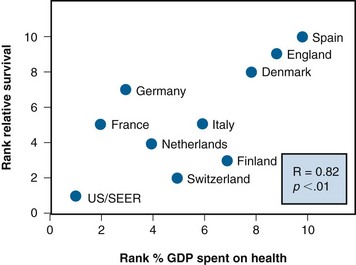
International variations in cancer outcomes are inevitably multifactorial in origin, and it is difficult to attribute them to any individual aspect of health system performance. Nonetheless, such comparisons have proved to be useful.75,76 Figure 11-11 shows international variations in cancer survival as a function of proportion of gross domestic product spent on health care. It demonstrates a remarkably clear relationship between investment in health care and cancer survival. It is impossible to determine whether the worse outcome observed in countries that spent less on health care was caused by more advanced stage of disease at diagnosis, higher levels of comorbidity, poorer access to care, or poorer quality of care. However, despite these uncertainties the message is clear that you get what you pay for. These results had a direct influence on public policy in the United Kingdom and were used to justify an expansion in the budget of the national health service’s cancer programs by almost $1 billion, permitting a massive expansion in the equipment and staffing of its radiation oncology programs.
It has also been shown that cancer outcomes are worse in residents of poorer communities than in residents of richer communities within the same country.75 Figure 11-12 shows variations in 5-year survival among patients from richer and poorer communities in Canada and the United States. There is a clear gradient in survival across socioeconomic strata in both countries. Some of the observed variation is caused by more advanced stage at diagnosis among the poorer groups, probably reflecting differences in access to care.75 Differences in quality of care may be responsible for some of the observed differences in survival not explained by differences in stage mix. These differences in outcome represent potential opportunities for improving overall outcomes at the population level.
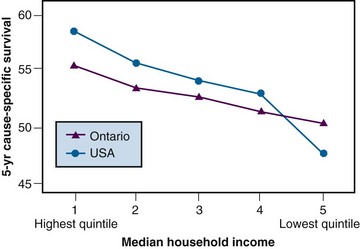
Before strategies can be developed for reducing these disparities, further studies are needed to explore their causes. Although the socioeconomic status/survival gradient is steeper in the United States, there is still a significant difference in outcome among residents of richer and poorer communities in Canada. This may seem somewhat surprising because Ontario has a single-payer, universal health care system with no parallel private health care sector, and in theory the rich do not have better access to care or quality of care than the poor. Clearly, however, the removal of financial barriers to access to care does not in itself abolish differences in outcome between rich and poor.75
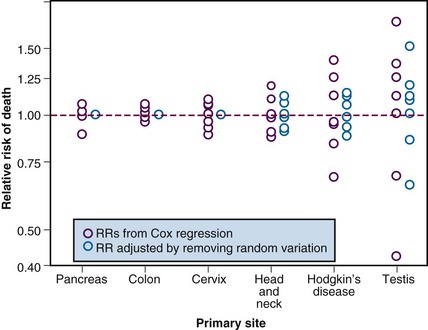
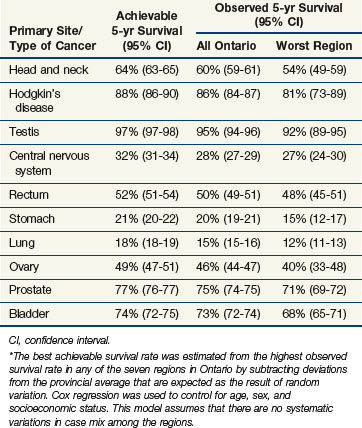
Interregional comparisons within the same country may also be informative. When dissimilar populations are compared, it is necessary to control for differences in case mix, but in the absence of any major interregional variations in socioeconomic status, systematic variations in case mix are unlikely. Under these circumstances, variations in outcome, which exceed those expected as the result of chance alone, may reasonably be attributed to variations in access or quality. Figure 11-13 shows the observed 5-year survival for several major cancer sites in eight different regions of Ontario. Once the observed variations are reduced to take account of the expected variation resulting from chance alone, the best observed outcomes may be used as a benchmark for the achievable outcome. It can be seen that, after adjusting for variation resulting from chance alone, there were no residual geographic variations in the outcome of cancers of the pancreas, colon, or cervix but there remained important geographic variations of survival for head and neck cancer, Hodgkin’s disease, and testicular cancer. Table 11-4 shows the observed 5-year survival for the province as a whole compared with the estimated achievable survival for several diseases in which geographic variation in outcome exceeded that expected because of chance alone. Although such studies can demonstrate the potential to improve outcome by improving quality, they do not reveal where the defects in quality lie. Further studies are required to identify specific defects in the underlying processes and structures.
Relating Structure and Process to Outcomes
Limitations of “Outcomes Research”
Studies that examine treatment and outcome in the context of routine care are often today referred as “outcomes research.” This type of study generally should not be used to try to evaluate the efficacy of treatment. It is notoriously difficult to control for bias in retrospective reviews of institutional experience.77 Comparisons of outcomes achieved in contemporaneous groups of patients who have received different types of treatment at the same institution are inevitably confounded by “treatment selection bias.” Comparisons of outcomes among groups of patients who received different treatments more or less contemporaneously at different institutions are less subject to treatment selection bias but are vulnerable to “referral bias” because of interinstitutional differences in case mix.77,78 The use of “historical controls” (i.e., the comparison of outcomes between patient groups who have received different treatment at different points in time) is also fraught with hazard.79 Case mix may change systematically over time; investigations may change, resulting in “stage migration”; and collateral aspects of care may also change. It is possible to reduce the impact of these types of bias by controlling for known prognostic factors, but these usually leave much of the variance in outcome unaccounted for. For these reasons, none of these types of retrospective, observational studies can substitute for prospective, experimental studies (i.e., randomized controlled trials) in the evaluation of efficacy of treatment. The credibility of the discipline of radiation oncology is weakened when these less valid methods are relied on in situations in which a randomized trial is possible.
Legitimate Roles of “Outcomes Research” in Evaluating Effectiveness
There are some important aspects of treatment that cannot and should not be studied in a randomized trial. It may be important, for example, to know how much outcomes are affected by deviation from standard practice, such as by delay in initiation of RT, protraction of overall treatment time, the use of lower than standard doses, or reliance on antiquated equipment. However, ethically patients cannot be randomized to receive nonstandard versus standard treatment when the only real purpose of the exercise is to measure the adverse consequences of the nonstandard approach. Learning about this type of issue can be done only by investigating the impact of inadvertent or unavoidable deviations from standard practice in retrospective, observational studies of the type discussed earlier.22,23
When a Randomized Trial Is Not Feasible
There are also issues that should ideally be addressed in a randomized trial but either cannot or will not be addressed in this way. Rare clinical problems are often impossible to study in randomized trials. It is impossible to sustain enthusiasm for any trial, or maintain the infrastructure necessary to support it, over a very protracted period of slow accrual. Large well-organized, multicenter clinical trial groups have a greater chance of success in this situation than any individual institution, but there are limits to what any group can do. Nearly all of what is known about the relationship between treatment and outcome in rare situations has to come from observational studies. In other situations, a clinical trial may be theoretically feasible but is rendered impossible by entrenched opposing views about treatment that effectively preclude recruitment to any trial. One such example was the controversy regarding the primary management of more advanced cancers of the larynx. The issue was hotly debated for decades, and opinions were highly polarized. The depth of the controversy is clearly illustrated in the results of an international mail survey of patterns of care in laryngeal cancer done in the early 1990s.69 This showed, for example, that most otolaryngologists in Canada, the United Kingdom, and Scandinavia regarded primary RT, reserving surgery for salvage, as the standard approach for T3 glottic cancer, whereas most of their counterparts in the United States and Australia favored primary laryngectomy.
Under these circumstances, it may be possible to learn about the relative effectiveness of the competing approaches by comparing the outcome they achieve at the population level. The rationale for this approach is that variations in practice driven by differences in physicians’ beliefs, or any other factors unrelated to the characteristics of the patients, can be treated as a natural experiment. If outcomes are compared at the population level and not at the level of the individual patient, the problem of treatment selection bias is avoided. To validate such a comparison, it is necessary either to demonstrate that the case mix in each of the populations that are compared is similar or to control for any observed variations in case mix. This method is sometimes referred to as the instrumental variable approach.80,81 Groome and colleagues82 have used it to compare the outcomes of treatment for locally advanced laryngeal cancer between Ontario, Canada, and the United States. They found that primary laryngectomy was used much more frequently in the United States than in Ontario, consistent with the results of the previous mail survey.69 Survival at 5 years proved to be identical in the two populations, whereas laryngectomy-free survival was significantly higher in Ontario than in the United States. These observations lend support to the position that primary RT, reserving surgery for salvage, permits retention of the patient’s natural voice without compromising survival.
Randomized clinical trials are unquestionably the best way of comparing the efficacy of a new treatment with the previous standard treatment. However, clinical trials rarely involved more than a small fraction of potentially eligible cases. Therefore, it cannot be taken for granted that the benefits observed in the context of the trial will be reproduced when the treatment is adopted in the general population. It has therefore been argued that population-based “phase IV” studies should be performed as new treatments are introduced into routine practice to evaluate their effectiveness in the real world.83,84 Table 11-5 describes some of the unique advantages of phase IV studies.
TABLE 11-5 Proposed Roles of Phase IV, Population-Based Outcomes Studies
| 1. |
From Booth CW, Mackillop WJ: Translating new medical therapies into society benefit. The role of population-based outcome studies [commentary]. JAMA 300:2177-2168, 2008.
Studying the Efficiency of Radiotherapy
Health economics involves much more than the measurement of health care costs, which most economists would regard as no more than accounting. However, economic analysis does require the measurement of costs, and a number of useful studies have been done in comparing alternative approaches for measuring the cost of RT85 and in defining units of workload to which costs can be assigned.86 In assessing the overall costs of RT, it is important to consider not only the direct costs of providing treatment but also the indirect costs of supportive care for complications of RT. It is important to specify the perspective from which an economic analysis is carried out. If the analysis is being conducted from the perspective of the RT provider, it may be appropriate to focus primarily on direct costs, whereas if the perspective is that of the health system as a whole, indirect costs incurred in other sectors must also be considered. If the analysis is being conducted from the societal perspective, loss of productivity as a consequence of the treatment needs to be included and balanced against loss of productivity resulting from the untreated disease.
Cost-minimization studies, often simply called cost studies, compare the costs of alternative treatments or processes on the explicit or implicit assumption that each produces similar health outcomes. In RT, this type of study has provided information pertinent to decisions about the acquisition of new equipment,87 about the decision to purchase or lease equipment,88 about service contracts,89 and so on. In some instances, simple cost comparisons have been done between slightly different approaches to treatment, such as high-dose rate versus low-dose rate brachytherapy.90
Cost-effectiveness studies compare alternative treatments or processes with respect to their effectiveness, as well as their cost. Effectiveness is usually described in terms of a single objective outcome measure, such as survival. This is useful in that it enables us to put a dollar value on the outcomes achieved by RT, and it has often revealed that RT is relatively inexpensive in relation to the benefits it delivers.91,92
Because cost-effectiveness analysis describes the benefits of treatment in terms of a single measure of outcome, it does not provide a satisfactory way of describing and comparing the value of treatments that are associated with different types of health benefit, such as radical RT for cervical cancer and palliative RT for bone metastases. Survival alone is an inadequate measure of palliative RT, and quality of life is an inadequate measure of the effectiveness of curative treatment. The concept of utility, a measure of the relative value of different life states, is useful in reducing the benefits of treatment to a common currency. If utility can be measured, and there is still some question as to whether this is really possible, years of survival can be adjusted for relative value and outcomes expressed as quality-adjusted life-years (QALYs). This measure is sensitive to both duration of survival and quality of life. Cost per QALY can be used to compare the value of treatment in curative and palliative contexts. The value of other forms of medical care has been measured in cost per QALY, and this permits comparison of the value of RT with the value of other treatments both in oncology and in other spheres of medicine.93,94
2 Penchansky R, Thomas JW. The concept of access. Definition and relationship to consumer satisfaction. Med Care. 1981;19:127-140.
3 . The 58th World Health Assembly Declaration. WHA 58.22: Cancer Prevention and Control. Available at www.who.int/cancer/media/news/WHA58%2022-en.pdf
4 Klausen OG, Olofsson J, Rosengren B. A long waiting time for radiotherapy. Not acceptable for patients with neoplasms. Tidsskr Nor Laegeforen. 1989;109:2324-2325.
13 Mackillop WJ, Zhou Y, Quirt CF. A comparison of delays in the treatment of cancer with radiation in Canada and the United States. Int J Radiat Oncol Biol Phys. 1995;32:531-539.
14 Mackillop WJ, Groome PA, Zhou Y, et al. Does a centralized radiotherapy system provide adequate access to care? J Clin Oncol. 1997;15:1261-1271.
15 Mackillop WJ, Zhou S, Groome PA, et al. Changes in the use of radiotherapy in Ontario: 1984-1995. Int J Radiat Oncol Biol Phys. 1999;44:355-362.
17 Mechanic D. Dilemmas in rationing health care services. The case for implicit rationing. BMJ. 1995;310:1655-1659.
18 Thomas SJ, Williams MV, Burnet NG, et al. How much surplus capacity is required to maintain low waiting times? Clin Oncol. 2001;13:24-28.
19 Mackillop WJ, Bates JHT, O’Sullivan B, et al. The effect of delay in treatment on local control by radiotherapy. Int J Radiat Oncol Biol Phys. 1996;34:243-250.
21 Jensen AR, Nellemann HM, Overgaard J. Tumor progression in waiting time for radiotherapy in head and neck cancer. Radiother Oncol. 2007;84:5-10.
22 Mackillop WJ. Killing time. The consequences of delays in radiotherapy. Radiother Oncol. 2007;84:1-4.
23 Sackett D, Haynes BR, Guyatt GH, et al. Deciding whether your treatment has done harm. In: Clinical Epidemiology: A Basic Science for Clinical Medicine. Boston: Little Brown; 1991.
24 Chen Z, King W, Pearcey R, et al. The relationship between waiting time for radiotherapy and clinical outcomes. A systematic review of the literature. Radiother Oncol. 2008;87:3-16.
25 Punglia RS, Saito A, Neville BA, et al. Impact of interval from breast conserving surgery to radiotherapy on local recurrence in older women with breast cancer: Retrospective cohort analysis. BMJ. 2010;340:cd845.
26 Franklin CI, Poulsen M. How do waiting times affect radiation dose fractionation schedules? Austral Radiol. 2000;44:428-432.
27 Kong W, Zhang-Salomons J, Hanna T, Mackillop WJ. A population-based study of the fractionation of palliative radiotherapy for bone metastasis in Ontario. Int J Radiat Oncol Biol Phys. 2007;69:1209-1217.
30 Cuyler AJ. Need and the National Health Service: Economics and Social Choice. Lanham, MD: Rowman and Littlefield; 1976.
31 de Jong B, Crommelian M, Heijden LH, et al. Patterns of radiotherapy for cancer patients in the south eastern Netherlands, 1975-1989. Radiother Oncol. 1994;31:213-221.
33 Denham JW. How do we bring an acceptable level of radiotherapy services to a dispersed population? Austral Radiol. 1995;39:171-173.
34 Tyldesley S, Zhang-Salomons J, Groome P, et al. Association between age and the utilization of radiotherapy in Ontario. Int J Radiat Oncol Biol Phys. 2000;47:469-480.
36 Tyldesley S, Boyd C, Schulze K, et al. Estimating the need for radiotherapy for lung cancer. An evidence-based, epidemiological approach. Int J Radiat Oncol Biol Phys. 2001;49:973-985.
38 Delaney G, Jacob S, Featherstone C, Barton M. The role of radiotherapy in cancer treatment. Estimating optimal utilization from a review of evidence-based clinical guidelines. Cancer. 2005;104:1129-1137.
39 Bogan CE, English MJ. Benchmarking for Best Practices: Winning through Innovative Adaptation. New York: McGraw-Hill; 1994.
40 Barbera L, Zhang-Salomons J, Huang J, et al. Defining the need for radiotherapy for lung cancer in the general population. A criterion-based, benchmarking approach. Med Care. 2003;41:1074-1085.
41 Donabedian A. Evaluating the quality of medical care. Milbank Memorial Fund Q. 1966;44:166-206.
42 Kramer S, Herring D. The patterns of care study. A nation-wide evaluation of the practice of radiation therapy in cancer management. Int J Radiat Oncol Biol Phys. 1976;1:1231-1236.
47 Bentzen S, Heeren G, Cottier B, et al. Evidence-based guidelines for radiotherapy infrastructure and staffing needs in Europe. The ESTRO QUARTS project. Radiother Oncol. 2005;75:355-365.
48 Lievens Y, Van den Bogaert W, Rijnders A, et al. Palliative radiotherapy practice within western European countries. Impact of the radiotherapy financing system. Radiother Oncol. 2000;56:289-295.
49 Glatstein E. The return of the snake oil salesmen. Int J Radiat Oncol Biol Phys. 2003;55:561-562.
52 Horiot JC, van der Schueren E, Johansson KA, et al. The program of quality assurance of the EORTC radiotherapy group. A historical overview. Radiother Oncol. 1993;29:81-84.
53 Brundage MD, Dixon PF, Mackillop WJ, et al. A real-time audit of radiation therapy in a regional cancer center. Radiat Oncol Biol Phys. 1999;43:115-124.
54 Rischin D, Peters L, O’Sullivan B, et al. Tirapazamine, cisplatin, and radiation versus cisplatin and radiation for advanced squamous cell carcinoma of the head and neck (TROG 02.02, HeadSTART). A phase III trial of the Trans-Tasman Radiation Oncology Group. J Clin Oncol. 2010;28:2989-2995.
55 Weingart SN, Wilson Ross M, Gibbard RW, Harrison B. Epidemiology of medical error. BMJ. 2000;320:774-777.
58 Holmberg O, McClean B. Preventing treatment errors in radiotherapy by identifying and evaluating near misses and actual incidents. J Radiother Pract. 2002;3:13-25.
60 Shafiq J, Barton M, Noble D, et al. An international review of patient safety measures in radiotherapy practice. Radiother Oncol. 2009;92:15-21.
62 MacLean CJ, Davis LW, Herring DF, et al. Variation in work-up and treatment procedures among types of radiation therapy facilities. The patterns of care process survey for three head and neck sites. Cancer. 1981;48:1346-1352.
63 Raby B, Pater J, Mackillop WJ. Does knowledge guide practice? Another look at the management of non–small cell lung cancer. J Clin Oncol. 1995;13:1904-1911.
69 0’Sullivan B, Mackillop WJ, Gilbert R, et al. Controversies in the management of laryngeal cancer. Results of an international survey of patterns of care. Radiother Oncol. 1994;31:23-32.
70 Richardson LC, Schulman J, Sever LE, et al. Early-stage breast cancer treatment among medically underserved women diagnosed in a national screening program, 1992-1995. Breast Cancer Res Treat. 2001;69:133-142.
71 Lievens Y, van den Bogaert W, Kesteloo K. The palliative treatment of bone metastases. An update on practice patterns and incentives in Belgium. Radiother Oncol. 2004;73(Suppl):324.
72 Borgelt BB, Stone C. Ambulatory patient classifications and the regressive nature of Medicare reform. Is the reduction in outpatient health care reimbursement worth the price? Int J Radiat Oncol Biol Phys. 1999;45:729-734.
75 Boyd CJ, Zhang-Salomons J, Groome PA, et al. Associations between community income and cancer survival in Ontario and the United States. J Clin Oncol. 1999;17:2244-2255.
76 Evans BT, Pritchard C. Cancer survival rates and GDP expenditure on health. A comparison of England and Wales and the USA, Denmark, Netherlands, Finland, France, Germany, Italy, Spain, and Switzerland in the 1990’s. Public Health. 2000;114:336-339.
80 Newhouse JP, McClellan M. Econometrics in outcomes research. The use of instrumental variables. Ann Rev Public Health. 1998;19:17-34.
82 Groome PA, O’Sullivan B, Irish JC, et al. Glottic cancer in Ontario, Canada and the SEER areas of the United States. Do different management philosophies produce different outcome profiles? J Clin Epidemiol. 2001;54:301-315.
83 Booth CM, Mackillop WJ. Translating new medical therapies into societal benefit. The role of population-based outcome studies. JAMA. 2008;300:2177-2179.
84 Pearcey R, Miao Q, Kong W, et al. Impact of adoption of chemoradiotherapy on the outcome of cervical cancer in Ontario. Results of a population-based cohort study. J Clin Oncol. 2007;25:2383-2388.
85 Hayman JA, Lash KA, Tao ML, et al. A comparison of two methods for estimating the technical costs of external beam radiation therapy. Int J Radiat Oncol Biol Phys. 2000;47:461-467.
91 Malin JL, Keeler E, Wang C, et al. Using cost-effectiveness analysis to define a breast cancer benefits package for the uninsured. Breast Cancer Res Treat. 2002;74:143-153.
92 Barbera L, Walker H, Foroudi F, et al. Estimating the benefit and cost of radiotherapy for lung cancer. Int J Technol Assessment Health Care. 2004;20:1-7.
1 Salkever DS. Economic class and differential access to care. Comparisons among health systems. Int J Health Serv. 1975;5:373.
2 Penchansky R, Thomas JW. The concept of access. Definition and relationship to consumer satisfaction. Med Care. 1981;19:127-140.
3 . The 58th World Health Assembly Declaration. WHA 58.22: Cancer Prevention and Control. Available at www.who.int/cancer/media/news/WHA58%2022-en.pdf
4 Klausen OG, Olofsson J, Rosengren B. A long waiting time for radiotherapy. Not acceptable for patients with neoplasms. Tidsskr Nor Laegeforen. 1989;109:2324-2325.
5 Denham JW, Hamilton CS, Joseph DJ. How should a waiting list for treatment be managed? Australas Radiol. 1992;36:274-275.
6 Junor EJ, Macbeth FR, Barrett A. An audit of travel and waiting times for outpatient radiotherapy. Clin Oncol. 1992;4:174-276.
7 Mackillop WJ, Fu H, Quirt CF, et al. Waiting for radiotherapy in Ontario. Int J Radiat Oncol Biol Phys. 1994;30:221-228.
8 Radiotherapy Services, Ministry of Health. New Zealand: N Z Health Hospital, 1996. 48:23-24
9 Jensen AR, Nellemann HM, Overgaard J. Tumor progression in waiting time for radiotherapy in head and neck cancer. Radiother Oncol. 2007;84:5-10.
10 Schafer C, Nelson K, Herbst M. Waiting for radiotherapy. A national call for ethical discourse on waiting lists in radiotherapy. Findings from a preliminary survey. Strahlenther Onkol. 2005;181:9-19.
11 Esco R, Palacios A, Pardo J, et al. Infrastructure of radiotherapy in Spain. A minimal standard of radiotherapy resources. Int J Radiat Oncol Biol Phys. 2003;56:319-327.
12 Gabriele P, Malinverni G, Bona C, et al. Are quality indicators for radiotherapy useful in the evaluation of service efficacy in a new based radiotherapy institution? Tumori. 2006;92:496-502.
13 Mackillop WJ, Zhou Y, Quirt CF. A comparison of delays in the treatment of cancer with radiation in Canada and the United States. Int J Radiat Oncol Biol Phys. 1995;32:531-539.
14 Mackillop WJ, Groome PA, Zhou Y, et al. Does a centralized radiotherapy system provide adequate access to care? J Clin Oncol. 1997;15:1261-1271.
15 Mackillop WJ, Zhou S, Groome PA, et al. Changes in the use of radiotherapy in Ontario: 1984-1995. Int J Radiat Oncol Biol Phys. 1999;44:355-362.
16 Zhang-Salomons J, Huang J, Mackillop WJ. Health system effects on the use of post-lumpectomy radiotherapy. Int J Radiat Oncol Biol Phys. 2001;50:1385.
17 Mechanic D. Dilemmas in rationing health care services. The case for implicit rationing. BMJ. 1995;310:1655-1659.
18 Thomas SJ, Williams MV, Burnet NG, et al. How much surplus capacity is required to maintain low waiting times? Clin Oncol. 2001;13:24-28.
19 Mackillop WJ, Bates JHT, O’Sullivan B, et al. The effect of delay in treatment on local control by radiotherapy. Int J Radiat Oncol Biol Phys. 1996;34:243-250.
20 Waaijer A, Terhaard CH, Dehnad H, et al. Waiting times for radiotherapy. Consequences of volume increase for the TCP in oropharyngeal carcinoma. Radiother Oncol. 2003;66:271-276.
21 Jensen AR, Nellemann HM, Overgaard J. Tumor progression in waiting time for radiotherapy in head and neck cancer. Radiother Oncol. 2007;84:5-10.
22 Mackillop WJ. Killing time. The consequences of delays in radiotherapy. Radiother Oncol. 2007;84:1-4.
23 Sackett D, Haynes BR, Guyatt GH, et al. Deciding whether your treatment has done harm. In: Clinical Epidemiology: A Basic Science for Clinical Medicine. Boston: Little Brown; 1991.
24 Chen Z, King W, Pearcey R, et al. The relationship between waiting time for radiotherapy and clinical outcomes. A systematic review of the literature. Radiother Oncol. 2008;87:3-16.
25 Punglia RS, Saito A, Neville BA, et al. Impact of interval from breast conserving surgery to radiotherapy on local recurrence in older women with breast cancer. Retrospective cohort analysis. BMJ. 2010;340:cd845.
26 Franklin CI, Poulsen M. How do waiting times affect radiation dose fractionation schedules? Austral Radiol. 2000;44:428-432.
27 Kong W, Zhang-Salomons J, Hanna T, Mackillop WJ. A population-based study of the fractionation of palliative radiotherapy for bone metastasis in Ontario. Int J Radiat Oncol Biol Phys. 2007;69:1209-1217.
28 Dixon PF, Mackillop WJ. Could changes in clinical practice reduce waiting lists for radiotherapy? J Health Serv Res Policy. 2001;6:70-77.
29 . The “Cilinger” Case. Available at www.mmflegal.com/en/media/recoursCollectif/settlement_agreement.pdf
30 Cuyler AJ. Need and the National Health Service: Economics and Social Choice. Lanham, MD: Rowman and Littlefield; 1976.
31 de Jong B, Crommelian M, Heijden LH, et al. Patterns of radiotherapy for cancer patients in the south eastern Netherlands, 1975-1989. Radiother Oncol. 1994;31:213-221.
32 Huang J, Zhou S, Groome P, et al. Factors affecting the use of palliative radiotherapy in Ontario. J Clin Oncol. 2001;19:137-144.
33 Denham JW. How do we bring an acceptable level of radiotherapy services to a dispersed population? Austral Radiol. 1995;39:171-173.
34 Tyldesley S, Zhang-Salomons J, Groome P, et al. Association between age and the utilization of radiotherapy in Ontario. Int J Radiat Oncol Biol Phys. 2000;47:469-480.
35 Intersociety Council for Radiation Oncology. Radiation Oncology in Integrated Cancer Management. Report to the Director of National Cancer Institute. Washington, DC: National Cancer Institute; 1991.
36 Tyldesley S, Boyd C, Schulze K, et al. Estimating the need for radiotherapy for lung cancer. An evidence-based, epidemiological approach. Int J Radiat Oncol Biol Phys. 2001;49:973-985.
37 Usmani N, Foroudi F, Du J, et al. An evidence-based estimate of the appropriate rate of utilization of radiotherapy for cancer of the cervix. Int J Radiat Oncol Biol Phys. 2005;63:812-827.
38 Delaney G, Jacob S, Featherstone C, Barton M. The role of radiotherapy in cancer treatment. Estimating optimal utilization from a review of evidence-based clinical guidelines. Cancer. 2005;104:1129-1137.
39 Bogan CE, English MJ. Benchmarking for Best Practices. Winning through Innovative Adaptation. New York: McGraw-Hill; 1994.
40 Barbera L, Zhang-Salomons J, Huang J, et al. Defining the need for radiotherapy for lung cancer in the general population: A criterion-based, benchmarking approach. Med Care. 2003;41:1074-1085.
41 Donabedian A. Evaluating the quality of medical care. Milbank Memorial Fund Q. 1966;44:166-206.
42 Kramer S, Herring D. The patterns of care study. A nation-wide evaluation of the practice of radiation therapy in cancer management. Int J Radiat Oncol Biol Phys. 1976;1:1231-1236.
43 Owen JB, Coia LR, Hanks GE. The structure of radiation oncology in the United States in 1994. Int J Radiat Oncol Biol Phys. 1997;39:179-185.
44 Moller TR, Einhorn N, Lindholm C, et al. Radiotherapy and cancer care in Sweden. for the SBU Survey Group]. Acta Oncol. 2003;42:366-375.
45 Esco R, Palacios A, Pardo J, et al. Infrastructure of radiotherapy in Spain. A minimal standard of radiotherapy resources. Int J Radiat Oncol Biol Phys. 2003;56:319-327.
46 Slotman BJ, Leer JW. Infrastructure of radiotherapy in the Netherlands. Evaluation of prognoses and introduction of a new model for determining needs. Radiother Oncol. 2003;66:345-349.
47 Bentzen SM, Heeren G, Cottier B, et al. Evidence-based guidelines for radiotherapy infrastructure and staffing needs in Europe. The ESTRO QUARTS project. Radiother Oncol. 2005;75:355-365.
48 Lievens Y, Van den Bogaert W, Rijnders A, et al. Palliative radiotherapy practice within western European countries. Impact of the radiotherapy financing system. Radiother Oncol. 2000;56:289-295.
49 Glatstein E. The return of the snake oil salesmen. Int J Radiat Oncol Biol Phys. 2003;55:561-562.
50 Mackillop WJ, O’Brien P, Brundage M, et al. Radiotherapy quality and access issues. In: Sullivan T, Evans W, Angus H, Hudson A, editors. Strengthening the Quality of Cancer Services in Ontario. Ottawa, Ontario: CHA Press; 2003:95-124.
51 Horiot JC, Johansson KA, Gonzalez DG, et al. Quality assurance control in the EORTC Cooperative Group of Radiotherapy. 1. Assessment of radiotherapy staff and equipment. European Organization for Research and Treatment of Cancer. Radiother Oncol. 1986;6:275-284.
52 Horiot JC, van der Schueren E, Johansson KA, et al. The program of quality assurance of the EORTC radiotherapy group. A historical overview. Radiother Oncol. 1993;29:81-84.
53 Brundage MD, Dixon PF, Mackillop WJ, et al. A real-time audit of radiation therapy in a regional cancer center. Radiat Oncol Biol Phys. 1999;43:115-124.
54 Rischin D, Peters L, O’Sullivan B, et al. Tirapazamine, cisplatin, and radiation versus cisplatin and radiation for advanced squamous cell carcinoma of the head and neck (TROG 02.02, HeadSTART). A phase III trial of the Trans-Tasman Radiation Oncology Group. J Clin Oncol. 2010;28:2989-2995.
55 Weingart SN, Wilson Ross McL, Gibbard RW, Harrison B. Epidemiology of medical error. BMJ. 2000;320:774-777.
56 Barach P, Small SD. Reporting and preventing medical mishaps. Lessons from non-medical near miss reporting systems. BMJ. 2000;320:759-763.
57 Williams MV. Improving patient safety in radiotherapy by learning from near misses, incidents and errors. Br J Radiol. 2007;80:297-301.
58 Holmberg O, McClean B. Preventing treatment errors in radiotherapy by identifying and evaluating near misses and actual incidents. J Radiother Pract. 2002;3:13-25.
59 Derreumaux S, Etard C, Huet C, et al. Lessons from recent accidents in radiation therapy in France. Radiat Protect Dosimetry. 2008;131:130-135.
60 Shafiq J, Barton M, Noble D, et al. An international review of patient safety measures in radiotherapy practice. Radiother Oncol. 2009;92:15-21.
61 Owen JB, Sedransk J, Pajak TF. National averages for process and outcome in radiation oncology. Methodology of the PCS. Semin Radiat Oncol. 1997;7:101-107.
62 MacLean CJ, Davis LW, Herring DF, et al. Variation in work-up and treatment procedures among types of radiation therapy facilities. The patterns of care process survey for three head and neck sites. Cancer. 1981;48:1346-1352.
63 Raby B, Pater J, Mackillop WJ. Does knowledge guide practice? Another look at the management of non-small cell-lung cancer. J Clin Oncol. 1995;13:1904-1911.
64 White V, Pruden M, Giles G, et al. The management of early breast carcinoma before and after the introduction of clinical practice guidelines. Cancer. 2004;101:476-485.
65 Morrow M, White J, Moughan J, et al. Factors predicting the use of breast-conserving therapy in stage I and II breast carcinoma. J Clin Oncol. 2001;19:2254-2262.
66 Maggino T, Romagnolo C, Zola P, et al. An analysis of approaches to the treatment of endometrial cancer in western Europe. A CTF study. Eur J Cancer. 1995;31:1993-1997.
67 Dobbs HJ, Henderson S, et al. Variations in referral patterns for postoperative radiotherapy of patients with screen-detected breast cancer in the south Thames (east region). Clin Oncol. 1998;10:24-29.
68 Fowler FJJr, McNaughton CM, Albertsen PC, et al. Comparison of recommendations by urologists and radiation oncologists for treatment of clinically localized prostate cancer. JAMA. 2000;283:3217-3222.
69 O’Sullivan B, Mackillop WJ, Gilbert R, et al. Controversies in the management of laryngeal cancer. Results of an international survey of patterns of care. Radiother Oncol. 1994;31:23-32.
70 Richardson LC, Schulman J, Sever LE, et al. Early-stage breast cancer treatment among medically underserved women diagnosed in a national screening program, 1992-1995. Breast Cancer Res Treat. 2001;69:133-142.
71 Lievens Y, van den Bogaert W, Kesteloo K. The palliative treatment of bone metastases. An update on practice patterns and incentives in Belgium. Radiother Oncol. 2004;73(Suppl):324.
72 Borgelt BB, Stone C. Ambulatory patient classifications and the regressive nature of Medicare reform. Is the reduction in outpatient health care reimbursement worth the price? Int J Radiat Oncol Biol Phys. 1999;45:729-734.
73 Schulz U, Schroder M. Quality and the profit situation in ambulatory radiotherapy. Strahlenther Onkol. 1996;172:121-127.
74 Potosky AL, Warren H, Riedel ER, et al. Measuring complications of cancer treatment using the SEER-Medicare data. Med Care. 2002;40(Suppl 8):62-68.
75 Boyd CJ, Zhang-Salomons J, Groome PA, et al. Associations between community income and cancer survival in Ontario and the United States. J Clin Oncol. 1999;17:2244-2255.
76 Evans BT, Pritchard C. Cancer survival rates and GDP expenditure on health. A comparison of England and Wales and the USA, Denmark, Netherlands, Finland, France, Germany, Italy, Spain, and Switzerland in the 1990’s. Public Health. 2000;114:336-339.
77 Feinstein AR. Clinical Epidemiology: The Architecture of Clinical Research. Philadelphia: WB Saunders; 1985.
78 Sackett DI, Haynes RB, Guyatt GH, et al. Clinical Epidemiology: A Basic Science for Clinical Medicine, 2nd ed. Boston: Little, Brown; 1991.
79 Mackillop WJ, Dixon PD. Oesophageal carcinoma. The problems of historical controls. Radiother Oncol. 1986;6:327-328.
80 Newhouse JP, McClellan M. Econometrics in outcomes research. The use of instrumental variables. Ann Rev Public Health. 1998;19:17-34.
81 Groome PA, Mackillop WJ. Uses of ecologic studies in the assessment of intended treatment effects. J Clin Epidemiol. 1999;52:903-904.
82 Groome PA, O’Sullivan B, Irish JC, et al. Glottic cancer in Ontario, Canada, and the SEER areas of the United States. Do different management philosophies produce different outcome profiles? J Clin Epidemiol. 2001;54:301-315.
83 Booth CM, Mackillop WJ. Translating new medical therapies into societal benefit. The role of population-based outcome studies. JAMA. 2008;300:2177-2179.
84 Pearcey R, Miao Q, Kong W, et al. Impact of adoption of chemoradiotherapy on the outcome of cervical cancer in Ontario. Results of a population-based cohort study. J Clin Oncol. 2007;25:2383-2388.
85 Hayman JA, Lash KA, Tao ML, et al. A comparison of two methods for estimating the technical costs of external beam radiation therapy. Int J Radiat Oncol Biol Phys. 2000;47:461-467.
86 Griffiths S, Delaney G, Jalaludin B. An assessment of basic treatment equivalent at Cookridge Hospital. Clin Oncol. 2002;14:399-405.
87 Dobson J. The impact of health care economics on the selection of new radiation therapy equipment. Prog Clin Biol Res. 1986;216:175-182.
88 Nisbet A, Ward A. Radiotherapy equipment—purchase or lease? Br J Radiol. 2001;74:735-744.
89 Rhine K, Fodor J3rd. Assessing equipment repair and asset management. Admin Radiol J. 1998;17:22-25.
90 Bastin K, Buchler D, Stitt J, et al. Resource utilization. High dose rate versus low dose rate brachytherapy for gynecologic cancer. Am J Clin Oncol. 1993;16:256-263.
91 Malin JL, Keeler E, Wang C, et al. Using cost-effectiveness analysis to define a breast cancer benefits package for the uninsured. Breast Cancer Res Treat. 2002;74:143-153.
92 Barbera L, Walker H, Foroudi F, et al. Estimating the benefit and cost of radiotherapy for lung cancer. Int J Technol Assessment Health Care. 2004;20:1-7.
93 Coy P, Schaafsma J, Schofield JA. The cost-effectiveness and cost-utility of high-dose palliative radiotherapy for advanced non–small cell lung cancer. Int J Radiat Oncol Biol Phys. 2000;48:1025-1033.
94 Polsky D, Mandelblatt JS, Weeks JC, et al. Economic evaluation of breast cancer treatment. Considering the value of patient choice. J Clin Oncol. 2003;2:1139-1146.