17 Head and Neck
Diagnostic Imaging Techniques
Computed Tomography
CT makes use of ionizing radiation to generate cross-sectional images based on differences in x-ray attenuation of various tissues. Modern scanners are typically helical, meaning that x-ray source rotation and patient translation occur simultaneously, resulting in the acquisition of a volume of data that is then partitioned and reconstructed into individual slices.1 Helical scanning allows for rapid data acquisition to diminish artifacts related to motion (breathing, swallowing, gross patient motion). The rapid data acquisition also allows for more and thinner slices to be obtained, which facilitates diagnosis by decreasing partial volume averaging effects. It also allows for improved quality of multiplanar reconstructions. The most recent advance in CT imaging has been the introduction of the multidetector or multislice scanners.2,3 Multidetector scanners have a variable number of parallel arcs of detectors that are capable of simultaneously acquiring volumes of data. The increased speed that results from multislice sampling can be traded for improved longitudinal resolution, increased volume of coverage, and improved signal-to-noise ratio.
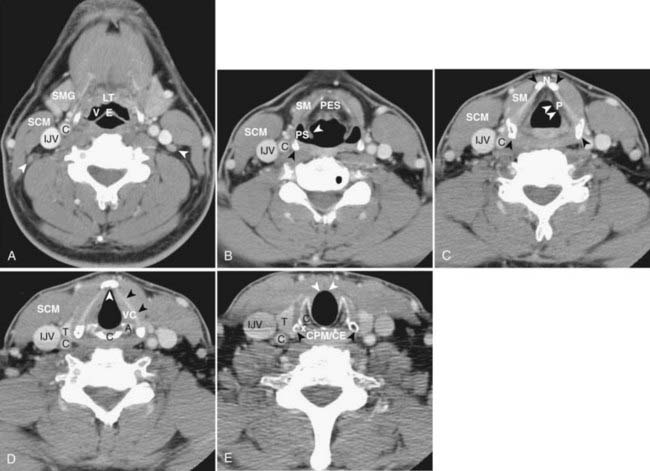
CT of the head and neck should be performed with thin sections, generally ≤3 mm, in the axial plane (Fig. 17-1A). Direct coronal imaging may be performed in some situations (such as paranasal sinus imaging), but multidetector methods allow for high-quality coronal and sagittal reformations (Fig. 17-1B to Fig. 17-1E); reformatted images improve depiction of anatomical relationships and can improve diagnostic accuracy. They also spare the patient from additional radiation. Additional angled views can also be useful in specific situations (e.g., to throw artifacts related to dental amalgam off of vital structures) (Fig. 17-1F to Fig. 17-1H). Unless one is primarily interested in bony structures, CT of the head and neck is usually performed following injection of iodinated contrast material. The opacification of vessels helps to separate them from other structures such as lymph nodes and also helps to delineate pathologic conditions. Iodinated contrast material carries a small risk of minor or significant allergic reaction and a risk of nephrotoxicity in patients who already have some degree of renal dysfunction or are at risk of this (e.g., diabetics). These factors should be considered when a contrast-enhanced CT scan is requested.
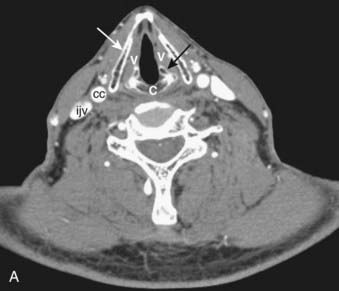
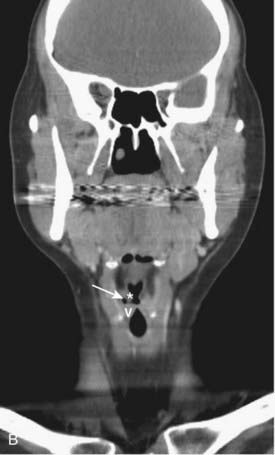
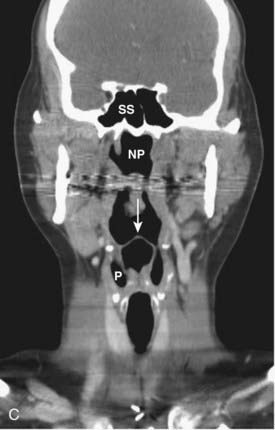
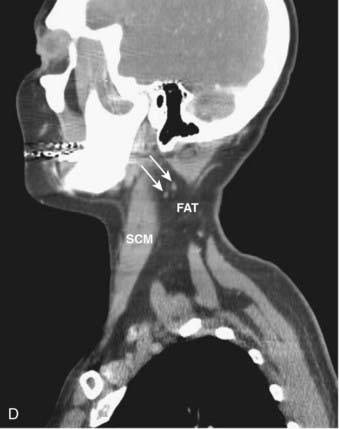
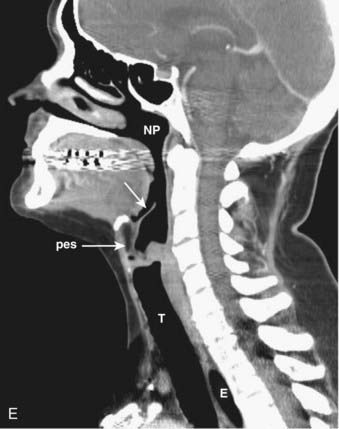
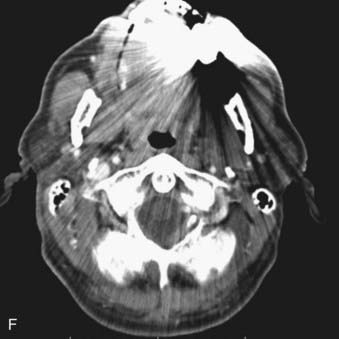
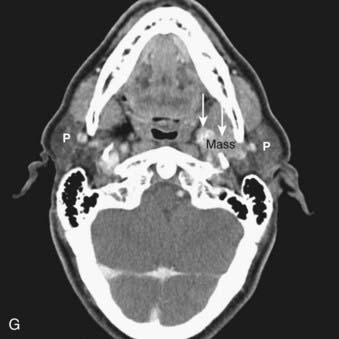
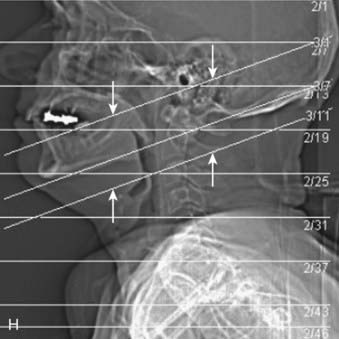
FIGURE 17-1 • A, Axial 2.5-mm-thick slice from a contrast-enhanced computed tomography (CT) scan of the neck. Note the excellent depiction of the normal larynx, with the true vocal cords (V), cricoid cartilage (C), arytenoid cartilage (black arrow), and thyroid cartilage (white arrow) indicated. Also shown are the common carotid artery (cc) and internal jugular vein (ijv). B, Coronal reformation of the axial CT data demonstrates the true vocal cord (V), false vocal cord (*), and laryngeal ventricle (arrow). C, A more posterior coronal reformation demonstrates the epiglottis (white arrow), pyriform sinus (P), sphenoid sinus (SS), and nasopharyngeal airway (NP). D, An off-midline sagittal reformation shows the sternocleidomastoid muscle (SCM) and subcutaneous fat (FAT) in the posterior cervical space as well as small, normal-appearing lymph nodes (arrows). E, A midline sagittal reformation shows the nasopharynx (NP), epiglottis (white arrow), fat-filled pre-epiglottic space (PES, white arrow), and cervical segment of the trachea (T) and air in the cervicothoracic segment of the esophagus (E). F, An axial contrast-enhanced CT scan at the C1-2 level from a patient with left otalgia shows extensive streak artifact from dental amalgam and no convincing abnormality. G, An axial contrast-enhanced CT scan from the same patient as FIGURE 17-1F in which the slices have been angled to avoid the oral cavity. A mass (white arrows) arising from the deep lobe of the left parotid (P) is now easily appreciated. The right parotid (P) is also indicated. H, Scout view from the patient in FIGURE 17-1F and FIGURE 17-1G shows the angled image stack (red arrows) as well as the standard axial acquisition.
Magnetic Resonance Imaging
MRI exploits differences in tissue relaxation characteristics and spin density to produce an image that is exquisitely sensitive to soft-tissue contrast.4,5 Depending on the parameters that one selects, variable tissue characteristics and contrast will be produced. Multiple types of sequences in multiple planes are generally necessary to fully characterize lesions of the head and neck. Slice thickness should be no more than 5 mm, and a gadolinium-based contrast agent is generally used to enhance detection of pathologic conditions and improve tissue characterization and differential diagnosis. In some circumstances, thinner sections covering a smaller anatomic area may be necessary for more precise depiction and diagnosis.
In the head and neck, we typically obtain the following imaging sequences:


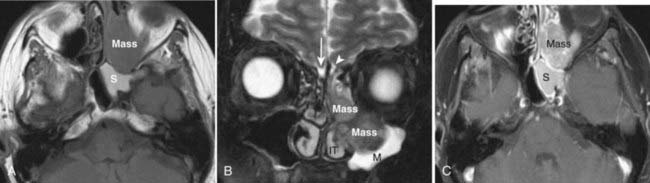
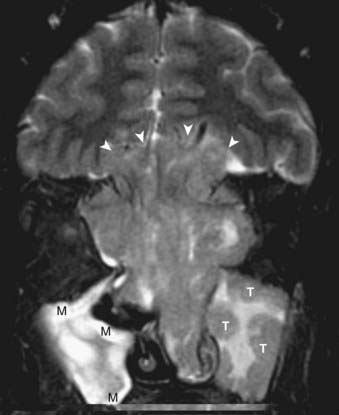
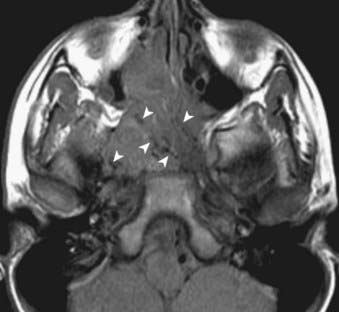
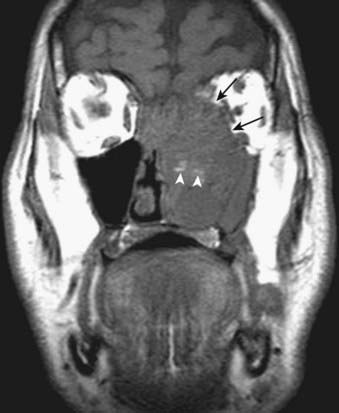
On a T1-weighted image, fat is bright and fluid (such as cerebrospinal fluid) is relatively dark. Muscle and most pathologic conditions are of intermediate signal intensity. The large amount of fat in the head and neck provides intrinsic tissue contrast, which makes the T1-weighted image very sensitive to infiltrative processes that obliterate tissue planes or replace marrow fat (Fig. 17-2A). Some hemorrhagic or proteinaceous lesions may result in intrinsic T1-shortening such that they appear bright on a T1-weighted image. On a T2-weighted image, fluid is very bright and most pathologic conditions are relatively bright, whereas muscle is quite dark. The FSE technique is useful in limiting artifacts related to motion and magnetic susceptibility as compared with a conventional spin-echo T2-weighted image. Because fat remains bright on a FSE image, however, fat saturation should ideally be applied. In the nasal cavity and paranasal sinuses, T2-weighted images are particularly useful in distinguishing neoplastic masses from polyps, thickened mucosa, and retained secretions (Fig. 17-2B). Gadolinium is useful for demonstrating pathologic conditions and tailoring a differential diagnosis based on enhancement characteristics. Postgadolinium imaging is also useful in assessing perineural spread of tumor, cavernous sinus invasion, and meningeal or brain infiltration (Fig. 17-2C and Fig. 17-2D). Fat saturation should ideally be applied on a postgadolinium image; otherwise, the contrast between an enhancing lesion and surrounding fat may actually be reduced as compared with the pregadolinium image. As low-field scanners often do not have fat saturation available, high-field (≥1.5 T) imaging is generally preferred for patients with head and neck cancer. If a patient is severely claustrophobic, then sedation may be necessary to accomplish the scan.
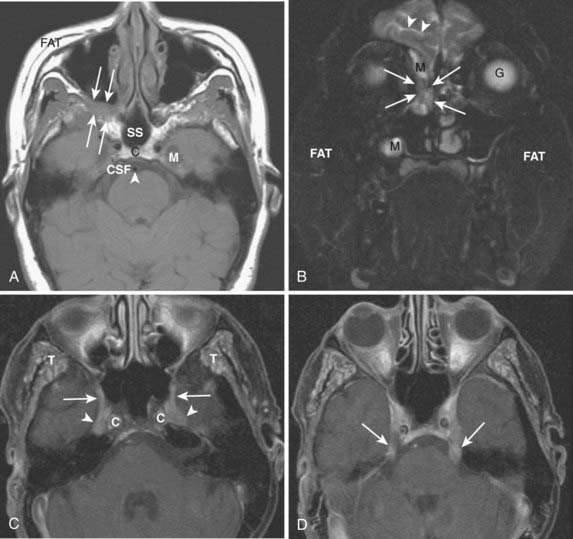
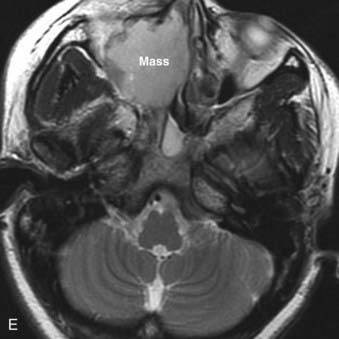
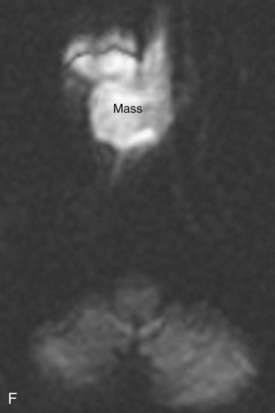
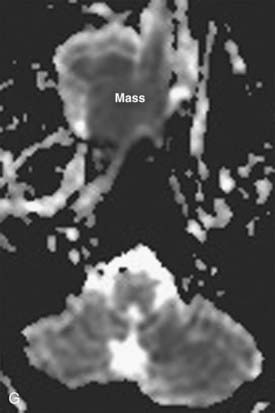
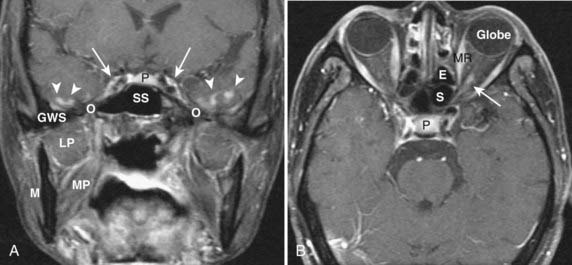
FIGURE 17-2 • A, An axial T1-weighted image is shown. Note that fat (as seen in the subcutaneous region, subcutaneous fat [FAT], and also in the marrow of the clivus [C]) is extremely bright, whereas fluid (as seen in cerebrospinal fluid (CSF) in the prepontine cistern and Meckel cave (M) is dark. Soft tissue such as muscle and brain parenchyma are intermediate in signal intensity, whereas air (as in the sphenoid sinus [SS]) is black. The white arrowhead indicates the flow void of the basilar artery. White arrows indicate nasopharyngeal carcinoma infiltrating the fat of the right pterygopalatine fossa, which appears expanded and of lower signal intensity than the normal, mostly fatty pterygopalatine fossa on the left. B, A coronal fast spin-echo (FSE) T2-weighted image with fat saturation is shown. Note that the signal from subcutaneous fat (FAT) is completely suppressed. Fluid appears bright, as seen with CSF in a cerebral sulcus (arrowheads) and the vitreous humor within the ocular globe (G). Mucoid material (M) within the maxillary, frontal, and ethmoid sinuses is extremely bright. In contrast, a highly cellular inverting papilloma (white arrows) is of intermediate signal intensity and shows clearly in contrast to thickened mucosa and sinonasal secretions. C, A postgadolinium axial T1-weighted image with fat saturation is shown. Subcutaneous fat appears dark because its signal has been suppressed. Gadolinium administration can be confirmed by looking at the sinonasal mucosa, which enhances brightly postgadolinium. Orbital fat appears bright because of local failure of fat saturation resulting from inhomogeneity of the local magnetic field caused by the proximity to the air-filled maxillary sinuses. Abnormal enhancement is seen along foramen rotundum (white arrows) and in the Meckel caves (white arrowheads) because of lymphomatous infiltration of the trigeminal nerves. Increased enhancement of the temporalis muscles bilaterally (T) is related to denervation change from involvement of V3. D, A slightly more superior postgadolinium axial T1-weighted image with fat saturation demonstrates abnormal thickening and enhancement of the cisternal segments of the trigeminal nerves bilaterally, also caused by lymphomatous infiltration. E, An axial fast spin-echo T2-weighted image demonstrates a large mass involving the right maxillary sinus, right nasal cavity, and right ethmoid air cells. Fat suppression was not used in this case. F, An axial diffusion-weighted image (same patient as in Fig. 17-2E) shows marked hyperintensity of the lesion. This image contains both T2-weighted and diffusion-weighted information. G, The apparent diffusion coefficient map at the same level as Fig. 17-2F represents the diffusion-weighted image with the T2 contribution removed and it therefore represents “true” diffusion information, with reduced diffusion demonstrated as low signal intensity in the mass. This is consistent with high cellularity, as is often seen in small, round, blue-cell tumors. In this case, biopsy confirmed sinonasal rhabdomyosarcoma.
Additional planes may be useful in some circumstances (e.g., coronal FSE T2-weighted images with fat saturation for paranasal sinus pathologic conditions). Additional sequences such as magnetic resonance angiography may also be useful in certain circumstances (e.g., paragangliomas), but are not necessary for evaluation of most neoplasms of the head and neck. Modalities in widespread use in the brain (magnetic resonance spectroscopy, diffusion-weighted imaging, functional MRI) have not yet found a place in routine head and neck imaging. There is growing interest in diffusion-weighted imaging in the head and neck, however, because the relative reduction in water diffusion that is seen in highly cellular neoplasms can be useful in the differential diagnosis and staging of primary tumors and the detection of residual or recurrent disease following primary therapy (Fig. 17-2E to Fig. 17-2G).6
As mentioned earlier, in many cases MRI is preferred to CT because of its superior soft-tissue contrast and increased sensitivity to processes such as perineural spread of tumor. It is important for the clinician to be aware of MRI safety considerations, however, and relative and absolute contraindications to MRI.7,8 It is also important to be aware of the entity of nephrogenic systemic fibrosis (NSF), a scleroderma-like condition that primarily involves the skin but may also affect organs such as the liver, lung, heart, and muscle. Current thinking suggests an association and a potential causal link between the use of gadolinium-based contrast agents and the development of NSF among patients with advanced kidney disease; hence it is important to screen for kidney disease prior to administration of gadolinium-based contrast agents for MR scanning.9
Positron Emission Tomography
PET offers information regarding tissue metabolism rather than simply demonstrating anatomy. The most common radiopharmaceutical in use for cancer imaging at present is 18F-fluorodeoxyglucose (FDG). This is taken up into tissues in proportion to the glycolytic rate, which is generally increased in neoplastic processes. FDG does accumulate in some normal structures to a variable degree (sublingual glands, lymphoid tissue of Waldeyer ring) (Fig. 17-3),10 and may also accumulate in active muscles (e.g., the larynx if a patient has been talking) and brown fat (which is often present in the supraclavicular fossae). The current widespread availability of PET-CT scanning allows far more precise localization of FDG activity and more precise interpretation than was previously possible with FDG PET scanning alone, and allows pitfalls (such as interpreting vascular, muscular, or brown fat activity as neoplasia) to be avoided.11,12 Situations in which FDG PET-CT scanning is particularly helpful include the search for an unknown primary lesion in a patient presenting with metastatic neck disease (Fig. 17-4A), the assessment of residual or recurrent disease following primary therapy, and the search for synchronous or metachronous primary lesions or distant metastases (Fig. 17-4B and Fig. 17-4C).13,14 FDG PET-CT scanning is also useful for staging the neck. There may be a significant number of false-negative studies in patients with clinically N0 necks, however, as small tumor deposits (on the order of 1 to 4 mm) may not be detectable on FDG PET-CT scan, but will be found if a neck dissection is performed. It must also be remembered that FDG is a nonspecific tracer that is concentrated in areas of inflammation as well as neoplasia. An FDG PET-CT scan must therefore always be interpreted in appropriate clinical context and must be supplemented with tissue sampling and follow-up imaging as appropriate.
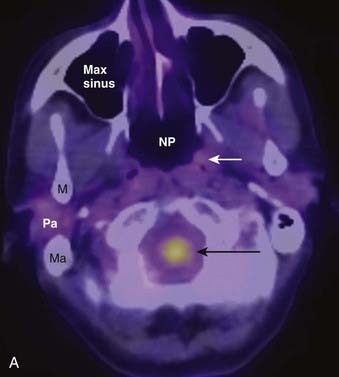
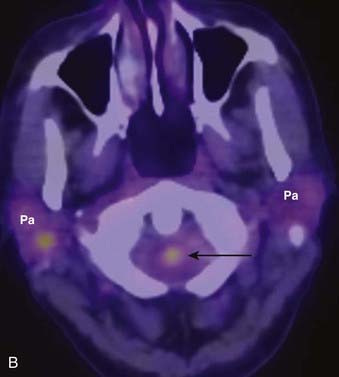
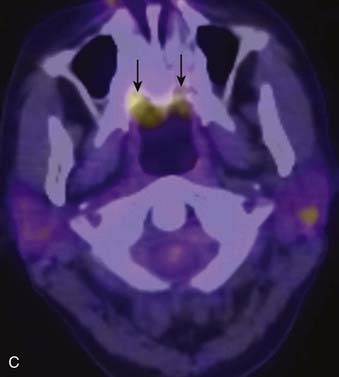
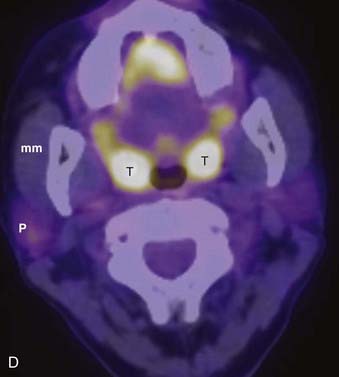
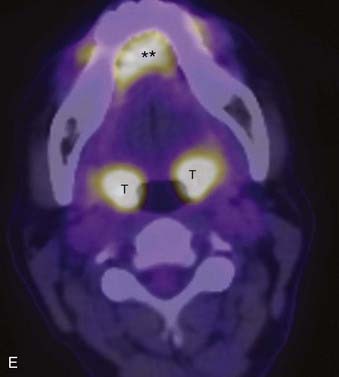
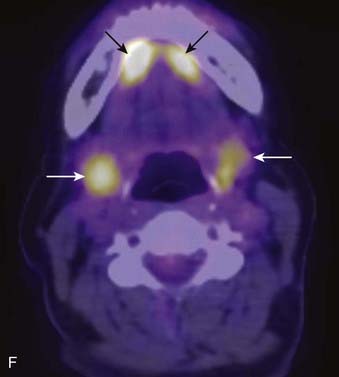
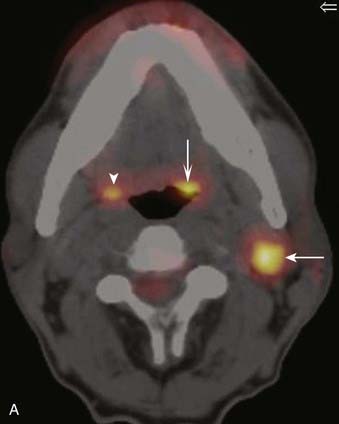
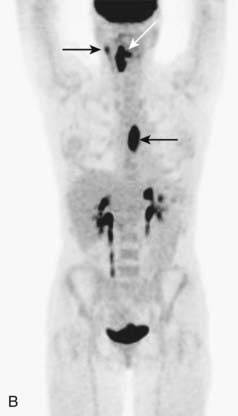
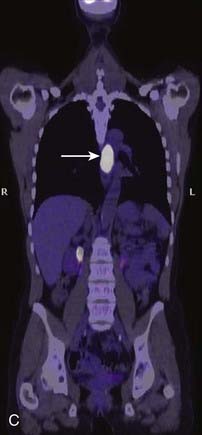
FIGURE 17-4 • A, Axial fused image from an 18F-fluorodeoxyglucose (FDG) positron emission tomography–computed tomography (PET-CT) scan in a patient who presented with a left neck mass concerning for metastatic cervical lymphadenopathy, and fine-needle aspiration positive for squamous cell carcinoma (SCC). Initial head and neck evaluation was unremarkable other than the left level-II node. The fused PET-CT image in the axial plane demonstrates expected activity in the left level-II node (slightly concave arrow), as well as subtly asymmetrical activity in the left base of tongue (deeply concave arrow). Mild normal activity is shown in the right base of tongue (concave arrowhead) for comparison. Endoscopy revealed a very subtle lesion in the left base of tongue, and a biopsy was positive for SCC. B, A whole-body projection image from an 18F-FDG PET-CT study performed to stage an oropharyngeal SCC in a different patient. The large primary tumor is seen (white arrow), as is a right level-II lymph node (upper black arrow). A large focus of activitiy in the mediastinum (lower black arrow) was unexpected. C, A coronal fused PET-CT image (same patient as in FIGURE 17-4B) localizes activity to the thoracic esophagus. This lesion proved to be an unexpected and asymptomatic SCC of the esophagus.
Imaging the Head and Neck
The anatomy of the head and neck is extremely complex. To facilitate communication and differential diagnosis, the supra- and infrahyoid neck are usually discussed as a series of spaces.15–17 We discuss primarily the pharyngeal mucosal space, from which squamous cell carcinomas (SCCs), lymphomas, and minor salivary gland tumors may arise. In this discussion, we refer to the traditional divisions of this space into the nasopharynx, oropharynx, oral cavity, and hypopharynx. The larynx, located in the infrahyoid visceral space, is also discussed. The deeper spaces of the head and neck may be involved by deep extension of primarily mucosal lesions or may be the site of origin of soft-tissue sarcomas and other nonsquamous neoplasms.
Spatial Anatomy of the Head and Neck
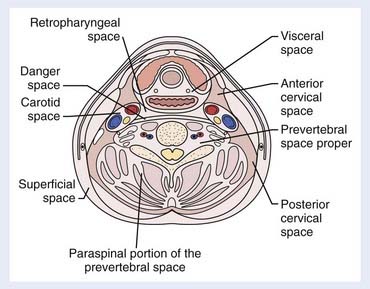
The spaces of the suprahyoid neck are defined by the three layers of the deep cervical fascia (the superficial, middle, and deep layers). The spaces so defined include the pharyngeal mucosal space, parapharyngeal space, masticator space, parotid space, carotid space, retropharyngeal space, and perivertebral space. These spaces are demonstrated in Fig. 17-5. In a discussion of head and neck cancer, however, which is dominated by SCC of the mucosa of the upper aerodigestive tract, we discuss lesions arising in the nasopharynx, oropharynx, oral cavity, hypopharynx, and larynx. The infrahyoid neck has traditionally been taught from the point of view of surgical triangles, but can also be described as a series of spaces, which facilitates understanding and interpretation of cross-sectional imaging modalities such as CT and MRI. The spaces of the infrahyoid neck are also defined by the three layers of the deep cervical fascia and include the superficial space (external to the superficial layer of the deep cervical fascia), visceral space (including the thyroid gland, larynx, and esophagus), carotid space, retropharyngeal space, and prevertebral space. These spaces are demonstrated in Fig. 17-6.
Nasopharynx
Normal Anatomy
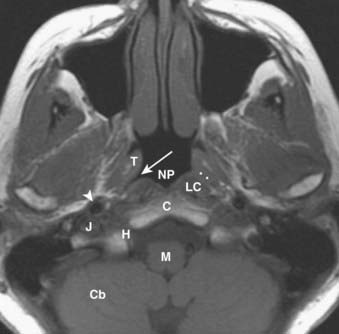
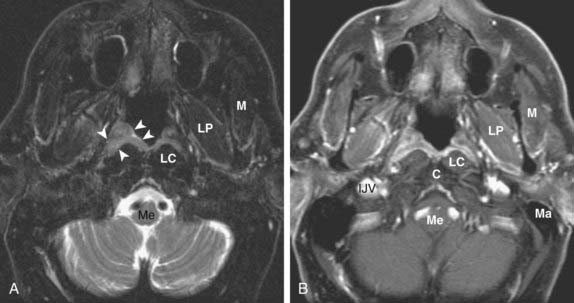
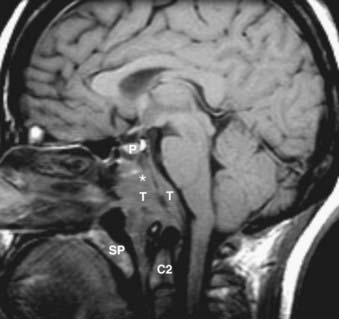
The nasopharynx is bounded anteriorly by the posterior nasal cavity at the level of the choana; superiorly by the sphenoid sinus; posterosuperiorly by the clivus, upper cervical spine, and prevertebral muscles; and inferiorly by the soft palate. Its contents include squamous mucosa, lymphoid tissue (adenoids), pharyngeal constrictor muscles, the levator palatini muscle, and the torus tubarius (the projecting posterior lip of the pharyngeal opening of the eustachian tube). Because of the location of the pharyngeal opening of the eustachian tube, nasopharyngeal masses often obstruct the eustachian tube, causing dysfunction and serous otitis. The Rosenmüller fossa represents the uppermost aspect of the lateral recess of the nasopharynx and is a common site of origin of nasopharyngeal cancers. The normal nasopharynx is shown in Fig. 17-7.
Pathologic Conditions
Nasopharyngeal carcinoma (NPC) is the most common malignant lesion of the nasopharynx. NPC may be small and confined to the Rosenmüller fossa or large with extension to the skull base, intracranial structures, and deep spaces of the head and neck.18 Lymphadenopathy is often a prominent feature of even early NPC. NPCs most commonly metastasize to retropharyngeal, level-II, and level-V nodes. Contralateral nodes are also at significant risk because of rich bilateral lymphatic drainage, and nodal imaging should extend from the high retropharyngeal level to the supraclavicular fossa. Note that the imaging appearance of normal and abnormal lymph nodes and the classification of lymph nodes based on anatomic “levels” is discussed later in the “Lymph Nodes” section of this chapter.
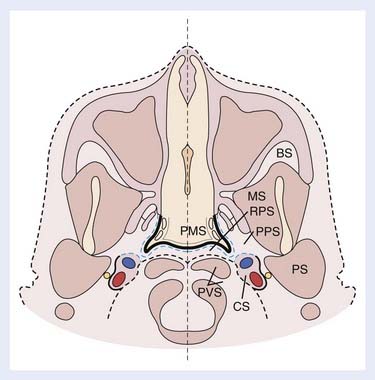
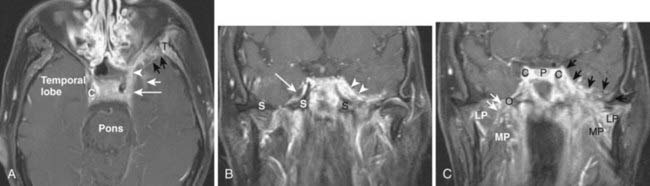
NPC generally presents as an asymmetric, infiltrative mass with a variably exophytic component that is intermediate in signal intensity on both T1– and T2-weighted images and shows homogeneous enhancement postgadolinium (Fig. 17-8). Small lesions are typically limited by the surrounding pharyngobasilar fascia; once this barrier is breached, the tumor may directly invade the adjacent fatty parapharyngeal space. NPC may also extend directly to the skull base: superiorly or superolaterally to the floor of the sphenoid sinus, pterygoid process, or foramen lacerum, or posteriorly to the clivus. Skull-base involvement is best detected on T1-weighted images, which show loss of the normal bright signal of marrow fat (Fig. 17-9). The sinus of Morgagni, which allows passage of the cartilaginous portion of the eustachian tube and the levator veli palatini muscle from the skull base to the pharynx, is a natural defect that may allow extension of NPC laterally into the parapharyngeal space and carotid space. NPC may then involve V3 and extend intracranially via the foramen ovale to the Meckel cave. Cavernous sinus extension and perineural spread of disease (usually along V3) are often best demonstrated on postgadolinium T1-weighted images with fat saturation (Fig. 17-10).
Oropharynx
Normal Anatomy
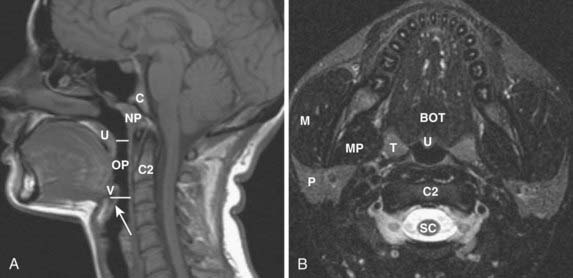
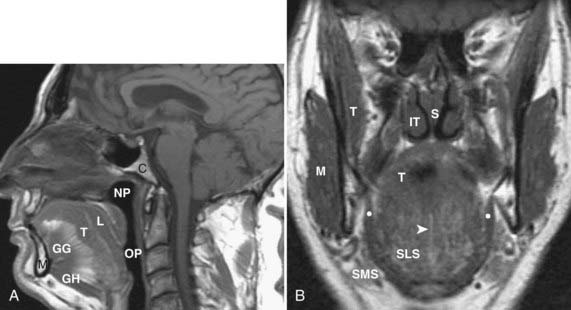
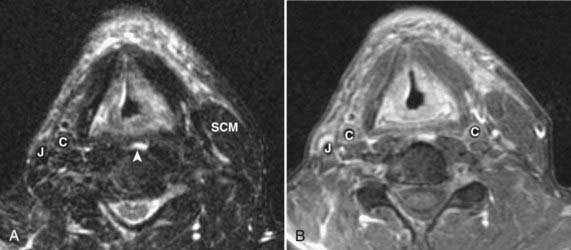
The oropharynx is bounded anteriorly by the circumvallate papillae of the tongue and the anterior tonsillar pillars; these structures separate the oropharynx from the oral cavity.19 Posteriorly it is bounded by the pharyngeal constrictor muscles and superiorly by the soft palate. Inferiorly it is separated from the larynx by the epiglottis and glossoepiglottic fold and from the hypopharynx by the pharyngoepiglottic fold. Its contents include the tongue base, palatine tonsils, soft palate, and oropharyngeal mucosa and constrictor muscles from the level of the palate to the hyoid bone. The normal oropharynx is shown in Fig. 17-11.
Pathologic Conditions
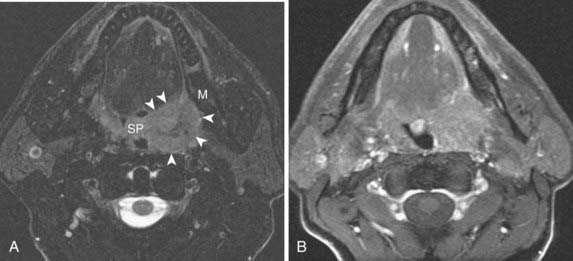
SCC accounts for most tumors of the oropharynx, followed by lymphoma, minor salivary gland lesions, and mesenchymal tumors.20 The appearance of SCC varies somewhat with the specific subsite involved, and the tumor may be variably exophytic or deeply infiltrative. Tumors of the tonsillar fossa may be occult when small and may present with cervical nodal disease. Tonsil cancers most commonly metastasize to level-II lymph nodes. Larger tumors of the tonsillar fossa may spread anteriorly or posteriorly to involve the tonsillar pillars or anteriorly to invade the tongue. They may extend deeply to invade the constrictor muscles and then gain access to the parapharyngeal space and skull base.
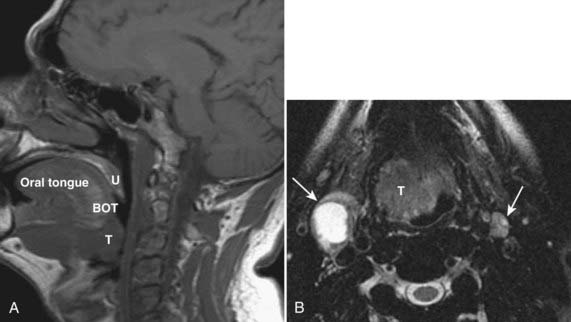
Tumors of the base of the tongue, when small, may be difficult to separate from normal lingual tonsillar tissue. Malignancy of the tongue base is usually asymmetrical, crossing midline only when large. Patterns of spread include posterolaterally to the tonsillar pillar and pharyngeal wall, submucosally into the supraglottic larynx, or anteriorly into the floor of the mouth. Nodal metastases are common with base-of-tongue tumors, with level-II nodes most commonly involved, followed by level-III nodes. Contralateral level-II nodes are also commonly involved. The imaging features of lymphomas and minor salivary tumors are similar to SCC, and clinical examination and tissue sampling are necessary to make a specific diagnosis in most cases. Representative tonsillar fossa and base of tongue lesions are shown in Fig. 17-12 and Fig. 17-13.
Oral Cavity
Normal Anatomy
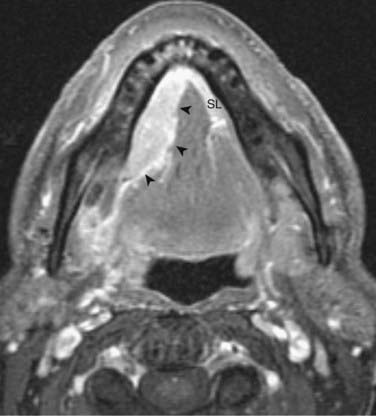
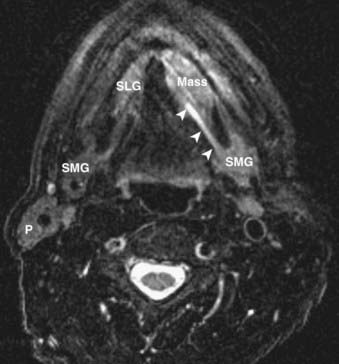
The oral cavity lies anterior to the oropharynx and is separated from it by the circumvallate papillae; soft palate; and anterior tonsillar pillars, which make up its posterior boundary.21 The oral cavity is bounded superiorly by the hard palate, laterally by the cheek, and inferiorly by the mylohyoid muscle. In addition to the mucosal area of the oral cavity (the dominant structure of which is the oral tongue), the mylohyoid muscle cleaves the lower oral cavity into the sublingual and submandibular spaces (Fig. 17-14). The sublingual space is frequently invaded by tumors of the floor of the mouth. The submandibular space is most commonly involved by inflammatory processes or metastases to level-I lymph nodes. Direct extension to the submandibular space by SCC of the oral cavity is uncommon.
 ), forming the
 Pathologic Conditions
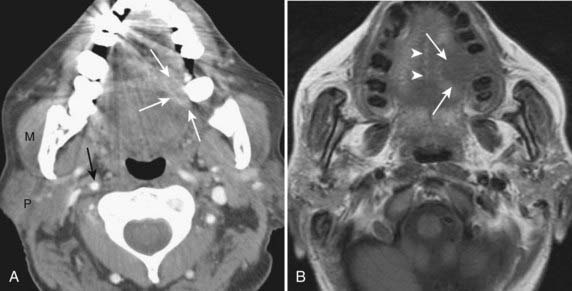
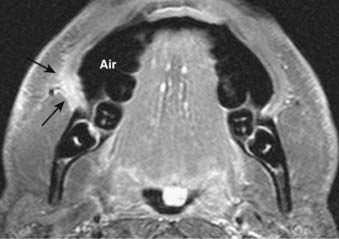
All surfaces of the oral cavity are covered by squamous mucosa, so there are many potential sites of origin of SCC. In addition, numerous minor salivary glands are distributed subepithelially throughout the oral cavity and can give rise to benign or malignant salivary tumors. SCC of the oral tongue, floor of the mouth, and gingivobuccal surfaces is well assessed by clinical examination. In cases of small or superficial lesions, imaging may be normal even though direct inspection clearly demonstrates a neoplasm. CT and MRI are most useful for assessing deep extension of malignant processes, involvement of critical structures such as the neurovascular bundle, and the presence of associated pathologic lymphadenopathy. They are also useful for presurgical and radiotherapy planning. Representative cases are illustrated in Fig. 17-15 and Fig. 17-16. Because mucosal surfaces are usually coapted during scanning, which limits sensitivity for small lesions and subtle deep invasion, it may be useful to have the patient perform a “puffed-cheek” maneuver22 to improve the assessment of oral cavity cancers, especially those of the buccal mucosa (Fig. 17-17). Cancers of the oral tongue most commonly metastasize to ipsilateral level-II lymph nodes, followed by level-I nodes, whereas cancers of the floor of the mouth most commonly metastasize to level-I nodes followed by level-II nodes.
Hypopharynx
Normal Anatomy
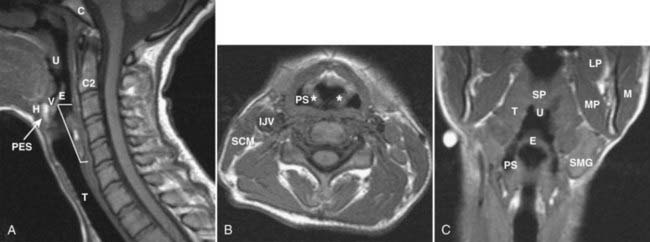
The hypopharynx extends from the level of the hyoid bone and valleculae to the cricopharyngeus (or inferior margin of the cricoid cartilage on imaging studies). Its three major anatomic subsites include the pyriform sinus, postcricoid area, and posterior pharyngeal wall. The pyriform sinus is shaped like an inverted pyramid, with its apex at the level of the cricoarytenoid joint. The postcricoid area extends from the level of the arytenoid cartilages to the inferior border of the cricoid cartilage and is the anterior wall of the lower pharynx. The posterior hypopharyngeal wall extends from the level of the vallecula to the level of the cricoarytenoid joints (Fig. 17-18).
Pathologic Conditions
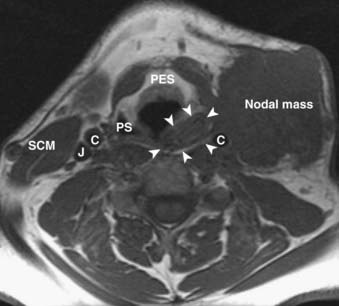
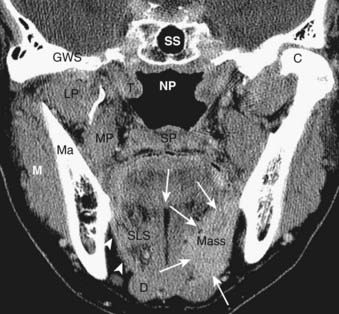
The contents of the hypopharynx include squamous mucosal surfaces, minor salivary glands, and inferior pharyngeal constrictor muscles. SCC is the most common hypopharyngeal pathologic condition.23 The pyriform sinus is the hypopharyngeal subsite most commonly involved with SCC (Fig. 17-19). SCC arising in this location tends to invade the soft tissues of the neck early and is frequently accompanied by pathologic lymphadenopathy. Ipsilateral metastatic nodes are common in both levels II and III. The extensive submucosal growth of hypopharyngeal tumors and invasion of adjacent organs are often not apparent on clinical examination, but are readily detected on cross-sectional imaging (Fig. 17-20). The sagittal plane is particularly useful in assessing the superoinferior extent of lesions of the posterior pharyngeal wall (Fig. 17-21), but the exact boundary of inferior extension into the cervical esophagus is often difficult to define by imaging and must be assessed endoscopically.
Larynx
Normal Anatomy
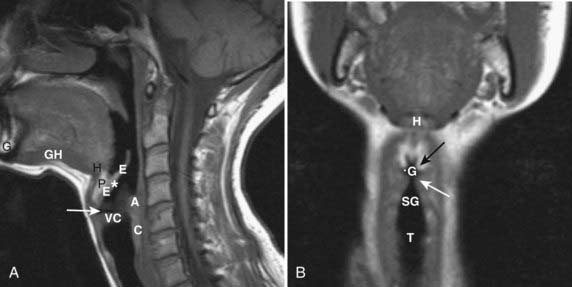
The larynx is an anatomically complex region that consists of a mucosal covering draped over a supporting cartilaginous skeleton made up of the cricoid, thyroid, and arytenoid cartilages.24 Structures that are part of the larynx include the epiglottis, aryepiglottic folds, and true and false vocal cords. Between the mucosal surfaces and the cartilaginous skeleton lie the predominantly fat-filled pre-epiglottic and paraglottic spaces. The endolarynx is usually divided into three segments (Fig. 17-22 and Fig. 17-23). The supraglottis extends from the tip of the epiglottis above to the laryngeal ventricles below and includes the epiglottis, aryepiglottic folds, pre-epiglottic space, false vocal cords, arytenoid cartilages, and the paraglottic (paralaryngeal) space. The glottis includes the true vocal cords and both the anterior and posterior commissures. On a normal axial CT scan or MRI, less than 1 mm of tissue should be discernible at the level of the commissures. The subglottic area extends from the undersurface of the true vocal cords above to the inferior aspect of the cricoid cartilage. As the mucosal surface of the subglottic area is closely applied to the cricoid cartilage, any tissue seen on the airway side of the subglottic larynx should be viewed with suspicion.
The site of origin of SCC within the larynx dictates the likelihood of accompanying metastatic nodal involvement. The supraglottic larynx has a rich network of draining lymphatics and therefore a propensity toward metastatic nodal disease, whereas cancers of the glottic and subglottic larynx are less likely to be associated with nodal metastases. Ipsilateral level-II and level-III metastatic nodes are present in 50% to 70% of supraglottic cancers, and contralateral level-II and level-III nodes are seen in 10% to 20% of cases.25,26 Glottic cancers have a lower incidence of ipsilateral nodal metastases and a far lower incidence of contralateral nodal metastases.
Pathologic Conditions
The vast majority of laryngeal neoplasms are SCCs. These tumors are usually well assessed by laryngoscopy, but imaging is useful for the assessment of submucosal and deep extension. The imaging of each laryngeal subsite raises certain unique issues. Supraglottic lesions (Fig. 17-24) are often large at the time of diagnosis because there is no accompanying hoarseness until the true vocal cord is involved; nodal metastases are common at presentation. Anterior supraglottic lesions (those involving the epiglottis) spread initially into the pre-epiglottic space, and later may access the tongue base above and the paraglottic space below. The pre-epiglottic space is optimally viewed on a sagittal T1-weighted image, which is very sensitive to infiltration of the normally bright pre-epiglottic fat by intermediate-signal-intensity tumor. Posterolateral supraglottic cancers (aryepiglottic fold, false vocal cord, laryngeal ventricle) may grow exophytically off the aryepiglottic folds or spread submucosally into the paraglottic space from the false cords and ventricle. Glottic SCCs often present early with voice change or hoarseness, and T1 lesions may not be visible on cross-sectional imaging studies. More advanced lesions are imaged to assess paraglottic and subglottic extension, as well as cartilage involvement (Fig. 17-25). Particular attention should be paid to the anterior and posterior commissures, which require thin-section technique. The subglottis is relatively easy to assess, as the area below the undersurface of the true cord has no normal tissue between the mucosal surface and the cricoid cartilage, so any soft-tissue thickening represents a pathologic condition (Fig. 17-26).
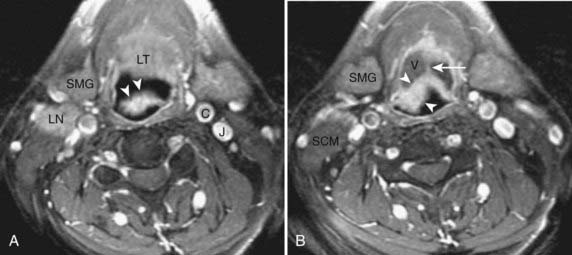
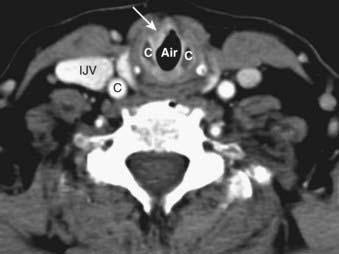
FIGURE 17-26 • Axial contrast-enhanced computed tomography scan in a patient with squamous cell carcinoma of the subglottis demonstrates abnormal focal thickening of the mucosal surface (white arrow) by the soft tissue mass. The cricoid cartilage (C) is adjacent to the tumor, but not clearly involved by it. Normally the air column should appear to directly contact the anterior surface of the cricoid, as in FIGURE 17-22E. The thyroid cartilage is also indicated (T).
The laryngeal cartilages normally calcify with age, and eventually ossify. Assessing involvement of the laryngeal cartilages by tumor is an important part of the radiologic evaluation of SCC of the larynx.27,28 CT can be used to assess asymmetric sclerosis and gross destruction, whereas MRI is better suited to assess replacement of normal tissue by an infiltrating tumor. Both modalities are limited by their inability to separate tumor involvement from reactive changes, and the only sure indicators of neoplastic involvement are gross cartilage destruction or the presence of a tumor on both sides of the cartilaginous structure. Multiple studies have demonstrated that the radiologic ability to conclusively demonstrate cartilage involvement by tumor (except with gross destruction or tumor on both sides of the cartilage) is limited. Ongoing advances in CT and MRI should help to improve the detection of more subtle cartilage involvement by tumor.
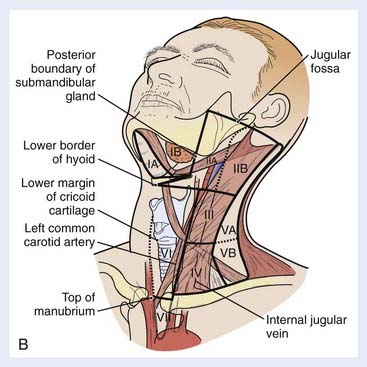
Lymph Nodes
Assessment of the cervical lymph nodes for metastatic involvement is an important part of the evaluation of the patient with head and neck cancer. Lymph nodes are seen on all cross-sectional studies of the head and neck. Lymph nodes have historically been described using anatomy-based terminology (e.g., jugulodigastric, spinal accessory), but have more recently been described using nodal “levels” that group nodes on the basis of clinical and pathophysiologic information (Fig. 17-27). These nodal levels have been translated to cross-sectional imaging,29,30 and this imaging-based classification is summarized in Table 17-1 and illustrated in Fig. 17-28. On imaging studies, normal nodes are usually less than 10 mm in short-axis diameter. They show intermediate density on CT, scans and on MRI show homogeneous intermediate signal intensity on T1-weighted images, mild hyperintensity on T2-weighted images, and homogeneous enhancement postgadolinium (Fig. 17-29). Metastatic deposits often lead to nodal heterogeneity. Areas of cystic degeneration, keratin pools, or frank necrosis result in nodal heterogeneity (typically seen as variable areas of high and/or low signal intensity on T2-weighted images or focal lack of enhancement on postgadolinium T1-weighted images) that is considered to represent neoplastic involvement in a patient who has head and neck cancer (Fig. 17-30A; also as shown in Fig. 17-13B). Abnormal nodes may also show extracapsular spread of the tumor, manifest as irregular margination and invasion of adjacent fat or other structures (Figs. 17-30B and 17-30C). Of particular interest is extension of nodal disease to involve the carotid artery. The imaging assessment of carotid invasion is difficult. In general, a carotid artery that is contacted by tumor over 270 degrees or more of its circumference is likely invaded, but actual adventitial involvement may need to be assessed intraoperatively.
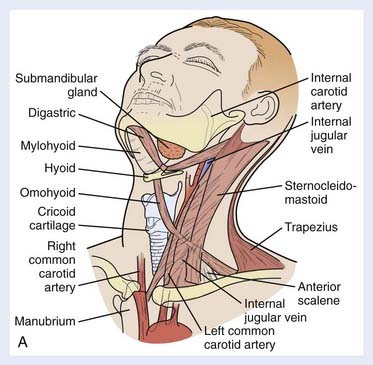
| Nodes | Boundaries | Subcategories |
|---|---|---|
| Level I | Above hyoid bone, below mylohyoid muscle, anterior to back of SMG |
ASM, Anterior scalene muscle; CA, carotid artery; IJV, internal jugular vein; SMG, submandibular gland; SCM, sternocleidomastoid muscle.
NB: The supraclavicular and retropharyngeal nodes are not part of this numbered classification scheme. The retropharyngeal lymph nodes are defined as being within 2 cm of the skull base and medial to the internal carotid arteries, whereas the supraclavicular nodes are defined as at or caudal to the level of the clavicle as seen on each axial scan, lateral to the carotid artery on each side of the neck, and above and medial to the ribs. Similarly, parotid, buccal, and facial nodes are not included in this classification scheme. These areas should be closely scrutinized for nodal disease depending on the site and size of the primary tumor.
Data from Som PM, Curtin HD, Mancuso AA: Imaging-based nodal classification for evaluation of neck metastatic adenopathy, AJR Am J Roentgenol 174:837, 2000.
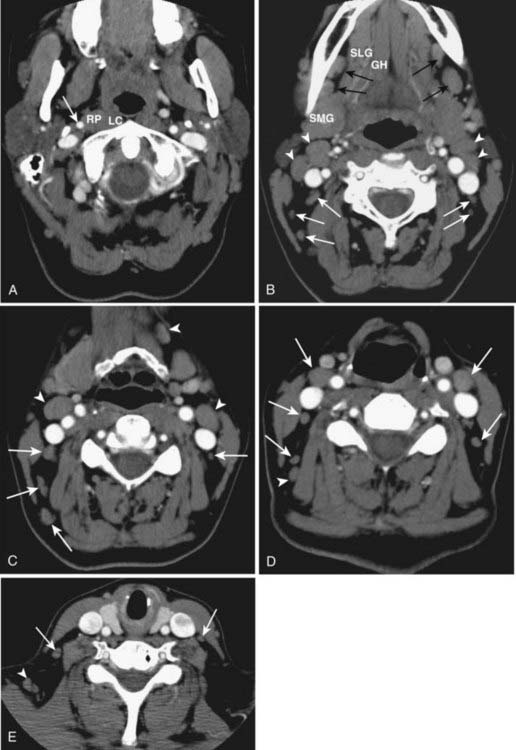
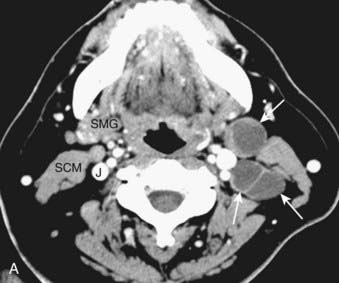
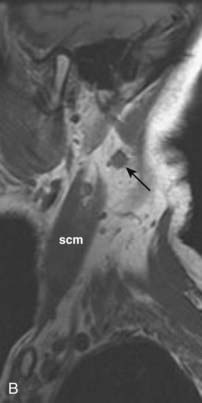
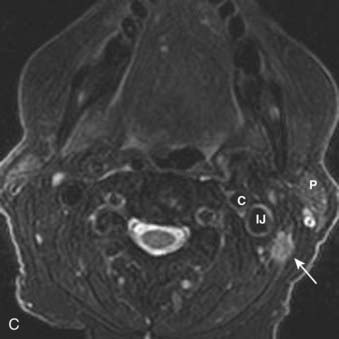
FIGURE 17-30 • A, Axial contrast-enhanced computed tomography scan of the suprahyoid neck in a patient with metastatic nodal disease (arrows) from a tonsil primary. The tumor-involved nodes show extensive necrosis or cystic degeneration or both, as evidenced by central nonenhancement and a thin peripheral rim of enhancing tissue. These nodes are all located in level IIA, as even the more posterior nodes are inseparable from the internal jugular vein. B, Sagittal T1-weighted image in a different patient shows an irregularly-marginated lymph node (black arrow) with small spicules of tumor extending into the adjacent high-signal-intensity fat, consistent with extracapsular spread of tumor. Sternocleidomastoid muscle is shown (scm). C, An axial fast spin-echo T2-weighted tumor with fat suppression from the same patient as FIGURE 17-30B again demonstrates the metastatic node (arrow) with spiulated extracapsular extension. Also shown are the parotid gland (P), internal carotid artery (C), and internal jugular vein (IJ).
A particular difficulty in the assessment of nodal involvement by head and neck cancer is the fact that a normal-sized, non-necrotic node is not necessarily normal because small foci of tumor may not be appreciable by standard CT and MRI methods. Ultrasound (US)-guided fine-needle aspiration can improve sensitivity and specificity,31 but has not found wide acceptance in the United States. FDG PET can offer an additional assessment of nodal involvement, but it is also relatively insensitive to small metastatic foci.32,33 Furthermore, even a grossly enlarged (but homogeneous) node may be reactive rather than tumor-involved. Choosing a “cut-off” size for calling a node normal or tumor-involved represents a tradeoff between sensitivity and specificity, and leads to probabilities rather than definite answers.34,35 It is certainly useful to assess the cervical lymph nodes using CT or MRI because clinically occult nodal disease will be detected in some cases, and suspected involvement confirmed in others, but the neck must be managed based on clinical predictors of nodal metastasis that are suggested by the site and size of the primary tumor.25 Further advances in “functional” nodal imaging using alternative PET tracers, superparamagnetic iron oxide particles,36 and sentinel node imaging37 will likely alter nodal assessment in coming years.
Post-Treatment Imaging
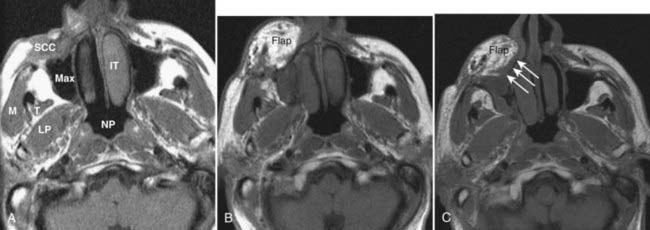
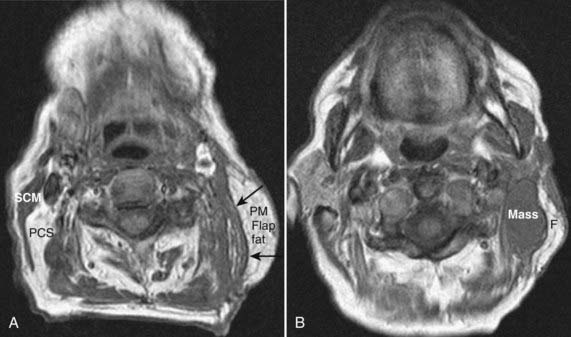
The assessment of the post-therapeutic head and neck cancer patient is complicated by tissue distortion from prior surgery and flap reconstruction,38 as well as radiation effects on the tissues. These changes may make it difficult to detect recurrent neoplasm or new primary or nodal sites of disease. This difficulty can be somewhat alleviated by obtaining a good-quality baseline CT or MRI scan 8 to 12 weeks following completion of therapy to establish a standard for future comparison (Fig. 17-31). A checklist for assessment of the post-treatment scan should include the expected changes based on the patient’s treatment; the presence of a new, persistent, or enlarging mass; perineural spread of disease; denervation changes in muscle; skull-base or cavernous-sinus involvement or both; and nodal or other metastatic disease. It is also important to recognize the normal striated appearance of the muscular component of a musculocutaneous flap as compared with the nonstriated and masslike appearance of recurrent cancer (Fig. 17-32). FDG PET-CT can also be helpful in the assessment of a residual or recurrent tumor, as it is not compromised by tissue distortion.39,40 It does, however, suffer from nonspecificity and its inability to conclusively distinguish inflammation from a tumor. FDG PET-CT ideally is not performed until at least 3 months following completion of radiation therapy to decrease the incidence of false-positive studies resulting from inflammation.
The effects of radiation will be seen on all tissues within the radiation port (Fig. 17-33).41 Reactive changes within the skin and subcutaneous tissues will be seen, with skin thickening and reticulation of the subcutaneous and deep investing fat. The pharyngeal mucosa shows increased enhancement, and there may be pooling of secretions dependently in the pharynx because of decreased motility and difficulty swallowing. The epiglottis and aryepiglottic folds are often dramatically and diffusely thickened. Edema in the retropharyngeal space and carotid sheath may be seen, as well as edema tracking along fascial planes. These changes may gradually improve over time, although in some patients they will persist for many years following completion of therapy. Salivary glands may show increased enhancement compared with normal glands, and they may gradually atrophy over time. Finally, the marrow of the skull base and cervical spine may show marked fatty infiltration resulting from conversion of red to yellow marrow.
Radiation may also have more focal effects on tissues that received particularly high doses, leading to focal areas of tissue necrosis. This can be particularly problematic with regard to bony or cartilaginous structures and may lead to osteoradionecrosis (Fig. 17-34) or chondronecrosis, which is often complicated by associated osteomyelitis. This is particularly problematic in the larynx and also at the skull base, notably in the patient who has undergone high-dose radiation therapy for the treatment of NPC. Patients treated with high-dose radiation for NPC may develop necrosis of the temporal lobes and also radiation-induced optic neuropathy or other cranial neuropathies (Fig. 17-35). These complications should be reduced with the increasing use of highly conformal methods of treatment.
Salivary Glands
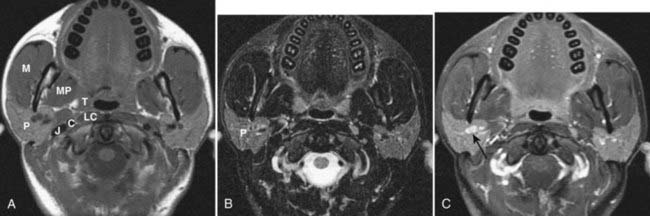
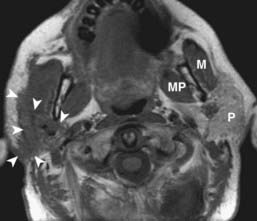
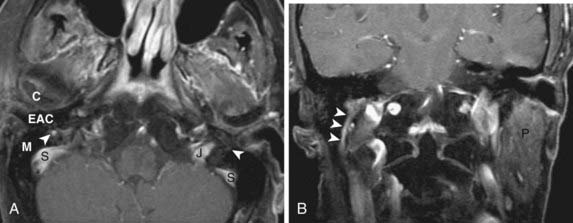
The major salivary glands include the paired parotid, submandibular, and sublingual glands.42 The bulk of the parotid gland lies posterior to the masseter muscle, below and anterior to the external auditory canal and mastoid tip. The remainder of the gland extends medially through the stylomandibular notch. The division of the gland into “superficial” and “deep” lobes is artificial in that there is no anatomic cleavage plane between them, but the plane of the facial nerve is used as an internal reference. The facial nerve cannot be directly visualized within the parotid gland on routine imaging studies. Normal structures that can be seen within the parotid gland include the retromandibular vein and as many as three to five normal lymph nodes. The adult parotid gland has a high adipose content and is relatively bright on a T1-weighted image, whereas it is relatively low signal intensity on T2-weighted images and shows mild homogeneous enhancement postgadolinium (Fig. 17-36). Tumors of the parotid gland are particularly well seen on T1-weighted images as the normal fatty parenchyma is replaced by infiltrative or masslike soft tissue (Fig. 17-37). Low-grade malignancies have imaging characteristics that may be identical to benign salivary tumors, and tissue sampling is needed to make the distinction. Higher-grade neoplasms often have irregular, infiltrative margins. In addition, parotid malignancies may extend centrally along the facial nerve, and the facial nerve needs to be carefully assessed in patients with parotid malignancy (Fig. 17-38).
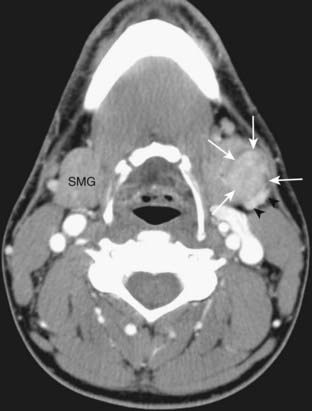
The submandibular gland lies in the submandibular space, below the plane of the mylohyoid muscle but wrapping around its dorsal free edge. It does not have a significant adipose component and is therefore of intermediate soft-tissue signal intensity on MRI rather than having a fatty signal intensity like the parotid gland. Submandibular gland malignancies may appear relatively well circumscribed (Fig. 17-39) or may have infiltrative margins. Neoplasms of the floor of the mouth may obstruct the submandibular duct (the Wharton duct) and lead to ductal dilatation or glandular inflammation or both (Fig. 17-40).
The sublingual gland lies in the floor of the mouth, in the sublingual space, just superior to the mylohyoid muscle. The gland is usually intermediate in signal intensity on T1-weighted images and moderately bright on T2-weighted images. On CT, the normal sublingual space is relatively hypodense because of the fluid content of the gland and ducts and the normal fat that is present in the sublingual space. The sublingual space is frequently involved by inferior extension of tongue and floor-of-mouth SCCs, or by minor salivary gland tumors, a situation that is usually well assessed with coronal plane MRI or CT imaging (Fig. 17-41).
Nasal Cavity and Paranasal Sinuses
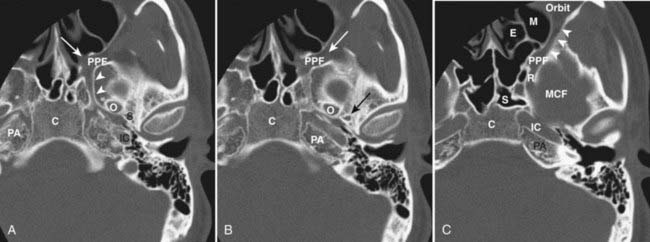
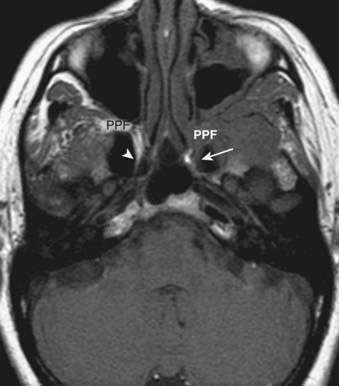
The nasal cavity and paranasal sinuses are connected by multiple ostia. A mass lesion may obstruct drainage from one of the sinuses, and a patient will present with (often unilateral) sinusitis. As many patients with sinonasal symptoms undergo limited coronal CT screening, it is important to review these films with an eye to detecting an underlying mass lesion or areas of aggressive bone destruction or soft tissue infiltration to avoid overlooking a more significant pathologic condition than just inflammatory mucosal disease. In addition, the nasal cavity and paranasal sinuses are intimately related to important adjacent structures (orbit, cribriform plate, pterygopalatine fossa, sella turcica, clivus), and these areas need to be carefully assessed for tumor extension in a patient with a sinonasal malignancy. Once a tumor has accessed the pterygopalatine fossa, it can spread throughout the head and neck, as well as intracranially, because of the multiple interconnections of this space (Fig. 17-42). Because the normal pterygopalatine fossa contains only fat and a few small neural and vascular structures, pregadolinium T1-weighted images should be carefully scrutinized for replacement of the normal high-signal-intensity fat by abnormal intermediate-signal-intensity soft tissue (Fig. 17-43). The retroantral fat should also be scrutinized in a patient with a maxillary sinus malignancy, as should the nasal septum and hard palate in a patient with a nasal cavity malignancy.
MRI and CT imaging are often complementary in the assessment of the patient with a sinonasal malignancy, although MRI generally yields more information.43,44 CT is useful for assessing bone erosion and for certain aspects of surgical planning, but MRI provides far more detailed information about the extent of the tumor. Of note, on CT it is often difficult to separate the soft-tissue density of a tumor from the opacification of adjacent sinuses because of obstruction with resultant mucosal inflammation and accumulation of secretions. MRI facilitates the distinction of tumor versus mucosal edema and secretions. On T1-weighted images, edematous mucosa and trapped secretions may be isointense to the tumor or may show areas of intrinsic T1 shortening (high signal) related to inspissation and elevated protein content (Fig. 17-44A). On T2-weighted images, sinonasal neoplasms are usually of intermediate signal intensity. Edematous mucosa, on the other hand, typically has very high signal intensity, and trapped secretions may be very bright if relatively fluid or very dark if very desiccated and inspissated (Fig. 17-44B). Postgadolinium, sinonasal tumors typically show moderate homogeneous enhancement, whereas inflamed and edematous mucosa shows marked enhancement and trapped secretions show no enhancement. A coronal FSE T2-weighted image is often particularly helpful in distinguishing a tumor from adjacent mucosal disease (Fig. 17-45).
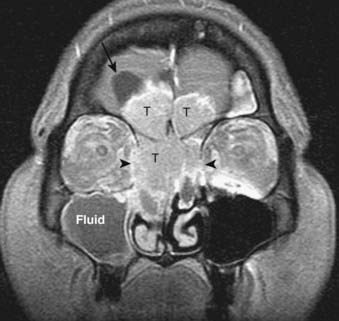
The sinonasal cavities are commonly involved by SCC, lymphoma, and minor salivary gland tumors. In addition, esthesioneuroblastoma is an important consideration for tumors that arise high in the nasal vault, and mucosal melanomas are also seen with some frequency in the sinonasal cavities. Any of these lesions may cause aggressive bone destruction and infiltration and invasion of adjacent soft-tissue structures. The preoperative distinction among these lesions is therefore generally not possible with imaging alone, and tissue sampling is required for definitive diagnosis. The major exception to this is the juvenile angiofibroma, as the large and numerous flow voids in a nasal cavity mass in an adolescent boy are pathognomonic for this diagnosis (Fig. 17-46). Certain other imaging features can occasionally be helpful in the preoperative differential diagnosis, as mucosal melanomas may show areas of increased signal intensity on pregadolinium T1-weighted images because of hemorrhage or melanin content or both (Fig. 17-47),45 whereas esthesioneuroblastoma may demonstrate peripheral intracranial cysts (Fig. 17-48).46
Thyroid Gland
Normal Anatomy
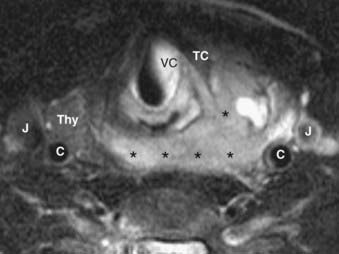
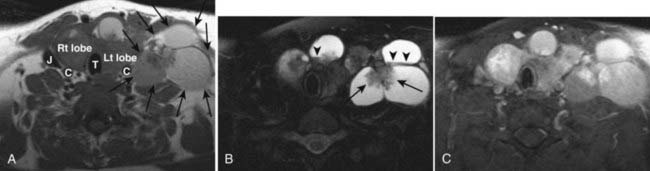
The normal thyroid gland is intrinsically dense on CT because of its iodine content and enhances intensely and homogeneously following administration of iodinated contrast (Fig. 17-49). In a patient suspected of having or known to have thyroid carcinoma, administration of iodinated contrast should be avoided if the patient is to undergo radioiodine imaging or therapy, because the iodine from the contrast material will saturate the gland for weeks to months. These patients are usually best assessed by MRI, which provides exquisite detail of the extent of disease and avoids the administration of an iodine-based contrast agent. On MRI, the normal thyroid gland is of homogeneous intermediate signal intensity on T1– and T2-weighted images and shows intense and homogeneous enhancement postgadolinium.47
Pathologic Conditions
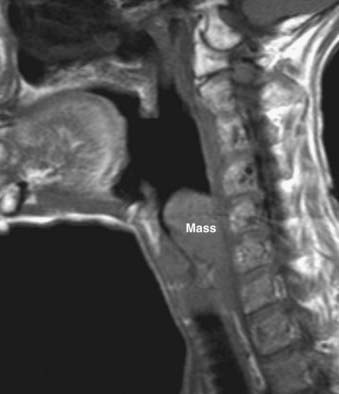
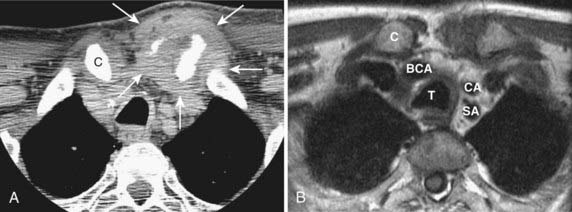
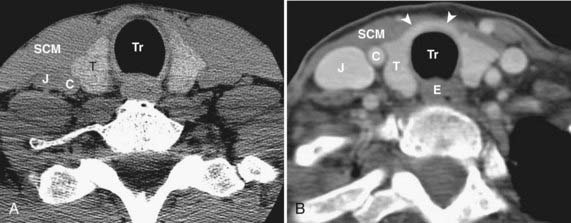
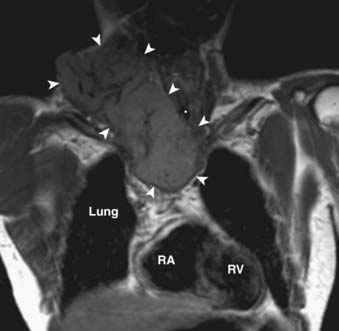
A thyroid malignancy may simulate a benign process on cross-sectional imaging, and tissue sampling is usually necessary for definitive diagnosis. Both papillary and follicular carcinomas of the thyroid may present as well-circumscribed lesions that have variable enhancement characteristics on CT or MRI. Cyst formation may result in well-circumscribed areas of fluid density or intensity, and calcifications may be seen as well. On US, neoplasms are typically hypoechoic, and on radioiodine studies they are seen as cold nodules. If a lesion is allowed to grow unchecked, invasion into adjacent structures will be seen, and airway compromise may be seen as well (Fig. 17-50). In addition, cervical nodal metastatic disease may be evident. On MRI, the presence of intrinsic T1 shortening in lymph nodes is highly suspicious for metastatic thyroid cancer (Fig. 17-51) resulting from either the thyroglobulin content or the propensity of these nodes to undergo hemorrhage. On CT, nodes involved with metastatic thyroid cancer may appear cystic.
1 Brink JA, Heiken JP, Wang G, et al. Helical CT: Principles and technical considerations. Radiographics. 1994;14:887.
2 Rydberg J, Buckwalter KA, Caldemeyer KS, et al. Multisection CT: scanning techniques and clinical applications. Radiographics. 2000;20:1787.
3 Lewis MA. Multislice CT: Opportunities and challenges. Br J Radiol. 2001;74:779.
4 Hendrick RE. The AAPM/RSNA physics tutorial for residents. Basic physics of MR imaging: An introduction. Radiographics. 1994;14:829.
5 Plewes DB. The AAPM/RSNA physics tutorial for residents. Contrast mechanisms in spin-echo MR imaging. Radiographics. 1994;14:1389.
6 Hermans R, Vandecaveye V. Diffusion-weighted MRI in head and neck cancer. Cancer Imaging. 2007;7:126.
7 Kanal E, Borgstede JP, Barkovich AJ, et al. American College of Radiology white paper on MR safety. AJR Am J Roentgenol. 2002;178:1335.
8 Shellock FG, Spinazzi A. MRI safety update 2008: Part 2, screening patients for MRI. AJR Am J Roentgenol. 2008;191:1140.
9 Shellock FG, Spinazzi A. MRI safety update 2008: Part 1, MRI contrast agents and nephrogenic systemic fibrosis. AJR Am J Roentgenol. 2008;191:1129.
10 Jabour BA, Choi Y, Hoh CK, et al. Extracranial head and neck: PET imaging with 2-[F-18]fluoro-2-deoxy-D-glucose and MR imaging correlation. Radiology. 1993;186:27.
11 Menda Y, Graham MM. Update on 18F-fluorodeoxyglucose/positron emission tomography and positron emission tomography/computed tomography imaging of squamous head and neck cancers. Semin Nucl Med. 2005;35:214.
12 Quon A, Fischbein NJ, McDougall IR, et al. Clinical role of 18F-FDG PET/CT in the management of squamous cell carcinoma of the head and neck and thyroid carcinoma. J Nucl Med. 2007;48(Suppl 1):58S.
13 Rege S, Maass A, Chaiken L, et al. Use of positron emission tomography with fluorodeoxyglucose in patients with extracranial head and neck cancers. Cancer. 1994;73:3047.
14 McGuirt WF, Greven K, Williams DIII, et al. PET scanning in head and neck oncology: A review. Head Neck. 1998;20:208.
15 Harnsberger HR. CT and MRI of masses of the deep face. Curr Probl Diagn Radiol. 1987;16:141.
16 Harnsberger HR, Osborn AG. Differential diagnosis of head and neck lesions based on their space of origin. 1. The suprahyoid part of the neck. AJR Am J Roentgenol. 1991;157:147.
17 Smoker WR, Harnsberger HR. Differential diagnosis of head and neck lesions based on their space of origin. 2. The infrahyoid portion of the neck. AJR Am J Roentgenol. 1991;157:155.
18 Ng SH, Chong VF, Ko SF, et al. Magnetic resonance imaging of nasopharyngeal carcinoma. Top Magn Reson Imaging. 1999;10:290.
19 Hermans R, Lenz M. Imaging of the oropharynx and oral cavity. Part I: Normal anatomy. Eur Radiol. 1996;6:362.
20 Lenz M, Hermans R. Imaging of the oropharynx and oral cavity. Part II: Pathology. Eur Radiol. 1996;6:536.
21 Laine FJ, Smoker WR. Oral cavity: anatomy and pathology. Semin Ultrasound CT MR. 1995;16:527.
22 Weissman JL, Carrau RL. “Puffed-cheek” CT improves evaluation of the oral cavity. AJNR Am J Neuroradiol. 2001;22:741.
23 Pameijer FA, Mukherji SK, Balm AJ, et al. Imaging of squamous cell carcinoma of the hypopharynx. Semin Ultrasound CT MR. 1998;19:476.
24 Becker M. Larynx and hypopharynx. Radiol Clin North Am. 1998;36:891.
25 Lindberg R. Distribution of cervical lymph node metastases from squamous cell carcinoma of the upper respiratory and digestive tracts. Cancer. 1972;29:1446.
26 Shah J. Patterns of cervical lymph node metastases from squamous cell carcinomas of the upper aerodigestive tract. Am J Surg. 1990;160:405.
27 Becker M. Neoplastic invasion of laryngeal cartilage: radiologic diagnosis and therapeutic implications. Eur J Radiol. 2000;33:216.
28 Blitz AM, Aygun N. Radiologic evaluation of larynx cancer. Otolaryngol Clin North Am. 2008;41:697.
29 Som PM, Curtin HD, Mancuso AA. An imaging-based classification for the cervical nodes designed as an adjunct to recent clinically based nodal classifications. Arch Otolaryngol Head Neck Surg. 1999;125:388.
30 Som PM, Curtin HD, Mancuso AA. Imaging-based nodal classification for evaluation of neck metastatic adenopathy. AJR Am J Roentgenol. 2000;174:837.
31 Van den Brekel MW, Castelijns JA, Stel HV, et al. Modern imaging techniques and ultrasound-guided aspiration cytology for the assessment of neck node metastases: a prospective comparative study. Eur Arch Otorhinolaryngol. 1993;250:11.
32 Stoeckli SJ, Steinert H, Pfaltz M, et al. Is there a role for positron emission tomography with 18F-fluorodeoxyglucose in the initial staging of nodal negative oral and oropharyngeal squamous cell carcinoma? Head Neck. 2002;24:345.
33 Adams S, Baum RP, Stuckensen T, et al. Prospective comparison of 18F-FDG PET with conventional imaging modalities (CT, MRI, US) in lymph node staging of head and neck cancer. Eur J Nucl Med. 1998;25:1255.
34 Van den Brekel MW. Lymph node metastases: CT and MRI. Eur J Radiol. 2000;33:230.
35 Curtin HD, Ishwaran H, Mancuso AA, et al. Comparison of CT and MR imaging in staging of neck metastases. Radiology. 1998;207:123.
36 Anzai Y, Prince MR. Iron oxide-enhanced MR lymphography: the evaluation of cervical lymph node metastases in head and neck cancer. J Magn Reson Imaging. 1997;7:75.
37 Von Buchwald C, Bilde A, Shoaib T, et al. Sentinel node biopsy: the technique and the feasibility in head and neck cancer. ORL J Otorhinolaryngol Relat Spec. 2002;64:268.
38 Hudgins PA, Burson JG, Gussack GS, et al. CT and MR appearance of recurrent malignant head and neck neoplasms after resection and flap reconstruction. AJNR Am J Neuroradiol. 1994;15:1689.
39 Anzai Y, Carroll WR, Quint DJ, et al. Recurrence of head and neck cancer after surgery or irradiation: prospective comparison of 2-deoxy-2-[F-18]fluoro-D-glucose PET and MR imaging diagnoses. Radiology. 1996;200:135.
40 Fischbein NJ, AAssar OS, Caputo GR, et al. Clinical utility of positron emission tomography with 18F-fluorodeoxyglucose in detecting residual/recurrent squamous cell carcinoma of the head and neck. AJNR Am J Neuroradiol. 1998;19:1189.
41 Mukherji SK, Mancuso AA, Kotzur IM, et al. Radiologic appearance of the irradiated larynx. Part I. Expected changes. Radiology. 1994;193:141.
42 Weissman JL. Imaging of the salivary glands. Semin Ultrasound CT MR. 1995;16:546.
43 Weissman JL, Tabor EK, Curtin HD. Magnetic resonance imaging of the paranasal sinuses. Top Magn Reson Imaging. 1990;2:27.
44 Hasso AN, Lambert D. Magnetic resonance imaging of the paranasal sinuses and nasal cavities. Top Magn Reson Imaging. 1994;6:209.
45 Yousem DM, Li C, Montone KT, et al. Primary malignant melanoma of the sinonasal cavity: MR imaging evaluation. Radiographics. 1996;16:1101.
46 Som PM, Lidov M, Brandwein M, et al. Sinonasal esthesioneuroblastoma with intracranial extension: marginal tumor cysts as a diagnostic MR finding. AJNR Am J Neuroradiol. 1994;15:1259.
47 Loevner LA. Imaging of the thyroid gland. Semin Ultrasound CT MR. 1996;17:539.