[level-membership-for-pulmolory-and-respiratory-category]
Chapter 5 Gas Exchange
The Basis of Gas Exchange: Ventilation, Diffusion, and Perfusion
 m2 (640-fold less). Moreover, if the same mass of 0.5-µm-thick alveolar wall tissue covering all 300 million alveoli were spread around this one sphere, its thickness would be over 300 µm, also about 600 times greater than in the actual lung. Because diffusion rates depend on the ratio of area to thickness, the real lung is about 640 × 600, or 400,000 times better at diffusive transport than would be a single sphere of the same volume and mass. The message is that by dividing up the lung into a very large number of very small structures, diffusion becomes a feasible and energy-efficient method of gas exchange, circumventing the need for active transport.
Challenges to Lung Function Caused by its Structure
Inequality of ventilation and blood flow: Because the lungs are ventilated through a single main airway (trachea), yet air must reach all 300 million alveoli, there must be a substantial branching airway system. Indeed, some 23 orders of largely dichotomous branching are recognized, resulting in a very large number of very small airways arranged in parallel with each other—much like tree branches emanating and serially dividing from a single trunk. It is impossible to imagine that inhaled air can be distributed homogeneously to all 300 million alveoli, and nonuniform ventilation distribution is well known to occur. Similarly, blood flow reaches the lungs from the main pulmonary artery by a corresponding branching system, and it also is known that perfusion is nonuniform. Nonuniform distribution of ventilation and blood flow are important for gas exchange efficiency as will be shown later.
Wasted ventilation (dead space): The first 17 or so generations of the airways are conducting airways—plumbing whose walls are unable to perform any gas exchange. Their total volume is about 150 mL. This means that with every single breath, 150 mL of inhaled air never reaches the alveoli yet must be moved by muscle contraction. Normally, each breath is about 500 mL in total volume, so about 30% of each breath represents wasted effort. This is not important in health, but in some lung diseases, the effort of breathing is so high that this wasted ventilation, called dead space, leads to insufficient ventilation of fresh gas to the alveoli.
Alveolar collapse: A very large number of very small collapsible structures is potentially physically unstable, due to surface tension forces. The laws of physics show that the pressure inside a soap bubble caused by surface tension is inversely proportional to the bubble radius. To the extent that the soap bubble analogy applies to the alveoli, which simply are not all exactly equal in size, surface tension forces will therefore tend to empty small alveoli into larger alveoli. Unchecked, this progression would lead to massive alveolar collapse with loss of gas exchange surface area and could prove fatal. In fact, the neonatal respiratory distress syndrome is considered to represent an example of just this phenomenon. The body has solved this problem by generating, in normal full-term newborns, a surfactant that lines each alveolus. It reduces surface tension by about an order of magnitude, greatly mitigating the risk of alveolar collapse. What also helps prevent collapse is the aforementioned interdependence whereby adjacent alveoli share common alveolar walls, creating a mesh or network that is inherently self-stabilizing.
Particle deposition: An array of about 20 orders of dichotomous branching leads to a very large (220 in this case) number of small peripheral airways. Although individually each is very small, there are so many of them that their total cross-sectional area becomes very large. With this arrangement, the forward velocity of the air in each small airway is reduced as air is inhaled, which in turn increases the chance that an inhaled dust (or other) particle will settle out and deposit on the small airway wall (compared with larger, more proximal airways, in which the velocity of air flow is much greater). If such a particle is physically, chemically, or biologically dangerous, disease may result, often starting in those small peripheral airways—as is the case for emphysema caused by inhalation of tobacco smoke.
Airway obstruction by mucus: Although the airways have developed a sophisticated particle clearance mechanism using mucociliary transport, the mucus that traps the particles may itself occlude small airways, impairing distal ventilation of the alveoli.
Capillary stress failure: The pulmonary microcirculation is at risk from the inherent structure of the lungs. With capillaries poorly supported in very thin alveolar walls (good for diffusion), they risk rupture into the alveolar space when intravascular pressures rise even modestly. Such alveolar hemorrhage occurs in several conditions, and especially in racehorses, whose lungs are relatively small, leading to high vascular pressures, which in this setting can be fatal.
Pulmonary hypertension: Because all of the cardiac output has to pass through the lungs (compare the systemic circulation, for which flow is divided among all of the body’s other tissues and organs), the potential for high vascular pressures is considerable. The twin processes of capillary distention and recruitment mitigate increases in pressure when perfusion is increased, as in exercise.
Gas Exchange in the Homogeneous Lung: Ventilation, Diffusion, and Perfusion
Ventilation
 ) can be expressed as the difference between how much O2 was inhaled and how much was exhaled (over that minute). This relation holds because inhaled O2 has only two fates—diffusing into the blood or being exhaled. The amount inhaled is the product of minute ventilation and the concentration of O2 in inhaled air; the amount exhaled is the product of minute ventilation and the concentration of O2 in the exhaled gas. Because O2 concentration is constantly changing during the course of an exhalation, it is appropriate to use the mean concentration over exhalation. Minute ventilation is the product of the volume of each breath (L/breath) and the frequency of breathing (breaths/minute). Although the volumes inhaled and exhaled might be expected to be the same (or the lungs would either blow up or collapse), exhaled volume usually is 1% less than that inhaled because the amount of O2 absorbed into the blood is a little more than the amount of CO2 eliminated from the blood. This small difference can be neglected in most circumstances, as is the case in the following discussion. The mass conservation equation that then describes O2 uptake as a function of ventilation is
where  is the volume of O2 taken up into the blood per minute, and
  is the minute ventilation, both expressed in L/minute. FIO2 and FEO2 are, respectively, the inhaled and exhaled mean O2 fractional concentrations.
  commonly is about 7 L/minute. Because about 21 of every 100 molecules in air are O2 molecules (the rest being mostly nitrogen), FIO2 is 0.21. FEO2 at rest is about 0.17; this difference shows that
  is about 0.3 L/minute. Because the conducting airways that feed the alveoli do not exchange O2 or CO2, it has become conventional to subtract the volume of gas left in the conducting airways each breath—the so-called anatomic dead space—from the total breath volume before multiplying by respiratory frequency to calculate ventilation, resulting in a variable known as alveolar ventilation (
 ). Equation 1 then becomes

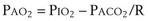
The tendency is to use partial pressure (PIO2, inhaled; PAO2, alveolar) rather than fractional concentration (FIO2, FAO2) in describing these relationships: From Dalton’s law of partial pressure, PO2 = FO2 × (barometric pressure − water vapor pressure). Allowing for proper units, Equation 2 can then be rewritten as

 is now expressed in mL/minute,
  in L/minute, and P in mm Hg.
 is the whole-body metabolic rate and as such is dictated by the body tissues, not the lungs. Because PIO2 is a constant, Equation 2 can be used to demonstrate the dependence of alveolar PO2 on alveolar ventilation for a given value of
  (Figure 5-1). The same concepts apply to CO2, for which it is simpler, because CO2 is essentially absent from inhaled air. The corresponding equation is
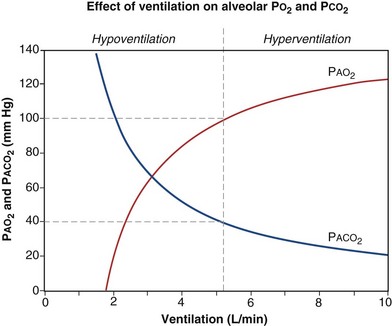

How ventilation affects PACO2 also is shown in Figure 5-1. It is evident that a relatively small reduction in ventilation will reduce PAO2 and increase PACO2—both substantially.
Dividing Equation 4 by Equation 3 gives

which can be rearranged into what is called the alveolar gas equation:

Diffusion
The laws of diffusion dictate that the rate at which a gas diffuses between two points is the product of the diffusion coefficient for the gas and the partial pressure difference between the two points. In the lungs, the diffusion coefficient, measured as the diffusing capacity, is determined by surface area and distance of the diffusion pathway (see earlier). When a red cell leaves the pulmonary arteries and enters the pulmonary capillary, it arrives with a reduced level of O2, because the tissues visited by that red cell took O2 from the red cell for the tissue’s metabolic needs. The PO2 in the red cell in this blood commonly is about 40 mm Hg. Alveolar PO2, on the other hand, usually is about 100 mm Hg. The large PO2 difference (“driving gradient”) of 60 mm Hg leads to rapid diffusion of O2 from the alveolar gas into the capillary blood. Consequently, however, the blood PO2 increases, reducing the driving gradient, and O2 diffusion slows down as the red cell progresses along the lung capillary network. With modeling of this process, again using mass conservation principles, PO2 is seen to rise approximately exponentially as the red cell moves along the lung capillary until PO2 in the red cell has reached the alveolar value, indicating that diffusion equilibration has occurred. This process is shown in Figure 5-2. Note that for O2, equilibration occurred in about 0.25 second. On average, each red cell takes about 0.75 second to move through the alveolar capillary system, so that diffusion equilibration is complete already a third of the way along the capillary, and thus well before its end. As might be expected, during exercise, time available for a red cell to pick up O2 in the lung is reduced, because blood flow rate is increased, and at very high exercise intensity, there may not be sufficient time for PO2 in the red cell to reach the alveolar value. Accordingly, PO2 in the systemic arterial blood will be lower than that in the alveolus—a situation referred to as hypoxemia caused by diffusion limitation. This effect is seen commonly in exceptional athletes exercising heavily at sea level, and in all subjects exercising at altitude.
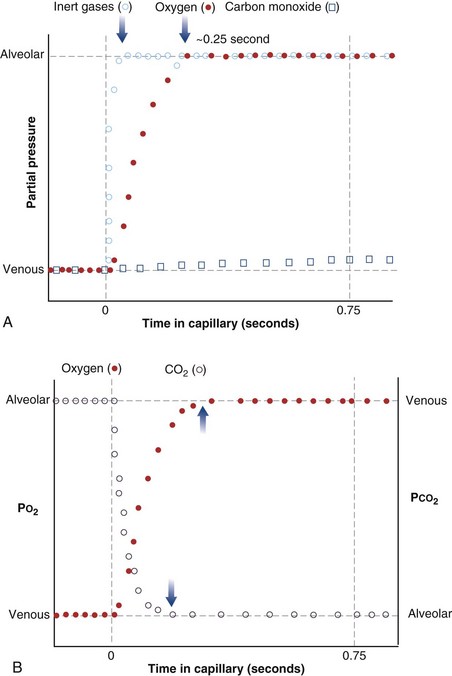
While CO2 moves from blood to gas, the principle is the same as for O2. Here, the red cell enters the alveolar capillary with a high PCO2 (because of addition of waste CO2 from tissues visited by the red cell), whereas alveolar PCO2 is lower. Thus, diffusion will move CO2 from red cell to alveolar gas, and red cell PCO2 will fall toward the alveolar value in mirror image to the rise in PO2 described earlier (see Figure 5-2). The speed of equilibration for CO2 is about twice that for O2, so it takes about half the time to reach equilibration. In practice, CO2 is never diffusion-limited. Gases carried in blood only in physical solution (i.e., inert and anesthetic gases) equilibrate even faster—about 10 times as quickly as for O2 (see Figure 5-2). This rule holds true for gases of any solubility.
 ) is the amount of O2 in the blood leaving the lungs each minute heading for the left atrium, minus the amount that had entered the lungs in the pulmonary arterial blood. These amounts are the product of the concentration of O2 in each site and the blood flow rate. If Cec
 is the blood flow rate through the lungs, mass conservation gives


Gas Exchange
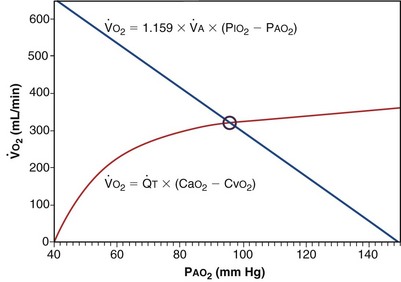
Focusing on O2, Equations 3 and 8 should now be considered together. They both embody mass conservation but express it differently, with Equation 3 reflecting alveolar loss of O2 into blood and Equation 8, red cell gain of O2 into blood. Figure 5-3 shows how, for given constant values of  and
and  , and for designated values of inspired PO2 (PIO2) and inflowing pulmonary arterial O2 concentration (CvO2),
  would have to vary with alveolar PO2 (to satisfy both these equations) when determined by each of the two equations independently. Because each molecule of O2 that leaves the alveolus by crossing the blood gas barrier appears in the capillary blood, the
  calculated from the two equations must be the same—again, conservation of mass. Thus, only a single value of PAO2 can exist—that at the point of intersection of the two relationships in Figure 5-3. If the calculations in Figure 5-3 were repeated for different values of
  , and thus
  (in this example, keeping
  the same), the lines and their point of intersection would change as in Figure 5-4. This figure shows that alveolar PO2 (x axis) and the amount of O2 that can be taken up (
 , y axis) both depend on
  and
and  . Commonly, Equations 3 and 8 are combined, because
  must be the same when calculated from either equation. This yields the ventilation-perfusion equation:
 ): one as a function of ventilation (
 , straight line) and the other based on blood flow (
 , curved line), as alveolar P
 and
and  . The point of intersection (open circle) is the only combination of
  and P
and P and
and  .
.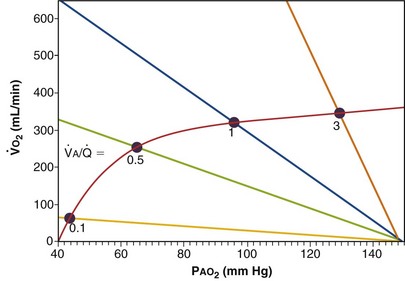
Figure 5-4 Same analysis as in Figure 5-3, with the four straight lines reflecting four values of ventilation,  , but only one value of blood flow,
  (and thus yielding four values of their ratio,
  ). PAO2 increases with
  , as shown by the four filled circles.


 to
to  that determines the alveolar P
Figure 5-5 shows how alveolar PO2 and PCO2 vary with  when inspired PO2 is that of room air and the pulmonary arterial (mixed venous) PO2 is normal (i.e., 40 mm Hg). Important conclusions to be drawn from this figure are that as
  falls, PO2 falls, approaching the mixed venous value at low
  values, and conversely, PCO2 rises. Also, as
  rises, PO2 approaches the inspired value, while PCO2 falls. The dashed lines show that at the normal value for the
  ratio of about 1, PO2 is about 100 mm Hg, and PCO2 is about 40 mm Hg.
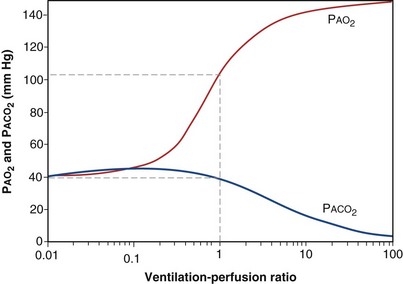
Figure 5-5 How alveolar PO2 (and PCO2) vary with ventilation-perfusion ratio ( ), based on the analysis of Figures 5-3 and 5-4. Dashed lines show normal values for a
  of 1. Normal conditions are assumed: inspired PO2 = 150 mm Hg, PCO2 = 0 mm Hg, mixed venous PO2 = 40 mm Hg, PCO2 = 45 mm Hg. PAO2 and PACO2 approach mixed venous values as
  approaches zero and inspired values as
  approaches infinity.
 range 0.3 to 3, whereas for CO2, most of its change is seen in the
  range 2 to 20, almost a decade higher. The gases obey the very same conservation of mass rules in their exchange, so their quantitative differences are due to differences in their transport properties in blood.
Ventilation-Perfusion Inequality and Gas Exchange
 (equal to the ratio of total alveolar ventilation to total pulmonary blood flow). In real life, not all alveoli enjoy the same
  to
to  ratio. In fact, even in healthy young humans there is about a 10-fold difference between the lowest and highest values, from a low of about 0.3 to a high of about 3. This difference is due to both gravitational influences (higher
  in nondependent than in dependent regions) and nongravitational factors such as variation in length and diameter of airways and blood vessels. Alveoli with different
  ratios are connected in parallel: Mixed venous blood reaches them all, and then the end-capillary blood from each flows into the pulmonary veins, much like tributaries joining a river. In lung diseases, variation in
  (also called
  inequality) can be extreme and even fatal. Thus, it is essential to consider how such inequality affects the ability of the lungs to take up O2 and eliminate CO2.
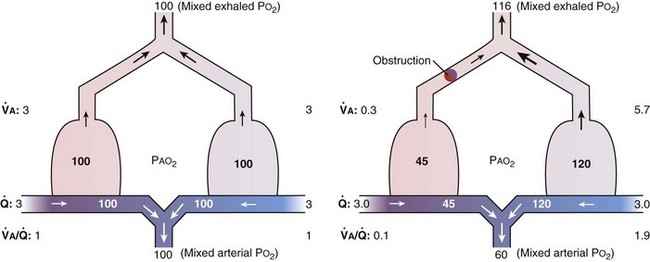
This analysis can be done by comparing a homogeneous lung to one with the simplest degree of inequality—a lung imagined to have two “alveoli” of different  ratios. This schema is illustrated in Figure 5-6. In the left panel, the homogeneous case, with a total ventilation of 6 L/minute and a total blood flow also of 6 L/minute, both equally divided between two identical “alveoli,” PO2 and PCO2 values can be read off Figure 5-5 for the resulting
  ratio of 1.0. In the case of inequality, the example in the right panel shows the effect of severe but incomplete airway obstruction, causing 90% reduction in ventilation of the left “alveolus,” with corresponding redistribution of ventilation to the right “alveolus” (that is, total ventilation and blood flow are assumed to be unaltered by the airway obstruction). The PO2 values are again read from Figure 5-5 and are now 45 and 120 mm Hg, respectively. As the two “alveoli” exhale, their gas streams mix in proportion to the relative gas flow rates, resulting in a mixed exhaled PO2 of 116 mm Hg. Similarly, the blood leaving each “alveolus” has the same PO2 as in the respective alveolar gas, as shown, and these two blood streams mix again in proportion to their blood flows. Here the computation is performed using the concentrations, not partial pressures, and when this is done, the mixed arterial PO2 is reduced to only 60 mm Hg.
 also must have the same P
 each 10-fold. Mixed exhaled P
 ratio is not everywhere the same, gas exchange suffers: Arterial P
The same occurs for PCO2, but in the opposite direction:  inequality increases arterial PCO2, reduces mixed exhaled PCO2, and thus also reduces the amount of CO2 eliminated. Figure 5-7 shows the values for CO2 for the same case as in Figure 5-6. What is seen, however, is a quantitatively larger negative effect on O2 than on CO2, in terms of both the arterial partial pressures and total amounts of gas transferred.
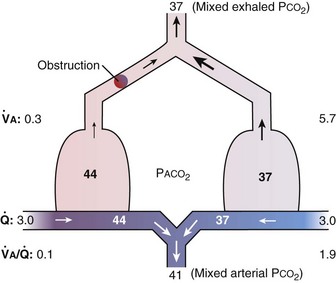
Figure 5-7 Corresponding calculations for CO2 in the same model as in Figure 5-6, right. CO2 output is impaired, whereas arterial PCO2 is increased and exhaled PCO2 is decreased, although the changes are less than for O2.
That O2 is more affected than CO2 in this instance reflects the nature of the example: The obstructed “alveolus” has a very low  ratio. With modeling of exactly the same problem but this time reducing blood flow in one “alveolus” by 90%, rather than reducing ventilation as in Figures 5-6 and 5-7,
  inequality would still be present and both gases would be affected, but because the abnormal “alveolus” has a high and not low
  ratio, the quantitative effects are different: CO2 is affected more than is O2.
 inequality are always to impair gas exchange for all gases, but the degree to which any one gas is affected depends on the exact pattern of distribution of ventilation and blood flow. The basic reason why O2 and CO2 are differently affected in any given pattern is found in the differences in their dissociation curves in blood. That for O2 is quite nonlinear; that for CO2 is almost linear and also is much steeper. In sum, O2 is affected more when low
  regions dominate; CO2 is more affected when high
  regions dominate.
Shunt
Shunt refers to blood that crosses from the right to the left side of the heart without encountering any alveolar gas. This pathophysiologic entity can be due to ventricular or atrial septal defects and other intracardiac anomalies, or to lung lesions such as complete airway obstruction, atelectasis, pneumothorax, pulmonary edema, pneumonic consolidation, and large arteriovenous intrapulmonary vascular malformations. Referring back to Figure 5-6, which illustrates partial airway obstruction, a shunt could be modeled by assigning zero ventilation to the left “alveolus” and all the ventilation to the right side. The effects would be slightly more severe than those illustrated for partial obstruction, but the point is that a shunt can be thought of as an extreme of  inequality: a region with
  = 0, because ventilation is absent.
There is, however, a special feature of shunt that merits discussion: response to inhalation of 100% O2. When  inequality is present, and 100% O2 is inhaled, all alveolar nitrogen that had been present in the lungs of a subject breathing room air will eventually wash out, and the only gases in the alveoli will be O2 and CO2. PO2 in all alveoli will be above about 600 mm Hg, no matter what the
  ratio is for each alveolus. Accordingly, on 100% O2, a lung with
  inequality will exchange O2 normally. In the presence of shunt, however, the shunted blood is never exposed to 100% O2, and its PO2 remains low (at PO2 in the inflowing pulmonary arterial blood). This, using the same principles as in Figure 5-6, causes the mixed arterial PO2 to be abnormally low even as 100% O2 is inhaled.
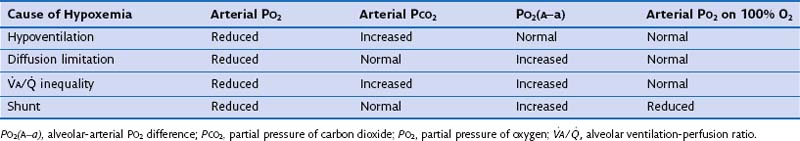
The Four Causes of Hypoxemia
1. Hypoventilation (see Figure 5-1)
2. Diffusion limitation (not illustrated but discussed earlier)
 inequality (see
 The alveolar gas equation derived earlier (Equation 6) is useful in separating hypoxemia from these various insults: For hypoventilation alone, the equation predicts exactly how much arterial PO2 will fall for any given increase in arterial PCO2, because the alveolar PO2 and the arterial PO2 remain equal. However, as shown in Figure 5-6, for  inequality, the exhaled alveolar PO2 increases while the arterial PO2 falls. Equation 6 is used to compute alveolar PO2 by inserting arterial PCO2 into the equation, and when this is done and the arterial PO2 is subtracted from it, one has what is called the alveolar-arterial PO2 difference PO2(A−a). The typical patterns of arterial PO2, PCO2, and PO2(A−a) are illustrated in Table 5-1 for each cause of hypoxemia, together with the response to 100% O2 breathing mentioned earlier. In Table 5-1, it is specifically assumed that the body has not reacted to the hypoxemia by any of the compensatory mechanisms normally available to it, as discussed next. In life, such compensatory reactions are the rule, unless special circumstances such as trauma, heart disease, or narcotic overdose also are present.
Compensatory Mechanisms
When hypoxemia develops for any reason, three principal compensatory mechanisms are invoked:
1. Greater O2 extraction from blood by the tissues. When arterial PO2 falls, the initial response of the body is to extract more O2 from the flowing blood. In this way,  can be restored passively, both rapidly and effectively. It does result in a lower PO2 in the venous blood returning to the lungs, which may further impair arterial oxygenation, thereby worsening the hypoxemia, but metabolism is protected. The same occurs in reverse for CO2: More CO2 is added to the tissue venous blood, raising the CO2 level in the blood reaching the lungs. If ventilation remains unchanged, arterial PCO2 must rise as a result.
2. Hyperventilation. Within seconds of the emergence of hypoxemia, chemoreceptors are stimulated, and reflex increase in ventilation occurs. This response usually is very effective in reducing an elevated arterial PCO2 to normal but often is less effective in restoring arterial PO2. Indeed, in an attempt to normalize PO2, ventilation commonly is increased to the point of causing arterial hypocapnia despite gas exchange abnormalities that in themselves impair CO2 exchange. Hyperventilation is not especially effective in restoring arterial PO2 in conditions associated with very low  ratios, such as asthma, pneumonia, and acute lung injury. It is much more effective in diseases in which high
  ratios are the principal pulmonary abnormality—especially pulmonary thromboembolic disease.
3. Increased cardiac output. The sympathetic stimulation resulting from hypoxemia and other factors in many lung diseases may result in tachycardia and an elevated cardiac output. The increased output allows less fractional extraction of O2 in the tissues, which has the effect of increasing the PO2 of the venous blood returning to the heart, which in turn elevates and partly restores arterial PO2. This clinical situation commonly is seen in asthmatic patients during acute episodes, especially when β-sympathetic agonists have been taken in large doses, but is unusual in chronic, stable disease states.
 and
and  to levels necessary to sustain tissue metabolism. Failure to invoke these mechanisms leads to tissue death and can be fatal.
Clinical Assessment of Gas Exchange Based on Physiologic Principles
Alveolar-Arterial PO2 Difference: PO2(A−a)
As noted earlier, Equation 6, derived previously, is called the alveolar gas equation.
If an arterial blood gas sample is taken, arterial PO2 (PaO2) and arterial PCO2 (PaCO2) are available. PaO2 as measured can then be subtracted from PAO2 as calculated from Equation 6, to get PO2(A−a):

Shunt:  s/
s/ t
t
 /
/ t) necessary to flow through the “shunt” compartment to explain the measured arterial P
This is a conservation of mass or mixing equation that states that the arterial O2 concentration (CaO2) is the blood flow–weighted average of the concentrations of O2 coming from the shunt ( , shunt flow; CvO2, mixed venous O2 concentration) and the normal compartment (
 t −
t −  , nonshunt blood flow; CecO2, end-capillary O2 concentration).
  t is total blood flow, or cardiac output. Equation 13 can be rearranged as follows:

This is called the shunt equation. To use it, CecO2 is calculated using the oxygen-hemoglobin dissociation curve, and the PAO2 as calculated from Equation 6; CaO2 is determined from an arterial blood gas sample, and CvO2 is either assumed or measured from a mixed venous blood sample. If CvO2 is assumed to have a specific value, the calculated value of shunt fraction ( s/
s/ t) is only as accurate as the assumed value of CvO2.
 alveoli have very high P
 /
/ t would in general be larger, because when less than pure O2 is breathed, areas of low ventilation-perfusion ratio contribute numerically to what appears as
  /
/ t, because they show less than full O2 saturation of hemoglobin.
Physiologic Dead Space: Vd/Vt
 —that is, it is ventilated (
 > 0) but unperfused (
 = 0). No gas exchange occurs because there is no blood flow. This compartment therefore wastes any ventilation it gets. Its alveolar P


This dead space equation needs as input arterial PCO2 as well as PCO2 measured in mixed exhaled gas.
The foregoing discussion makes it clear that taking an arterial blood sample is critical for estimating all three parameters of gas exchange. For accurate results, an arterial blood sample is not sufficient. Mixed exhaled gas is required to determine R ( ) in Equation 12 and for measuring mixed exhaled PCO2 (PECO2) as used in Equation 17. Moreover, Equation 14 requires an estimate of mixed venous O2 concentration.
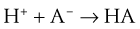
Acid-Base Relationships
Buffering
 (18)
(18)Should the opposite condition exist—a reduction in free [H+] (known as alkalosis), the reaction shown in Equation 18 can run from right to left, thereby increasing H+ ion levels and lowering pH back toward normal.
The Lungs
Just as the kidneys can counteract either an acidosis or an alkalosis, the lungs have the ability to do likewise. The lungs contribute to regulation of blood pH through changes in PCO2 brought about by changes in ventilation. In sum, an increase in [H+] in the blood stimulates both central (ventral medullary) and peripheral (carotid body) chemoreceptors, which send neural signals to the respiratory control areas of the brain, which in turn direct the respiratory muscles to produce an increase in ventilation, thereby decreasing PCO2 (refer to Equation 4). A decrease in [H+] does the opposite. This effect is achieved through the buffering principle, as described, with carbonic acid (H2CO3) as the weak acid, as follows. The reaction is greatly accelerated by carbonic anhydrase:
 (19)
(19)Thus, if acidosis develops, the entire reaction proceeds rightward, removing H+ ions, raising pH, and producing more CO2 that can (usually) be easily eliminated by a (usually) modest increase in ventilation. Conversely, should alkalosis develop, the reaction proceeds leftward, liberating H+ ions to restore pH. The source of the CO2 necessary to “feed” this backward reaction is a reduction in ventilation. In sum, changes in ventilation affect changes in PCO2, which then cause the chemical reaction in Equation 19 to proceed rightward when there is acidosis (increased ventilation and lowering PCO2) or leftward when there is alkalosis (lowering ventilation and raising PCO2).
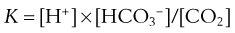
By writing the equilibrium version of Equation 19, the concentrations of H+, HCO3−, and CO2 can be related as follows:
 (20)
(20)


where pK is the negative logarithm of the equilibrium constant for the reaction in Equation 19 and equals 6.1. This equation is known as the Henderson-Hasselbalch equation and is widely used in describing acid-base disturbances. As can be seen, it relates pH to [HCO3−] and PCO2.
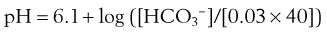 (24)
(24)In this way, the value of [HCO3−] for any given pH can be calculated, forming a single line on which each point satisfies Equation 24 for the same value of PCO2—in this example, 40 mm Hg. Figure 5-8 shows this line on a Davenport diagram for a PCO2 of 40 mm Hg and also for several other fixed PCO2 values, as indicated. This set of PCO2 isopleths then forms the framework for considering acid-base relationships, both normal and abnormal. The value in normal arterial blood is shown in this figure by the solid circle located at PCO2 of 40 mm Hg, pH of 7.40, and [HCO3−] of 24 mmol/L.
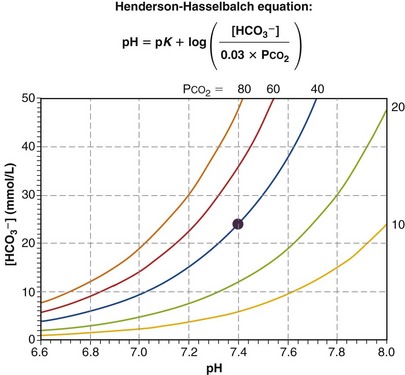
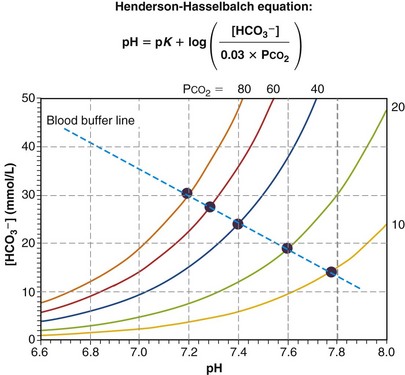
Figure 5-9 plots as a series of solid circles the relationship between pH and [HCO3−] when the same normal blood sample is exposed to and equilibrated with gases of different PCO2 values (one at a time), after which pH and [HCO3−] are measured. From Equation 23, the Henderson-Hasselbalch equation, it is evident that as the applied PCO2 is raised above normal, pH must fall to below normal, and as PCO2 falls below normal, pH rises above normal, as shown. The pH/[HCO3−] relationship turns out to be almost straight, as the figure indicates. The steeper the line, the less is the change in pH for a given PCO2. That is, the steeper the line, the more effectively [H+] is kept from changing. Because these results pertain to a single blood sample in vitro, no renal intervention is possible, and the line can be said to represent the buffering ability of the blood sample. Indeed, it is called the blood buffer line. The higher the plasma and red cell buffer levels, the steeper will be the buffer line.
Use of the Davenport diagram to describe acid-base disturbances is illustrated in Figures 5-10 through 5-13. Each figure depicts the consequences of one of the four possible types of acid-base disturbance—respiratory acidosis, respiratory alkalosis, metabolic acidosis, and metabolic alkalosis. In each, the CO2 isopleths and normal blood buffer line are shown, along with the normal point, N. These diagrams often are very useful at the bedside because they allow the caregiver to visually assess, diagnose, understand, and quantify the sometimes complex acid-base states encountered in clinical practice.
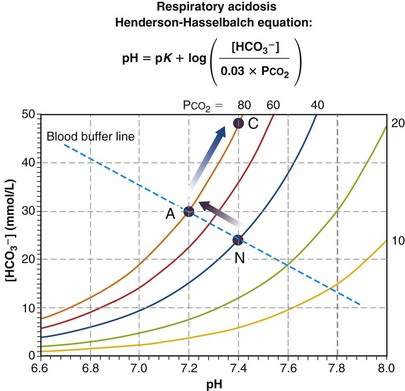
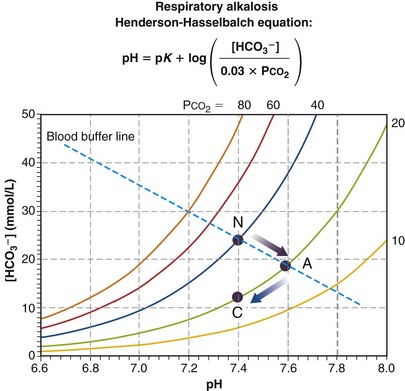
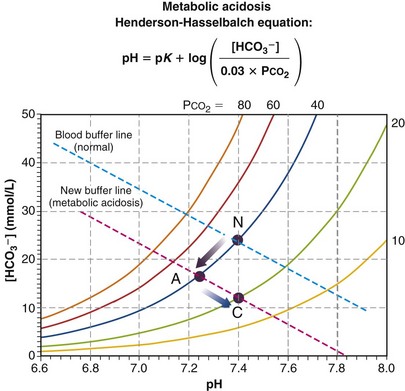
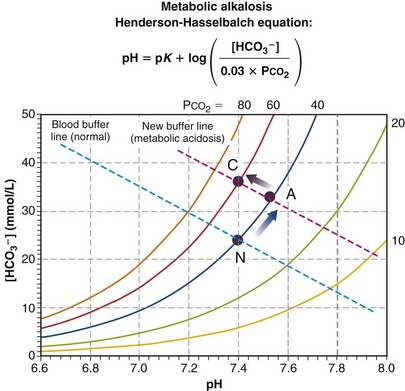
Figure 5-10 presents a Davenport diagram for respiratory acidosis. As the name implies, it is the result of insufficient ventilation to keep PCO2 normal at 40 mm Hg for the given rate of metabolic production of CO2. It is the necessary consequence of mass conservation as expressed in Equation 4. From the Henderson-Hasselbalch equation, a rise in PCO2 due to insufficient ventilation causes a fall in pH. When changes in ventilation or metabolic rate occur rapidly (minutes), the movement of PCO2 is along the blood buffer line (from N to A in the particular example in Figure 5-10), because the kidneys have not had time to affect pH. This early situation is called acute respiratory acidosis. How far up the buffer line the value moves will depend on the degree to which ventilation is insufficient to maintain PCO2. In the example of Figure 5-10, the point has moved from the PCO2 = 40 mm Hg isopleth to the PCO2 = 80 mm Hg isopleth. Using Equation 4, it becomes evident that doubling PCO2 from 40 to 80 mm Hg must have happened because either ventilation was, for some reason, cut in half while maintaining metabolic rate or metabolic rate doubled while ventilation did not change (or a combination of these two). If the acute respiratory acidosis is not treated but persists, the kidneys will start to retain HCO3−, excreting acid until after a day or so, the pH, from Equation 23, is (almost) restored to normal (point C in Figure 5-10). The situation is now termed compensated respiratory acidosis. As can be seen from Figure 5-10 and the Henderson-Hasselbalch equation, doubling [HCO3−] will return the ratio of [HCO3−] to PCO2 to normal, and therefore also restore pH to 7.40. In real life, renal compensation (as this process is called) is rarely complete, and so as long as PCO2 remains elevated (in this example, at 80 mm Hg), the point labeled C will be at a lower pH and lower [HCO3−] than depicted but must still lie on the isopleth for PCO2 = 80 mm Hg.
Figure 5-11 depicts the mechanism of respiratory alkalosis, which is the exact mirror image of respiratory acidosis as just described. It occurs when ventilation is increased in relation to metabolic rate, lowering both PCO2 and lowering [HCO3−], and increasing pH. Acute (point A, no renal compensation due to short duration) and fully renally compensated (C) points are indicated along with the normal (N) values. Again, complete compensation usually is not seen, so that point C is a little above and to the right of where it is shown in Figure 5-11 (but still on the same isopleth for CO2).
Figure 5-12 depicts the third type of acid-base disturbance, called metabolic acidosis. In contrast with respiratory acidosis (in which the high PCO2 was the primary disturbance, which then led to a lower pH), metabolic acidosis achieves a low pH through generation of protons from some metabolic or external source. Referring to the Henderson-Hasselbalch equation, addition of protons must reduce [HCO3−] as they combine with HCO3− to produce H2CO3. Although the chemoreceptors will react to the low pH rapidly (seconds), thus raising ventilation, it is useful to depict what would happen before that compensatory action takes place. In Figure 5-12, point A represents acute respiratory acidosis without change in ventilation (or, therefore, in PCO2). The more severe the disturbance, the further down and to the left will be point A, but before ventilatory compensation, it must lie on the normal PCO2 = 40 isopleth. Point C shows normalization of pH, achieved by hyperventilation, which lowers PCO2 and allows pH to be restored. This is called respiratory compensation and usually is also incomplete.
In contrast with respiratory acidosis, the data point (A) lies well off (i.e., below) the normal blood buffer line, even before compensation, as Figure 5-12 shows. The vertical drop between the two essentially parallel buffer lines (in this instance, about 11 units) is termed the base deficit. It signifies how much base must be added to the blood to fully compensate for the acidosis and restore pH—in this case, 11 mmol of base/L of blood.
Finally, Figure 5-13 depicts the mirror image of metabolic acidosis: metabolic alkalosis. The acute response is an increase in pH and [HCO3−], from point N to A. Depression of ventilation may ensue, causing PCO2 to rise and pH to normalize. This is a much weaker response than the converse (i.e., hyperventilation in acidosis), but if it occurs, normalization to point C results if compensation is complete.
Controversies and Pitfalls
Other pitfalls are conceptual. Clinicians understandably desire to simplify gas exchange tests by assuming values for key variables that are hard to measure. Important here is the respiratory exchange ratio (R), which is necessary in calculation of the alveolar-arterial PO2 difference (PO2(A−a); see Equation 12). Uncertainty in R can cause substantial errors in PO2(A−a). Furthermore, with its basis in mass conservation principles, appropriate use of this equation is limited to the steady state. If the patient’s gas exchange condition is not in a steady state but rather actively in flux, PO2(A−a) is likely to be uninterpretable.
Similarly, the shunt equation (Equation 14) requires knowledge of mixed venous (i.e., pulmonary arterial) O2 concentration, CvO2. Without a direct measurement of this entity using a pulmonary arterial catheter, the value of CvO2 must be assumed, and especially in critically ill patients, this is problematic, causing potentially large errors in calculated shunt. However, using the Fick principle (see Equation 8), CvO2 can be calculated if  (oxygen uptake),
  (cardiac output), and CaO2 (arterial oxygen concentration) all are measured, considerably improving the reliability of the calculated shunt value.
Davenport HW. The ABC of acid-base chemistry: the elements of physiological blood-gas chemistry for medical students and physicians. Chicago: University of Chicago Press; 1974.
Kelman GR. Computer program for the production of O2-CO2 diagrams. Respir Physiol. 1968;4:260–269.
Olszowka AJ, Farhi LE. A digital computer program for constructing ventilation-perfusion lines. J Appl Physiol. 1969;26:141–146.
Rahn H. A concept of mean alveolar air and the ventilation-blood flow relationships during pulmonary gas exchange. Am J Physiol. 1949;158:21–30.
Rahn H, Fenn WO. A graphical analysis of the respiratory gas exchange. Washington, DC: American Physiological Society; 1955.
Riley RL, Cournand A. “Ideal” alveolar air and the analysis of ventilation-perfusion relationships in the lungs. J Appl Physiol. 1949;1:825–847.
Weibel ER. Morphometry of the human lung. Heidelberg: Springer; 1963.
Weibel ER, Gil J. Structure-function relationships at the alveolar level. In: West JB, ed. Bioengineering aspects of the lung. New York: Marcel Dekker; 1977:2–81.
West JB. Causes and compensations for hypoxemia and hypercapnia. Comp Physiol. 2011;1:1541–1553.
West JB. Respiratory physiology: the essentials, ed 8. Baltimore: Williams & Wilkins; 2008.
West JB. Ventilation-perfusion inequality and overall gas exchange in computer models of the lung. Respir Physiol. 1969;7:88–110.
West JB. Ventilation/bloodflow and gas exchange, ed 5. Philadelphia: Lippincott; 1990.
[/level-membership-for-pulmolory-and-respiratory-category][not-level-membership-for-pulmolory-and-respiratory-category]
Chapter 5 Gas Exchange
The Basis of Gas Exchange: Ventilation, Diffusion, and Perfusion
Challenges to Lung Function Caused by its Structure
Inequality of ventilation and blood flow: Because the lungs are ventilated through a single main airway (trachea), yet air must reach all 300 million alveoli, there must be a substantial branching airway system. Indeed, some 23 orders of largely dichotomous branching are recognized, resulting in a very large number of very small airways arranged in parallel with each other—much like tree branches emanating and serially dividing from a single trunk. It is impossible to imagine that inhaled air can be distributed homogeneously to all 300 million alveoli, and nonuniform ventilation distribution is well known to occur. Similarly, blood flow reaches the lungs from the main pulmonary artery by a corresponding branching system, and it also is known that perfusion is nonuniform. Nonuniform distribution of ventilation and blood flow are important for gas exchange efficiency as will be shown later.
Wasted ventilation (dead space): The first 17 or so generations of the airways are conducting airways—plumbing whose walls are unable to perform any gas exchange. Their total volume is about 150 mL. This means that with every single breath, 150 mL of inhaled air never reaches the alveoli yet must be moved by muscle contraction. Normally, each breath is about 500 mL in total volume, so about 30% of each breath represents wasted effort. This is not important in health, but in some lung diseases, the effort of breathing is so high that this wasted ventilation, called dead space, leads to insufficient ventilation of fresh gas to the alveoli.
Alveolar collapse: A very large number of very small collapsible structures is potentially physically unstable, due to surface tension forces. The laws of physics show that the pressure inside a soap bubble caused by surface tension is inversely proportional to the bubble radius. To the extent that the soap bubble analogy applies to the alveoli, which simply are not all exactly equal in size, surface tension forces will therefore tend to empty small alveoli into larger alveoli. Unchecked, this progression would lead to massive alveolar collapse with loss of gas exchange surface area and could prove fatal. In fact, the neonatal respiratory distress syndrome is considered to represent an example of just this phenomenon. The body has solved this problem by generating, in normal full-term newborns, a surfactant that lines each alveolus. It reduces surface tension by about an order of magnitude, greatly mitigating the risk of alveolar collapse. What also helps prevent collapse is the aforementioned interdependence whereby adjacent alveoli share common alveolar walls, creating a mesh or network that is inherently self-stabilizing.
Particle deposition: An array of about 20 orders of dichotomous branching leads to a very large (220 in this case) number of small peripheral airways. Although individually each is very small, there are so many of them that their total cross-sectional area becomes very large. With this arrangement, the forward velocity of the air in each small airway is reduced as air is inhaled, which in turn increases the chance that an inhaled dust (or other) particle will settle out and deposit on the small airway wall (compared with larger, more proximal airways, in which the velocity of air flow is much greater). If such a particle is physically, chemically, or biologically dangerous, disease may result, often starting in those small peripheral airways—as is the case for emphysema caused by inhalation of tobacco smoke.
Airway obstruction by mucus: Although the airways have developed a sophisticated particle clearance mechanism using mucociliary transport, the mucus that traps the particles may itself occlude small airways, impairing distal ventilation of the alveoli.
Capillary stress failure: The pulmonary microcirculation is at risk from the inherent structure of the lungs. With capillaries poorly supported in very thin alveolar walls (good for diffusion), they risk rupture into the alveolar space when intravascular pressures rise even modestly. Such alveolar hemorrhage occurs in several conditions, and especially in racehorses, whose lungs are relatively small, leading to high vascular pressures, which in this setting can be fatal.
Pulmonary hypertension: Because all of the cardiac output has to pass through the lungs (compare the systemic circulation, for which flow is divided among all of the body’s other tissues and organs), the potential for high vascular pressures is considerable. The twin processes of capillary distention and recruitment mitigate increases in pressure when perfusion is increased, as in exercise.
Gas Exchange in the Homogeneous Lung: Ventilation, Diffusion, and Perfusion
Ventilation
where is the volume of O2 taken up into the blood per minute, and is the minute ventilation, both expressed in L/minute. FIO2 and FEO2 are, respectively, the inhaled and exhaled mean O2 fractional concentrations. commonly is about 7 L/minute. Because about 21 of every 100 molecules in air are O2 molecules (the rest being mostly nitrogen), FIO2 is 0.21. FEO2 at rest is about 0.17; this difference shows that is about 0.3 L/minute. Because the conducting airways that feed the alveoli do not exchange O2 or CO2, it has become conventional to subtract the volume of gas left in the conducting airways each breath—the so-called anatomic dead space—from the total breath volume before multiplying by respiratory frequency to calculate ventilation, resulting in a variable known as alveolar ventilation (). Equation 1 then becomes
The tendency is to use partial pressure (PIO2, inhaled; PAO2, alveolar) rather than fractional concentration (FIO2, FAO2) in describing these relationships: From Dalton’s law of partial pressure, PO2 = FO2 × (barometric pressure − water vapor pressure). Allowing for proper units, Equation 2 can then be rewritten as
is now expressed in mL/minute, in L/minute, and P in mm Hg.
is the whole-body metabolic rate and as such is dictated by the body tissues, not the lungs. Because PIO2 is a constant, Equation 2 can be used to demonstrate the dependence of alveolar PO2 on alveolar ventilation for a given value of (Figure 5-1). The same concepts apply to CO2, for which it is simpler, because CO2 is essentially absent from inhaled air. The corresponding equation is
How ventilation affects PACO2 also is shown in Figure 5-1. It is evident that a relatively small reduction in ventilation will reduce PAO2 and increase PACO2—both substantially.
Dividing Equation 4 by Equation 3 gives
which can be rearranged into what is called the alveolar gas equation:
Diffusion
The laws of diffusion dictate that the rate at which a gas diffuses between two points is the product of the diffusion coefficient for the gas and the partial pressure difference between the two points. In the lungs, the diffusion coefficient, measured as the diffusing capacity, is determined by surface area and distance of the diffusion pathway (see earlier). When a red cell leaves the pulmonary arteries and enters the pulmonary capillary, it arrives with a reduced level of O2, because the tissues visited by that red cell took O2 from the red cell for the tissue’s metabolic needs. The PO2 in the red cell in this blood commonly is about 40 mm Hg. Alveolar PO2, on the other hand, usually is about 100 mm Hg. The large PO2 difference (“driving gradient”) of 60 mm Hg leads to rapid diffusion of O2 from the alveolar gas into the capillary blood. Consequently, however, the blood PO2 increases, reducing the driving gradient, and O2 diffusion slows down as the red cell progresses along the lung capillary network. With modeling of this process, again using mass conservation principles, PO2 is seen to rise approximately exponentially as the red cell moves along the lung capillary until PO2 in the red cell has reached the alveolar value, indicating that diffusion equilibration has occurred. This process is shown in Figure 5-2. Note that for O2, equilibration occurred in about 0.25 second. On average, each red cell takes about 0.75 second to move through the alveolar capillary system, so that diffusion equilibration is complete already a third of the way along the capillary, and thus well before its end. As might be expected, during exercise, time available for a red cell to pick up O2 in the lung is reduced, because blood flow rate is increased, and at very high exercise intensity, there may not be sufficient time for PO2 in the red cell to reach the alveolar value. Accordingly, PO2 in the systemic arterial blood will be lower than that in the alveolus—a situation referred to as hypoxemia caused by diffusion limitation. This effect is seen commonly in exceptional athletes exercising heavily at sea level, and in all subjects exercising at altitude.
While CO2 moves from blood to gas, the principle is the same as for O2. Here, the red cell enters the alveolar capillary with a high PCO2 (because of addition of waste CO2 from tissues visited by the red cell), whereas alveolar PCO2 is lower. Thus, diffusion will move CO2 from red cell to alveolar gas, and red cell PCO2 will fall toward the alveolar value in mirror image to the rise in PO2 described earlier (see Figure 5-2). The speed of equilibration for CO2 is about twice that for O2, so it takes about half the time to reach equilibration. In practice, CO2 is never diffusion-limited. Gases carried in blood only in physical solution (i.e., inert and anesthetic gases) equilibrate even faster—about 10 times as quickly as for O2 (see Figure 5-2). This rule holds true for gases of any solubility.
Gas Exchange
Focusing on O2, Equations 3 and 8 should now be considered together. They both embody mass conservation but express it differently, with Equation 3 reflecting alveolar loss of O2 into blood and Equation 8, red cell gain of O2 into blood. Figure 5-3 shows how, for given constant values of and , and for designated values of inspired PO2 (PIO2) and inflowing pulmonary arterial O2 concentration (CvO2), would have to vary with alveolar PO2 (to satisfy both these equations) when determined by each of the two equations independently. Because each molecule of O2 that leaves the alveolus by crossing the blood gas barrier appears in the capillary blood, the calculated from the two equations must be the same—again, conservation of mass. Thus, only a single value of PAO2 can exist—that at the point of intersection of the two relationships in Figure 5-3. If the calculations in Figure 5-3 were repeated for different values of , and thus (in this example, keeping the same), the lines and their point of intersection would change as in Figure 5-4. This figure shows that alveolar PO2 (x axis) and the amount of O2 that can be taken up (, y axis) both depend on and . Commonly, Equations 3 and 8 are combined, because must be the same when calculated from either equation. This yields the ventilation-perfusion equation:
