Chapter 13 Fundamentals of Cardiac Stimulation
Intracellular Stimulation
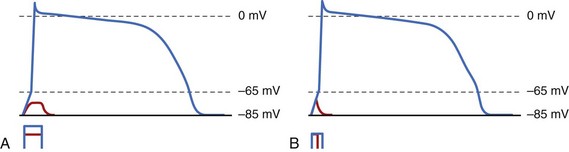
The situation gets slightly more complex because of membrane capacitance. Membrane capacitance does not allow the voltage to change instantaneously across the membrane when the stimulus is applied. Charge must be deposited on the membrane to cause a change in Vm. Building this charge takes time, since charge is the product of the stimulation current and its duration. If an applied stimulation pulse fails to excite the cell, it is because the membrane did not reach Vt, so it is necessary to increase the stimulation current, stimulation duration, or both. The relationship between the strength of the stimulus and its duration necessary to initiate excitation is referred to as the strength/duration curve. Irrespective of the duration, the stimulus current must always be greater than the rheobase, since that is the minimum current required to reach Vt across membrane resistance. At shorter durations, more stimulus current is required. Figure 13-1, A, shows the effect of different stimulation currents on the potential Vm of a single cell. Initially, as the current is applied, membrane voltage rises because of membrane capacitance. In the lower trace, Vm reaches a maximum value that is below Vt; then, once the current is discontinued, it goes back to the resting membrane potential (MP). In the upper trace, however, the stimulus current is sufficient to increase membrane voltage above Vt (65 mV in this case), which activates the Na+ channels and initiates the action potential. At a constant stimulus amplitude (see Figure 13-1, B), when the stimulus is turned off very quickly after a very short duration, the threshold Vt is not reached because of membrane capacitance, and the cell does not elicit an action potential. When the duration is increased, Vm continues to increase until it reaches the threshold potential Vt, eliciting an action potential. It is this property of cell capacitance that gives rise to a relationship between duration of the stimulus and the amplitude required to elicit excitation (strength-duration curve, as in Figure 13-2). Also, this type of excitation occurs after the stimulus is turned “on” and before it is turned “off” and is referred to as make excitation.
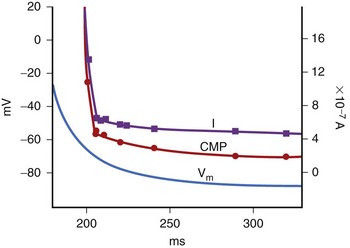
It is important to note that the threshold voltage Vt at which excitation occurs is not constant but depends on the extent of cellular repolarization from the previous action potential at the time the stimulus is applied. This is because the Na+ channels must reset to their resting state, and this only happens after repolarization is complete. For coupling intervals closer to the repolarization phase (earlier in the cardiac cycle), the threshold voltage Vt increases, thereby increasing the stimulus (either current or duration) needed to initiate excitation. With a depolarizing stimulus (one that reduces Vm), the threshold for excitation is lowest in diastole and increases as the stimulus approaches systole. The threshold voltage Vt (termed critical membrane potential [CMP]; Figure 13-3) and the transmembrane current required to excite cells with intracellular stimulation at various intervals in the cardiac cycle were measured by Hoshi et al in canine Purkinje fibers.1 Figure 13-3 shows that the CMP was between 60 and 65 mV and relatively constant throughout the diastolic phase and the terminal phase of repolarization of the MP. In the rapid phase of repolarization, the CMP increased sharply and so did the current threshold. This results in a hyperbolic curve that describes the relationship between the current threshold for excitation and the time delay from the onset of the action potential of a depolarizing stimulus. This curve is referred to as the intracellular strength/interval curve and has a shape very similar to the strength/interval curve with an extracellular electrode that results in tissue excitation caused by depolarization (Figure 13-4).
The second type of excitation occurs when the cardiac cell is hyperpolarized (made more negative than the resting potential) to a critical value after the stimulus is turned off. This is called break excitation. It was initially observed in nerve fibers and associated with the termination of a hyperpolarizing pulse.2 Using optical mapping techniques, Wikswo et al3 were also able to demonstrate that the break excitation occurred in cardiac tissue after the end of the stimulus from the region that was hyperpolarized. During the hyperpolarized state, the tissue is inexcitable because its Na+ channels are inactivated, and excitation is observed only after the hyperpolarizing stimulus is turned off. There is no consensus on the mechanism responsible for break excitation. Two concepts have been proposed: (1) In the mechanism proposed by Roth et al, break excitation from the hyperpolarized region occurs only when adjacent depolarized areas are present and does not occur in tissue that is uniformly hyperpolarized.4 At the end of the stimulus, current diffuses from the depolarized areas to the hyperpolarized areas to initiate excitation. This hypothesis suggests that break excitation is a result of the syncytial properties of the tissue and not a property of the cell membrane alone. (2) Computer simulation conducted by other investigators indicated that break excitation in the hyperpolarized tissue may be possible by itself without the diffusion of current from adjacent tissue.5 This controversy has not yet been resolved.
Extracellular Stimulation
Electrical Stimulus
In individual cardiac cells, a minimum threshold current is required to cause excitation. Decades of experimental observations with extracellular electrodes demonstrate the same behavior in cardiac tissue. Stimulus strength may be measured as a voltage or current amplitude. The current threshold is a more physiological measurement of excitation, since it is independent of the resistance of the electrode or the tissue. If the resistance is high, the voltage threshold will increase, as it is equal to the current threshold times the resistance of the tissue. The current density (current per unit area) is an even more accurate determinant of the basic requirement for excitation. It is postulated that in order to elicit excitation, a certain minimum number of cells (a “critical mass”) must be excited. Since the heart is a syncytium, that is, an aggregate of interconnected cardiac cells, once this critical volume of cells is excited, the conduction propagates to the rest of the heart. Therefore, a minimum amount of current per unit area must exist in order to excite this aggregate of cardiac cells. This is called current density threshold. The current density required for cardiac excitation is typically between 2 and 2.5 mA/cm2 at the electrode-tissue interface.6,7
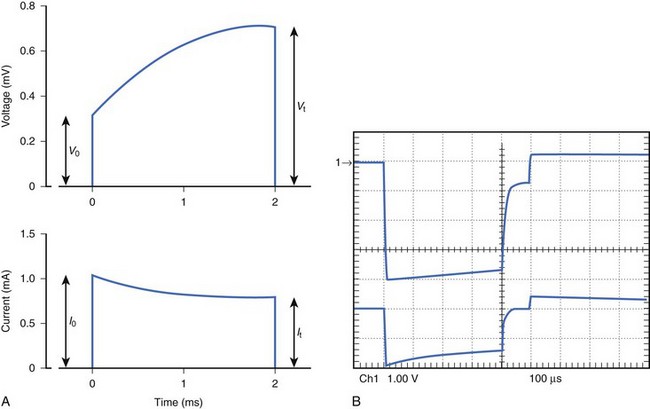
External cardiac stimulators are typically designed to provide an output pulse that maintains its voltage or current throughout the duration of the pulse and are referred to as constant voltage or constant current stimuli. Because of the polarization characteristics of the electrode-tissue interface (to be discussed later), resistance increases during the pulse and an increasing voltage is required to maintain the constant current stimulus. This results in a significant increase from Vo at the beginning of the stimulus to Vt at the end of the stimulus. Figure 13-5, A, illustrates a typical constant current stimulus, where the output current is approximately constant in amplitude from the onset to the offset of the stimulus. Physiological stimulators used in laboratories typically provide constant voltage or constant current stimuli, but these designs draw significant power. To reduce power drain and ensure safe operation in implantable pacemakers, the most efficient circuits use a capacitor. This can continuously draw current from a battery throughout the cardiac cycle and deliver a short stimulus (typically <2 ms) on demand. The result is that the stimulus from most implantable pacemakers has an exponentially decaying voltage profile, that is, a slight decrease occurs in voltage output from the beginning of the stimulus to the end of the stimulus (see Figure 13-5, B). The exponentially decaying voltage output results from a capacitor at the output of the pacemaker. The current waveform that is generated has an even higher rate of decay because of electrode polarization, which results in increasingly higher resistance during the pulse.
Electrode Terminology
Electrical stimulation must always be applied through electrode pairs so that current injected at one electrode returns to the stimulator through the other electrode. Figure 13-6 shows the commonly used electrode configurations. When one of the electrodes is located inside the heart and another is located away from the heart (e.g., on the skin surface or subcutaneously), this configuration is described as unipolar. The electrode in contact with (or closest to) the heart is called the stimulating electrode, and the electrode away from the heart is called the indifferent electrode. The indifferent electrode is usually quite large compared with the stimulating electrode to lower the resistance of the stimulation configuration. When the stimulating electrode is negative with respect to the indifferent electrode, the stimulation is called cathodal. When the stimulating electrode is positive, the stimulation is referred to as anodal.
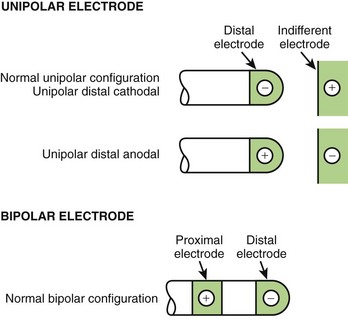
In most implanted systems, both electrodes are within the same chamber of the heart, usually separated by approximately 1 cm. This configuration is described as bipolar. In practice, the distal of the two electrodes, that is, “the tip,” is more likely to be in contact with tissue than is the more proximal electrode (see Figure 13-6).
Effect of Stimulus Duration (Strength/Duration Curve)
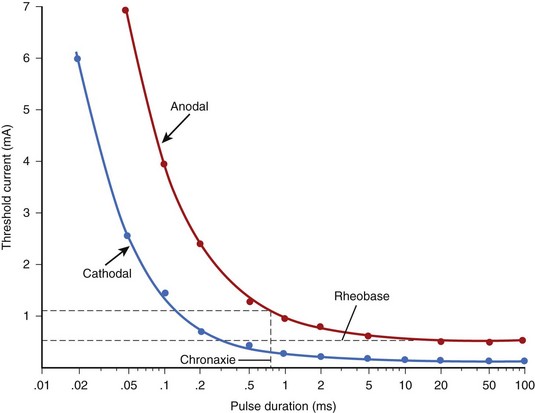
Experimental studies on extracellular stimulation indicate that it is much easier to excite tissue when the stimulus duration is long rather than short. This behavior is also observed during intracellular stimulation; its mechanism was discussed previously. The strength/duration curve is the relationship between the strength of the stimulus required to elicit excitation and the duration of the stimulus. With increasing duration, the thresholds always decrease. Figure 13-2 shows the cathodal and anodal strength duration curves measured in a canine ventricle. Both curves approach a minimum threshold at long pulse durations, although the anodal threshold is observed to be higher than the cathodal threshold. At very long durations, the current threshold reaches the minimum value, the rheobase, which is approximately 0.2 mA for the cathodal and 0.5 mA for an anodal stimulus (see Figure 13-2). As with single-cell stimulation, the rheobase is the minimum stimulus strength required for excitation. For stimulation intensity of twice the rheobase, the pulse duration required for excitation is called chronaxie. Chronaxie represents the “knee” of the strength/duration curve because the current threshold increases very rapidly for pulse durations shorter than chronaxie and decreases relatively slowly for pulse durations longer than chronaxie. In Figure 13-2, the chronaxie for anodal stimulation is about 0.75 ms.
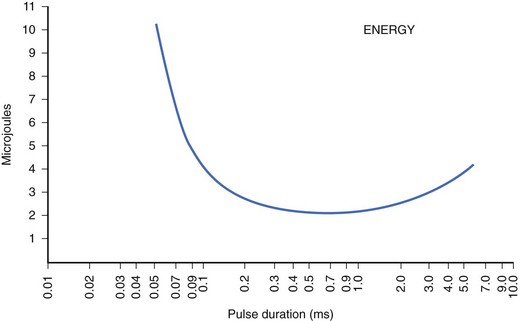
For an implantable device, consistent pacing must be maintained at minimum stimulus energy to maximize the longevity of the device. Optimization of electrode design and pulse duration can help minimize the dissipation of energy per pulse. The dissipated energy increases with the duration of the pulse, the resistance of the electrode, and the square of the stimulation current, Unlike the current strength/duration curves, the energy strength/duration curve typically has a U shape, which indicates a pulse duration at which the energy dissipated per pulse would be minimum (Figure 13-7). Pacing at this unique pulse duration can maximize device longevity. This duration is not always the same and will depend on the electrode material and its design.
Effect of Stimulus Timing (Strength/Interval Curve)
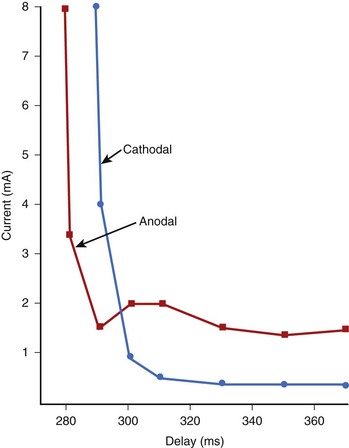
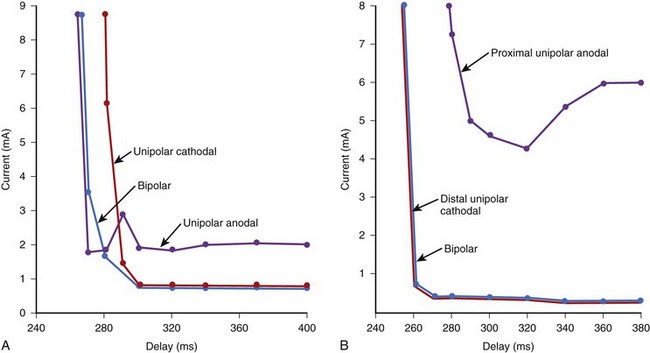
The stimulus threshold required at various intervals within the cardiac cycle is represented by the strength/interval curve. The threshold is lower during diastole and increases as the stimulus coupling is shortened and systole is approached. This indicates that it is more difficult to re-excite the cardiac tissue soon after it has been excited.8–10 As discussed previously, this behavior is caused by inactivation of Na+ channels early in the cardiac cycle. At a very short coupling interval, the tissue cannot be re-excited even with a large stimulus. Figure 13-4 shows a set of strength/interval curves that were determined in a patient with a constant current stimulus when the ventricle was paced at 90 beats/min. With a cathodal stimulus, the threshold is relatively low (0.4 mA) at intervals greater than 310 ms, that is, after the end of the T wave of the paced beat. The tissue cannot be re-excited any earlier than 288 ms even with an 8-mA stimulus, and this is its relative refractory period. The relative refractory period is a fundamental property of excitable tissue, and it determines the maximum rate at which it can be stimulated. When the polarity of the electrode is reversed to anodal, the shape of the strength/interval curve changes significantly. The anodal threshold is higher during diastole, but the relative refractory period is shorter. This implies that an anodal stimulus can initiate excitation earlier on the T wave than a cathodal stimulus. In Figure 13-4, with an 8-mA stimulus, the anodal refractory period is about 10 ms shorter than with a cathodal stimulus. Another key characteristic of the anodal strength/interval curve is that as the coupling interval of the stimulus is decreased, the threshold first increases, then decreases, and is followed again by a significant increase in threshold at the shortest coupling. This reduction in threshold at the short coupling interval of the stimulus is referred to as the anodal dip.
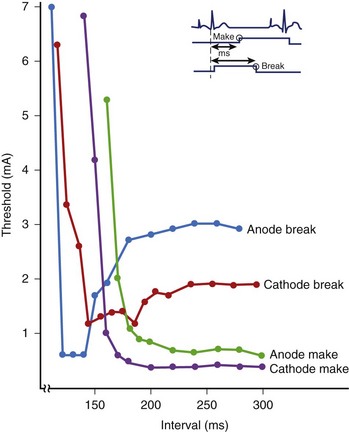
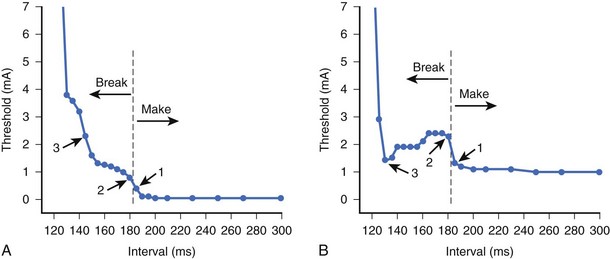
To understand the factors responsible for the shape of the anodal strength-interval curve, it is important to re-address the issue of “make” and “break” excitation. Break excitation was first demonstrated by Dekker et al11 in cardiac tissue. He measured the excitation thresholds during the make excitation (following the stimulus onset and before its termination) and the break excitation (following the end of the stimulus) of the pulses. He observed that these thresholds varied with the polarity of the stimulus as well as the timing of the stimulus within the cardiac cycle. The make and break thresholds were measured when anodal and cathodal stimuli were delivered through the epicardial electrodes of the canine ventricle. Figure 13-8 illustrates the make and break thresholds with long-duration stimuli. To measure the make excitation threshold, the stimulus was initiated at various intervals within the cardiac cycle. For break threshold measurements, the stimulus was initiated in the absolute refractory period and ended at different intervals within the cardiac cycle. Excitation was observed after the termination of the stimulus. The thresholds for break excitation had the characteristic anodal dip with higher thresholds during diastole and the make excitation thresholds had the characteristic hyperbolic shape. This suggests that during diastole, make excitation thresholds are lower and that the break thresholds are lower during the relative refractory period. Break excitation has also been observed experimentally with short-duration stimuli.3,12,13 Sidorov et al13 used optical mapping techniques to show that the transition of the stimulation mechanism from the make threshold to the break threshold always coincided with the final descending portion of both the anodal and the cathodal strength/interval curves (Figure 13-9).
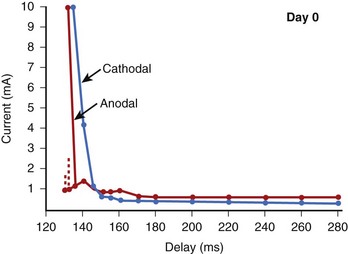
A very unusual property of anodal stimulation in the relative refractory period is the “no-response” phenomenon.14–16 Typically, the term threshold implies that any stimulus that is of greater magnitude would result in excitation of the tissue. Within the relative refractory period, when the current strength of an anodal stimulus is increased above threshold, excitation is initiated. Paradoxically, when the stimulus amplitude is increased further, the stimulus becomes ineffective and is no longer able to excite. For example, in the strength/interval curve of Figure 13-10, an anodal stimulus at 130-ms delay can initiate excitation only when its magnitude is between 1.0 and 1.7 mA. When the stimulus is increased further, excitation does not occur. This is called the no-response zone. At a much larger stimulus, excitation may again be re-established. The time interval in the relative refractory period during which this no-response phenomenon occurs is usually very short. Although this phenomenon has been observed in canine hearts, it has not been reported in the clinical literature.
With endocardial electrodes, the tip electrode will typically contact the myocardium and is made the cathode because of its lower threshold for excitation. The proximal electrode (the anode) may not always contact cardiac tissue. If it does, it could elicit an excitation, depending on the stimulus output and the anodal threshold. The bipolar excitation threshold at any time in the cardiac cycle is equal to the lower of the cathodal and anodal thresholds determined at the two electrode sites.6 Therefore the bipolar strength/interval curve follows the lower of the cathodal and anodal curves, as illustrated in Figure 13-11. This indicates that with a bipolar stimulus, excitation would arise from both electrode sites if the stimulus output were above the anodal and cathodal thresholds and selectively from one electrode if the stimulus output is in between the cathodal and anodal thresholds. For example, in Figure 13-11, A, a 2-mA stimulus at 380-ms coupling would excite only the tissue at the cathode, whereas a 7-mA stimulus would result in excitation from the cathode as well as from the anode.
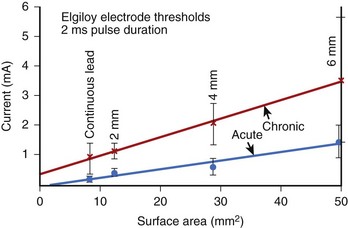
Effect of Electrode Size
Since a minimum current density is required for stimulation, the threshold of excitation is dependent on electrode size. Studies have demonstrated that during diastole, the current threshold for cardiac pacing is directly proportional to the electrode surface area ranging from about 10 to 50 mm2 (Figure 13-12). As indicated in Figure 13-12, smaller electrodes require less current for excitation. At the same time, the resistance of a smaller electrode is higher, since the resistance of a spherical electrode is inversely proportional to its radius. This gives rise to the question: Would the energy required for excitation increase or decrease with smaller size electrodes? The current required to stimulate tissue increases as does the area of the electrode (the square of the electrode radius), while the resistance is inversely proportional to the radius. Therefore, smaller electrodes require less energy for stimulation, as they save more energy in reduced current density than they lose in increased resistance. For this reason, the surface area of commercial implantable electrodes has become smaller over the years. Making the electrodes extremely small has some disadvantages. Extremely small electrodes are susceptible to being dislocated easily, and they also tend to show a greater increase in chronic thresholds caused by the formation of the fibrotic capsule.
Tissue Fibrosis
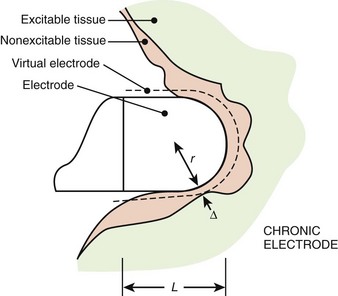
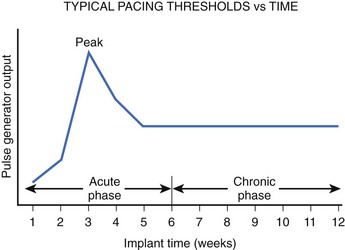
It has been observed that because of the trauma caused by the electrode, tissue damage and edema occur acutely, and this tissue becomes fibrotic over time (Figure 13-13).17,18 The fibrotic capsule increases the separation between the electrode and the excitable tissue and therefore decreases the current density (current per unit area) at the excitable tissue. As the electrode matures from acute to chronic, the radius of the virtual electrode increases from r to r + Δ, as illustrated in Figure 13-13. Therefore, a greater stimulus current is needed to reach the threshold current density in the excitable tissue. This increases the pacing thresholds after electrode implantation, as shown in Figure 13-14. A significant increase occurs in thresholds in the 4- to 8-week period; with increasing time, the size of this edematous capsule shrinks and is replaced by a fibrotic layer. This causes the excitation threshold to decrease again and stabilize chronically.
One of the major advances in electrode technology has been the development of electrodes that elute small quantities of the corticosteroid dexamethasone sodium phosphate.19 These steroid electrodes are characterized by a minimal change in threshold from implantation to a follow-up period of several years. The acute rise in stimulation threshold that occurs because of the formation of inflammation and edema adjacent to the pacing electrode is reduced dramatically. Although it has been hypothesized that the steroid reduces the size of the fibrotic layer and thus minimizes the rise in threshold, the exact mechanism by which steroid leads improve pacing efficiency is not well understood.
Electrode Polarization
For pacing efficiency to be high, minimal energy should be lost at the electrode-tissue interface, and all the energy of the stimulus should be dissipated in cardiac tissue. Unfortunately, energy is lost with most electrodes because of the electrochemical reactions at the electrode-tissue interface, which is referred to as polarization.20,21 In the electrode, the flow of current is caused by the movement of electrons, whereas in the tissue, it is caused by the movement of ions. The chemical reactions that occur at the electrode-tissue interface to convert electronic flow to ionic flow are complex and vary with the metal and electrode geometry being used. If the electrode was nonpolarizable, the voltage and current waveforms would be identical, and no energy would be wasted at the interface. Figure 13-5, A, illustrates a typical voltage waveform with a polarizable electrode when a constant current stimulus is applied. Initially, the voltage is low but increases because of increasing impedance as a result of polarization. The electrochemical reactions at the anode and the cathode are different. New materials that tend to reduce polarization have been developed. Among these are the porous and platinized electrodes, which have voltage or current characteristics that approach those of nonpolarizable electrodes.
Relationship Between Intracellular Stimulation and Extracellular Stimulation
Optical mapping of cardiac tissue was made possible by the incorporation of voltage-sensitive fluorescent dyes into cardiac membranes. These dyes, under external illumination, emit light at a wavelength that is proportional to the transmembrane voltage. It is therefore possible to produce two-dimensional transmembrane voltage maps of the region of cardiac tissue with high spatial resolution. Such apparatus can be configured to view millisecond-by-millisecond evolution of transmembrane voltages. Thus, one can create a “movie” of transmembrane changes as excitation is initiated and as it spreads. Several investigators have used this optical mapping technique to measure Vm around an extracellular unipolar electrode.3,12,22 Their key observation was that adjacent areas of hyperpolarization and depolarization are present, and this pattern has been referred to as the dog bone shape (Figure 13-15). For example, with cathodal stimulation (Figure 13-15, A), it was observed that the tissue directly underneath the electrode is depolarized and that it has a dog-bone shape with the long axis of the dog bone perpendicular to the axis of the fibers. In this axis, the tissue is only depolarized, and its amplitude decreases with increasing distance. However, in the axis parallel to the fibers, the tissue directly underneath the electrode is depolarized, but it changes polarity and is hyperpolarized about a millimeter away from the electrode, as illustrated by the blue image in Figure 13-15, A. If the polarity of the extracellular stimulus is reversed to an anodal stimulus, the shape of the dog bone remains quite similar with reversal of the hyperpolarized and depolarized regions (Figure 13-15, B).
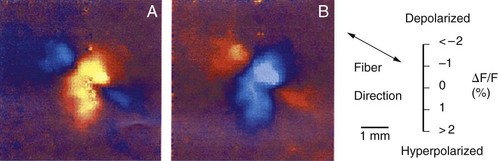
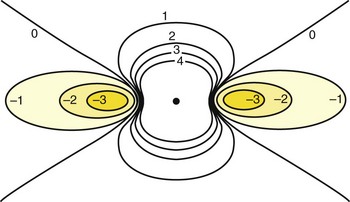
As strange as these observations appeared, computer simulations of cardiac tissue using the bi-domain model had already predicted them. In the bi-domain model, intracellular and extracellular spaces are considered to be two distinct domains and are separated by a high resistance. It is assumed that the intracellular space of each cell is coupled with its neighbors’ through low-resistance intracellular channels. Intracellular and extracellular spaces are also assumed to be anisotropic, that is, their electrical conductivity is different when it is measured parallel versus perpendicular to the orientation of the cells. Early theoretical work with bi-domain models assumed that anisotropic conductivity ratios for intracellular and extracellular spaces were equal. If equal anisotropic ratios are assumed for intracellular and extracellular spaces and an extracellular stimulus is applied from a point source, the shape of the Vm contours is ellipsoid, with the Vm decreasing with increasing distance.3 Therefore, all of the tissue would be either depolarized or hyperpolarized, but not both. This is incompatible with experimental observations, which demonstrated adjacent areas of depolarization and hyperpolarization during extracellular stimulation (see Figure 13-15). Recent simulations with the bi-domain model have assumed that intracellular and extracellular spaces are both anisotropic, but not to the same extent. The anisotropic conductivity ratio in the extracellular space is typically about 2 : 1, whereas it is 10 : 1 in the intracellular space. This property of cardiac tissue seems to be responsible for many of its interesting electrical features. With simulation of unequal anisotropic properties, adjacent areas of depolarization and hyperpolarization appear in a dog bone shape, very similar to experimental observations.3,23 Adjacent areas of depolarization and hyperpolarization are produced because the rate of change of the intracellular and extracellular potentials is nonuniform. The size and shape of the depolarized and hyperpolarized regions change with anisotropy ratios. This is demonstrated in the two-dimensional schematic presented in Figure 13-16. The dog bone shape represents the depolarized region, and the shaded area represents the hyperpolarized region. Depolarization occurs underneath the cathodic electrode, where the current enters a syncytium of cells, and hyperpolarization occurs where the current exits the cells. If the polarity of the stimulus were anodal, the dog bone region would be hyperpolarized, and depolarization would be observed in the adjacent region. These voltage nonuniformities can be further accentuated by electrical uncoupling of cells by ischemia, presence of fibrotic tissue, blood vessels, fiber curvature, and so on. All these variables can play a pivotal role in altering Vm potentials during extracellular stimulation.
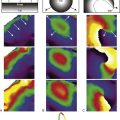
Apart from the shape of depolarized and hyperpolarized regions, optical mapping studies and the bi-domain model indicate where excitation is initiated with extracellular stimulation. Depending on which threshold is lower, make excitation can occur from the depolarized area or break excitation from the hyperpolarized area. For example, during cathodal stimulation, the region directly underneath the electrode is depolarized, and if it reaches the critical threshold, the excitation wavefront would be initiated. This is illustrated in the optical maps presented in Figure 13-17 and the schematic in Figure 13-18. During a cathodal stimulus of 10 mA, excitation is typically initiated from the depolarized dog-bone region (see Figures 13-17, A, and 13-18, A) following the make of the stimulus. If the stimulus were anodal, make excitation could occur in the depolarized region a few millimeters from the electrode, provided the make threshold is lower than the break threshold in the hyperpolarized region. In Figure 13-17, B, the make threshold is lower, and excitation occurs from the two yellow regions.
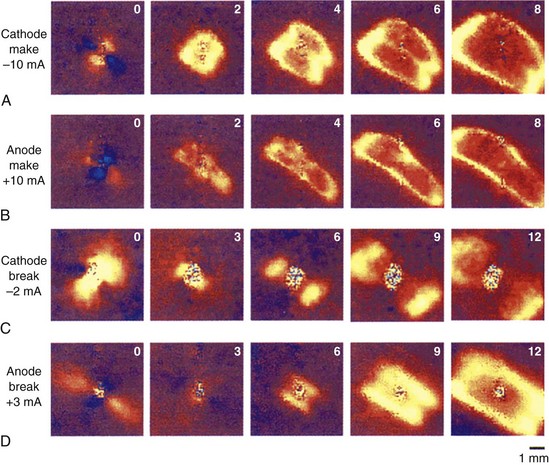
FIGURE 13-17 False-color images of the transmembrane potential associated with injection of current into fully repolarized excitable cardiac tissue. The number inside each frame is time in milliseconds. Upper two rows: A, Make excitation. Cathodal make excitation with 1-ms, 10-mA stimulus. B, 1-ms, 10-mA anodal make stimulation in the same heart. Lower two rows: C, Break stimulation; 180-ms, 2-mA cathodal break stimulation. D, Anodal break stimulation with a 3-mA, 150-ms long-duration stimulus. The direction of the epicardial fibers is from lower right to upper left. Color scale is the same as in Figure 13-15.
(From Wikswo J P, Lin SF, Abbas RA: Virtual electrodes in cardiac tissue: A common mechanism for anodal and cathodal stimulation, Biophys J 69: 2195–2210, 1995.)
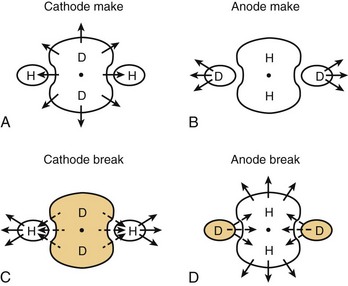
As discussed previously, excitation can also be initiated from the hyperpolarized region after the stimulus is turned off (break stimulation). Break excitation occurs from the hyperpolarized region. For example, during a cathodal pulse, the tissue under the electrode is depolarized, and the distal tissue is hyperpolarized (see Figures 13-17, C, and 13-18, C). If the stimulus amplitude is not enough to elicit make excitation from the depolarized regions, then after the end of the pulse, break excitation could begin from the hyperpolarized region, as shown in Figure 13-17, C. This will propagate rapidly along the fiber axis. In a similar manner, if the anodal make excitation does not occur from the depolarized region, break excitation will occur from the hyperpolarized regions, as illustrated in Figures 13-17, D, and 13-18, D.
The bi-domain model has been able to simulate the shape of the cathodal and anodal strength-interval curves, the presence of the anodal dip, the no-response phenomenon, and the ratio of anodal and cathodal thresholds with large surface area electrodes.24–26 The model predicts that with short-duration stimuli, the shape of the cathodal strength/interval curve is primarily determined by the make excitation of the depolarized tissue. However, with an anodal stimulus at long coupling intervals, stimulation occurs because of make excitation distal to the electrode, as it has the lowest threshold. At short coupling intervals, the break threshold in the hyperpolarized regions becomes lower and gives rise to the dip in the anodal strength-interval curve. These observations are very similar to the experimental observations illustrated in Figures 13-8 and 13-9. At any coupling interval within the cardiac cycle, the lower of the make or break thresholds determines the excitation threshold. For example, with an anodal stimulus, excitation would be caused by make excitation at long coupling and break excitation at shorter coupling.
In experimental clinical studies, the ratio of anodal and cathodal thresholds was observed to be 2.8 with acute electrodes and 1.5 with chronic electrodes.27 This has also been observed using the bi-domain model, which indicates that if the distance between the electrode and the excitable tissue is increased because of a perfusion bath or fibrotic tissue, the ratio of the excitation thresholds decreases.28 The amplitude of depolarization potential change induced by a cathodal stimulus is reduced dramatically close to the electrode, whereas with an anodal stimulus, the change in the depolarization potential farther away from the electrode is reduced much less. The ratio of maximum depolarization to maximum hyperpolarization also decreases with increasing electrode tissue separation, thus reducing the ratio of anodal and cathodal excitation thresholds.
1 Hoshi TM. Excitability cycle of cardiac muscle examined by intracellular stimulation. Jap J Physiol. 1962;12:433.
2 Frankenhaenser B, Widen L. Anode break excitation in desheathed frog nerve. J Physiol. 1956;131:243.
3 Wikswo JP, Lin SF, Abbas RA. Virtual electrodes in cardiac tissue: A common mechanism for anodal and cathodal stimulation. Biophys J. 1995;69:2195-2210.
4 Roth BJ. A mathematical model of make and break electrical stimulation of cardiac tissue by a unipolar anode or cathode. IEEE Trans Biomed Eng. 1995;42:1174-1184.
5 Ranjan A. A novel mechanism of anode-break stimulation predicted by bidomain modeling. Circ Res. 1999;84:153-156.
6 Furman S, Parker B, Escher DJW, Solomon N. Endocardial threshold of cardiac response as a function of electrode surface area. J Surg Res. 1968;8:161-166.
7 Irnich W. Engineering concepts of pacemaker electrodes. In: Schaldach M, Furman S, editors. Engineering in medicine I. Advances in pacemaker technology. New York and Heidelberg, Berlin: Springer-Verlag, 1975.
8 Brooks MCC, Hoffman BF, Suckling EE, et al. Excitability of the heart. New York and London: Grune and Stratton; 1955.
9 Van Dam RT, Durrer D, Strackee J, et al. The excitability cycle of the dog’s ventricle determined by anodal, cathodal and bipolar stimulation. Circ Res. 1956;4:196.
10 Mehra R, Furman S. Comparison of cathodal, anodal and bipolar strength-interval curves with temporary and permanent electrodes. Br Heart J. 1979;41:468-476.
11 Dekker E. Direct current make and break thresholds for pacemaker electrodes on the canine ventricle. Circ Res. 1970;27:811.
12 Knisley SB. Transmembrane voltage changes during unipolar stimulation of rabbit ventricle. Circ Res. 1995;77:1229-1239.
13 Sidorov VY, Woods MC, Baudenbacher P, Baudenbacher F. Examination of stimulation mechanism and strength-interval curve in cardiac tissue. Am J Physiol Heart Circ Physiol. 2005;289:H2602-H2615.
14 Brooks C, Orias O, Gilbert JL, et al. Excitability of the mammalian heart during the cardiac cycle: The auricle. Fed Proc. 1950;9:18.
15 Cranefield PF, Hoffman BF, Siebens AA. Anodal excitation of cardiac muscle. Am J Physiol. 1957;190:383.
16 Mehra R, McMullen M, Furman S. Time dependence of unipolar cathodal and anodal strength interval curves. PACE. 1980;3:526-530.
17 Beyersdorf F, Schneider M, Kreuzer J, et al. Studies of the tissue reaction induced by transvenous pacemaker electrodes. I. Microscopic examination of the extent of connective tissue around the electrode in the human heart ventricle. Pacing Clin Electrophysiol. 1988;11:1753-1759.
18 Kay G. Basic aspects of cardiac pacing. In: Ellenbogen K, editor. Cardiac pacing. Boston, MA: Blackwell Scientific Publications, 1992.
19 Stokes K, Graf J, Wiebusch W: Drug eluting electrodes improved pacemaker performance, New York, 1982, IEEE Engineering in Medicine and Biology Society.
20 Schwan H, Kay C, Bothwell T. Electrical resistivity of living body tissues at low frequencies. Proc Fed Biol Sci. 1954;13:1.
21 Mansfield PB. Myocardial stimulation: The electrochemistry of electrode-tissue coupling. Am J Physiol. 1967;212:1475.
22 Neunlist M, Tung L. Spatial distribution of cardiac transmembrane potentials around an extracellular electrode: Dependence of fiber orientation. Biophys J. 1995;68:2310-2322.
23 Sepulveda NG, Roth BJ, Wikswo JP. Current injection into a two-dimensional anisotropic bidomain. Biophys J. 1989;55:987-999.
24 Roth BJ. Strength-interval curves for cardiac tissue predicted using the Bidomain model. J Cardiovasc Electrophysiol. 1996;7:722.
25 Roth BJ. Nonsustained reentry following successive stimulation of cardiac tissue through a unipolar electrode. J Cardiovasc Electrophysiol. 1997;8:768.
26 Patel GP, Roth BJ. How electrode area affects the electric potential distribution in cardiac tissue. IEEE Trans Biomed Eng. 2000;47:1284-1287.
27 Mehra R. Myocardial vulnerability to arrhythmias with cathodal, anodal and bipolar stimulation [PhD Dissertation #75-21384; University Microfilms]. Ann Arbor, MI: University of Michigan; 1975.
28 Latimer DC, Roth BJ. Electrical stimulation of cardiac tissue by a bipolar electrode in a conductive bath. IEEE Trans Biomed Eng. 1998;45:1449-1458.
Key References
Brooks MCC, Hoffman BF, Suckling EE, et al. Excitability of the heart. New York and London: Grune and Stratton; 1955.
Cranefield PF, Hoffman BF, Siebens AA. Anodal excitation of cardiac muscle. Am J Physiol. 1957;190:383.
Dekker E. Direct current make and break thresholds for pacemaker electrodes on the canine ventricle. Circulation Res. 1970;27:811.
Furman S, Parker B, Escher DJW, Solomon N. Endocardial threshold of cardiac response as a function of electrode surface area. J Surg Res. 1968;8:161-166.
Hoshi TM. Excitability cycle of cardiac muscle examined by intracellular stimulation. Jap J Physiol. 1962;12:433.
Kay G. Basic aspects of cardiac pacing. In: Ellenbogen K, editor. Cardiac pacing. Boston, MA: Blackwell Scientific Publications, 1992.
Mansfield PB. Myocardial stimulation: The electrochemistry of electrode-tissue coupling. Am J Physiol. 1967;212:1475.
Mehra R, Furman S. Comparison of cathodal, anodal and bipolar strength-interval curves with temporary and permanent electrodes. Br Heart J. 1979;41:468-476.
Mehra R, McMullen M, Furman S. Time dependence of unipolar cathodal and anodal strength interval curves. PACE. 1980;3:526-530.
Roth BJ. A mathematical model of make and break electrical stimulation of cardiac tissue by a unipolar anode or cathode. IEEE Trans Biomed Eng. 1995;42:1174-1184.
Roth BJ. Strength-interval curves for cardiac tissue predicted using the bidomain model. J Cardiovasc Electrophysiol. 1996;7:722.
Sepulveda NG, Roth BJ, Wikswo JP. Current injection into a two-dimensional anisotropic bidomain. Biophys J. 1989;55:987-999.
Sidorov VY, Woods MC, Baudenbacher P, Baudenbacher F. Examination of stimulation mechanism and strength-interval curve in cardiac tissue. Am J Physiol Heart Circ Physiol. 2005;289:H2602-H2615.
Van Dam RT, Durrer D, Strackee J, et al. The excitability cycle of the dog’s ventricle determined by anodal, cathodal and bipolar stimulation. Circulation Res. 1956;4:196.
Wikswo JP, Lin SF, Abbas RA. Virtual electrodes in cardiac tissue: A common mechanism for anodal and cathodal stimulation. Biophys J. 1995;69:2195-2210.