[level-membership-for-critical-care-medicine-category]1
Fundamentals: Essential technology, concepts, and capability
“There is geometry in the humming of the strings . . . there is music in the spacing of the spheres”
Fundamentals: Principles, terms, and concepts
Ultrasound is a mechanical wave that requires a medium to travel (i.e., human tissue), with a frequency above the audible range ceiling of 20 kHz. Ultrasound systems are tomographic devices that transmit short pulses of ultrasound into the body and measure the round-trip time and intensity of each of the numerous echoes returning after the pulse. The time of arrival of an echo determines the distance from the transducer, that is, the location of its source in the body. The intensity of the echo is converted to brightness of a given point in the image. In other words, each pixel (element of the image) on the display device corresponds to a point inside the body, and its brightness depends on the strength of the echo that came from that location. Together, all pixels form a grayscale tomographic image. Parts of the image with mostly bright pixels (a brighter overall appearance) are termed hyperechoic, as opposed to hypoechoic (darker) areas. The relative ability of an organ or tissue to produce echoes is called echogenicity, that is, tissues or structures producing hyperechoic image are considered more echogenic.1–7 Parts of the image with only black pixels are called anechoic or echo-free and mostly correspond to homogenous liquids (e.g., blood, urine, effusion, cystic fluid).
Frequency (measured in cycles per second [hertz, Hz]) is the number of wave cycles in 1 second. Frequency is determined solely by the sound source and not by the medium. Frequencies used by general-purpose ultrasound machines range between 2 and 15 megahertz (MHz). Higher frequencies, up to 40 MHz, are used for intravascular and other catheter-based applications and in specialized ophthalmologic and dermatologic techniques. Propagation speed is the velocity of sound in a given medium and is determined solely by the characteristics of the medium, such as density and stiffness (does not depend on the source of sound or its frequency). Ultrasound travels through soft tissues at a speed of approximately 1.54 mm/μsec, or 1540 m/sec). The stiffer the tissue, the greater the propagation speed (Figure 1-1). Ultrasound waves are generated by piezoelectric crystals (e.g., lead zirconate titanate, or PZT) that convert electrical energy into mechanical energy and vice versa (see Figure 1-1). Electrical pulses or short bursts of alternating voltage stimulate crystals to produce ultrasound pulses in the medium, causing displacement and oscillation of its molecules. Pressure change–Velocity of such oscillations in response to sound pressure determines the acoustic impedance (lower velocities correspond to higher impedance). As ultrasound passes from one medium to another (e.g., from gas to liquid), an impedance gradient at the tissue boundary causes a part of the energy to form a reflected wave (echo) while the remainder of the energy proceeds into the second medium.1–7 Reflection occurs every time the ultrasound pulse encounters a new boundary (reflector). Specular (mirror-like) reflectors are smooth and flat boundaries larger than the pulse dimensions (e.g., diaphragm, walls of a major vessels). The echo reflection angle equals the angle of incidence; when the beam strikes a specular reflector at 90 degrees (normal incidence, Figure 1-2), a very strong echo travels back toward the source. Nonspecular reflection, or scattering, occurs when the incident beam strikes boundaries that have irregular surface or are smaller than the beam’s dimensions, resulting in the beam’s energy scattering in multiple different directions (see Figure 1-2). The beam travels around even smaller obstacles without scattering (diffraction). Because a higher frequency results in smaller beam dimensions, obstacles diffracting at lower frequencies act as scatterers at higher frequencies. This explains both higher imaging resolution and higher beam attenuation at higher frequencies. Refraction is the redirection of a beam when striking obliquely at a boundary between two media with different propagation speeds. Unlike reflection, refraction does not contribute to the image formation process but contributes to attenuation (see Figure 1-2). Part of the ultrasound beam’s energy is transferred to the medium in the form of heat. This is absorption, which also increases proportionally to frequency in soft tissues. The bones absorb ultrasound more intensely, together with other energy loss mechanisms, producing acoustic shadows behind them. Finally, part of the original beam is converted by tissues to waves with double or higher-order frequency (harmonic waves). The total propagation losses from the combined effects of scattering, refraction, and absorption are called attenuation, which is directly proportional to frequency. Body compartments with low attenuation that allow imaging deeper structures through them are good acoustic windows (e.g., liquid cavities), while those with high attenuation are acoustic barriers (e.g., bones). The near-total loss of ultrasound at boundaries between tissues and gas makes gas the strongest barrier; nevertheless, important lung ultrasound techniques rely on the abundant artifacts that the aerated lung creates.
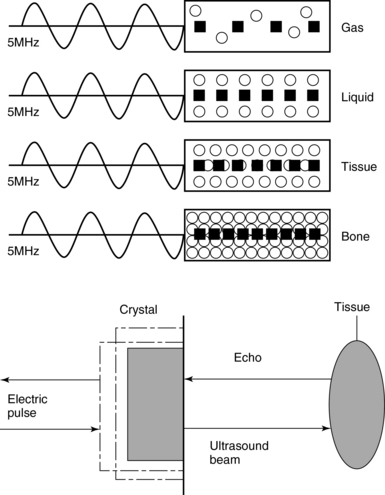
Figure 1-1 Propagation speed is different in different tissues (top); electrical impulses stimulate the lead zirconate titanate (PZT) crystal to produce a beam (bottom), while every time an echo is reflected back, the crystal deforms and vibrates, generating another impulse that is processed into an image.
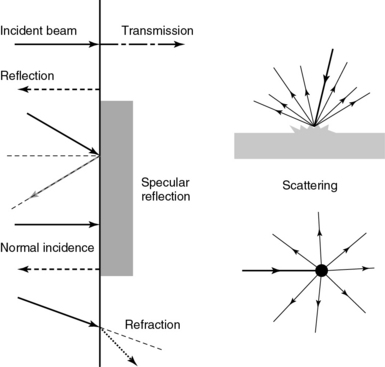
Figure 1-2 Left panel, Reflection (top), specular reflection (middle), and refraction (bottom) of the incident beam. Right panel, Scattering occurs when the incident beam strikes boundaries that are irregular in shape (top) or smaller than the beam’s dimensions (bottom), resulting in the beam’s energy scattering in multiple different directions.
Equipment and imaging modes
Equipment
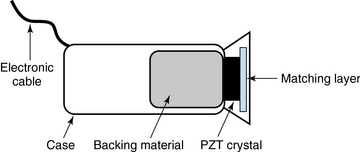
Ultrasound machines consist of electric pulse generators, transducers, systems for processing received echoes, and image display screens. Modern systems use digital technology and have central processing units running advanced software that forms beams and processes echoes and thereafter stores images. The key elements of transducers (probes) are PZT crystals, matching layers, backing material, cases, and electrical cables (Figure 1 E-1). Modern electronic transducers generate a range of frequencies (bandwidth) around the central frequency, and contain multiple crystal elements (arrays). This permits them to display the sequence of two-dimensional (2D) images so rapidly that motion is displayed as it actually occurs (real-time scanning). Main transducer types are phased array (sector), linear array, and curved array (Figure 1-3). Sector (phased array) transducers (2 to 4 MHz) have small footprints that produce images of sector format through small acoustic windows (e.g., cardiac and cranial applications). Linear array transducers (7 to 15 MHz) provide images in rectangular or trapezoidal format. They feature high resolution and shallow depth of view because their penetration into deeper structures is limited. Convex (curved array, curvilinear) transducers (2 to 6 MHz) of different shapes and sizes produce images in a sector-shaped format with a wide apex. Microconvex transducers (3 to 8 MHz) feature small footprints and are useful in difficult-access areas, such as the neonatal brain. Transducers generating frequencies of 2.5 to 5 MHz feature a larger curvature radius and are used for abdominal imaging. A variety of convex arrays operating at higher frequencies are used in intracavitary and transesophageal scanning. Finally, transducers with frequencies up to 50 MHz are used for endovascular applications and ultrasound biomicroscopy.1–7
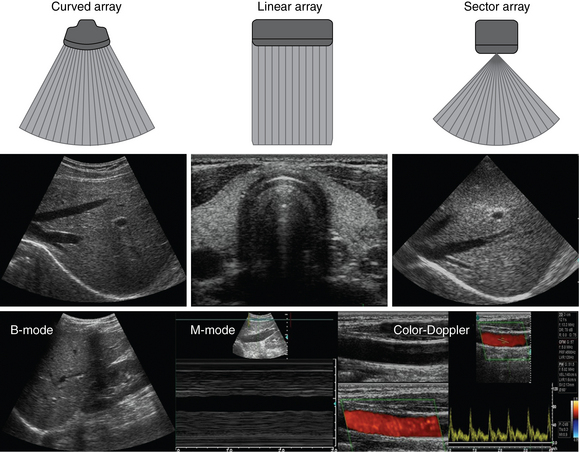
Figure 1-3 Main types of transducers and formats of their produced images (top and middle); basic imaging modes (bottom).
Notwithstanding the similarities of all general-purpose ultrasound systems, it is critical for every user to be especially familiar with a specific machine’s features, transducer choices, and controls in advance and to practice with it sufficiently in nonemergency settings. Attempting to navigate screens or modes while resuscitating a critically ill patient can be a frustrating process. A demonstration of a common ultrasound machine and its essential controls is provided in Video 1-1. The ability to switch transducers between imaging applications or their components helps optimize image acquisition; even seemingly simple examinations, such as the extended Focused Assessment by Sonography for Trauma (e-FAST) evaluation, may require a transducer change, as well as the use of depth and gain adjustment and image optimization techniques. An e-FAST examination using several transducers is demonstrated in Video 1-2, whereas Video 1-3 shows the use of various imaging modes and may be helpful for novice ultrasound users. Some imaging modes may appear to be the prerogative of advanced users; however, novices quickly learn taking advantage of the additional information they offer. Of note, correct choice of transducers and machine settings will help ensure proper identification of pathology or estimation of physiologic parameters, whereas poor preparation may render the study ambiguous or completely nondiagnostic.


Imaging modes (see figure 1-3)
A-mode (amplitude) is a nonimaging mode no longer used in general-purpose machines. B-mode (brightness) is the main imaging mode of any ultrasound machine. Each grayscale tomographic image in B-mode is composed of pixels with brightness, that depends on the intensity of the echo received from the corresponding location in the body. M-mode (motion) displays the movement of structures along a single line (axis of the ultrasound beam) chosen by the operator (Figure 1-4). M-mode is used in the intensive care unit (ICU) for evaluating heart wall or valve motion (echocardiography), hemodynamic status (vena cava analysis), and documentation of lung sliding or movement of the diaphragm. Doppler modes detect frequency shifts created by sound reflections off a moving target (Doppler effect). A moving reflector or scatterer changes the frequency of the beam (Doppler shift), as in (Fs − Ft) = 2VFt cos Φ/c, where V = the velocity of moving blood cells, c = the propagation speed, Ft = the frequency emitted by the transducer, Fs = backscattered frequency returning to the transducer, and Φ = the angle between beam and blood flow direction). If the beam lines up in parallel with blood flow (Φ = 0 degrees), cos 0 degrees = 1 (maximum Doppler shift). If the beam is perpendicular to the blood flow (Φ = 90 degrees), velocity measurements cannot be performed because cos 90 degrees = 0 (no Doppler shift). Angles in the 45- to 60-degree range are generally preferred.7
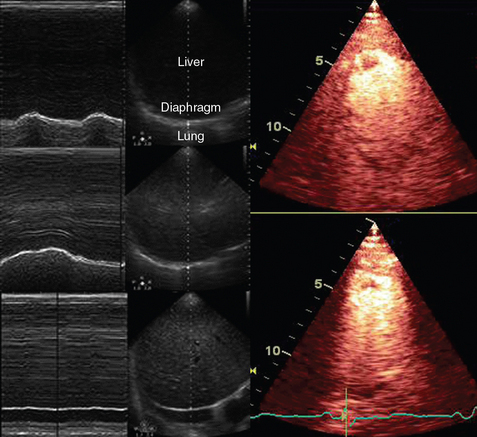
Figure 1-4 Old and new ultrasound techniques are useful in the intensive care unit. Left, M-mode showing diaphragmatic motion during T-piece trials (spontaneous breathing): normal movement (top), deep inspiration (middle), and flat-line in hemidiaphragmatic paralysis (bottom). Right, Contrast agents “light up” the left ventricle, and an apical thrombus is revealed.
The Doppler effect is used in several modes. Color Doppler maps all Doppler shifts in the region of interest (ROI) by using a color scale over the grayscale anatomic image. The colors (usually shades of red and blue) denote flow toward and away from the transducer, regardless of the vessel’s nature (artery or vein). The power Doppler mode, also known as Doppler angiography, displays all flow within the ROI in one color (usually orange) without regard to direction and is more sensitive (Figure 1 E-2). Spectral Doppler (see Video 1-3) refers to two different techniques: pulsed wave (PW) Doppler and continuous wave (CW) Doppler. CW Doppler involves continuous (not pulsed) generation of ultrasound by one crystal and reception of echoes by another, detects all shifts along the line chosen by the operator, and detects high velocities accurately. In PW Doppler, transmission is pulsed, and reception is performed by the same crystal. The operator places a special cursor (sample volume or gate) at the point of interest (e.g., center of a vessel). Its main advantage is the ability to display a full spectrum of frequency shifts from a specific anatomic point only. However, PW Doppler is unable to measure velocities greater than 1.5 to 2 m/sec because of aliasing. The term duplex ultrasound refers to the combination of anatomic information of B-mode with either color or spectral Doppler information on the same display. Triplex ultrasound demonstrates a grayscale image, the color Doppler overlay, and the spectral Doppler graph on the same display. Color M-mode displays in color the pulsed Doppler information along a single line of interrogation versus time. The Doppler velocity shift is color-encoded and superimposed on the M-mode image, providing high temporal resolution data on the direction and timing of flow events and is used mainly in cardiovascular imaging. Tissue Doppler imaging (TDI) is a modality in which the small Doppler shifts from tissue movements (most <20 mm/sec) are detected, while higher shifts from blood flow are suppressed. It is increasingly used in echocardiography for the assessment of various aspects of myocardial performance, especially in the diastolic function and greatly contributes to the differential diagnosis and management of myocardial pathology (Figure 1 E-3).7
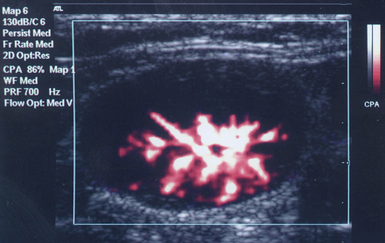
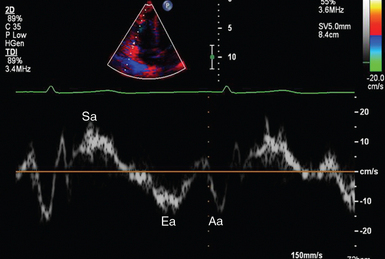
Figure 1 E-3 Pulsed wave, tissue Doppler imaging–derived myocardial velocities (peak myocardial velocities during systole = Sa, early = Ea, and late = Aa diastole, respectively) obtained adjacent to the tricuspid annulus (echocardiography). Reduced velocities have been documented in several disorders, such as postinferior myocardial infarction, chronic pulmonary hypertension, and chronic heart failure.
Harmonic frequencies are higher-integer multiples of the fundamental transmitted frequency that are produced as beams travels through tissues. With tissue harmonic imaging (THI), a software filter suppresses the fundamental frequency in the echoes and allows only harmonic signals to be received and processed into images. This may improve resolution and attain higher signal-to-noise ratios, minimizing the degradation effect of body wall fat. In some circumstances, however, THI image quality may actually be poor because of excessive filtering, with a resulting decrease in penetration and resolution. Anisotropic imaging is a recent evolution in ultrasound used for identifying abnormalities within normally anisotropic tissues. Anisotropy is a directional dependency of backscattered waves, which is present to varying extents in myocardium, renal cortex, tendons, and cartilage.7
Three-dimensional (3D) ultrasound acquires the anatomical information in a volume (3D) format. This technology undergoes continuous refinement as vendors seek to improve the performance and utility of 3D systems. By moving the 2D transducer in a controlled manner (linear-shift, swinging, or rotation), spatially tagged 2D data matrices are stored, to be reconstructed mathematically. 3D imaging can work with both B- and color Doppler modes, and its field of applications is constantly expanding (cardiology, obstetrics, neonatology, etc.). 3D images can be displayed in a variety of formats, including multiplanar reconstruction, surface rendering, volume rendering, and virtual endoscopy.7 This technology undergoes continuous refinement as vendors seek to improve the utility and performance of 3D systems.
Contrast-enhanced imaging has been a major development in ultrasound technology in recent years. Most contrast agents are microbubbles of gas encapsulated in a polymer shell. They are much more reflective than normal tissues and thus significantly improve B-mode and color Doppler image quality (see Figure 1-4). It is a generally safe method for cardiac imaging, vascular evaluation, and parenchymal enhancement. Microbubbles in some agents “burst” when subjected to ultrasound energy, enhancing the image even further. Potential ICU applications include detection of right-to-left shunts, thrombosis, and solid organ injury, as well as assessment of renal perfusion and demonstration of ischemia.8
When the goal is to attain unimpeded, high-resolution views of hard-to-reach tissues and structures, specialized high-frequency transducers are available. Endocavitary (vaginal, rectal) and transesophageal transducers are usually of microconvex configuration. Endoluminal imaging techniques (e.g., intravascular, endobronchial, and endourologic ultrasound) are catheter-based techniques using rotational scanning that produce 360-degree B-mode views of the vascular (ureteral, etc.) wall and adjacent tissue. Some of these invasive techniques are applied in the ICU to evaluate intraluminal disorders and guide procedures.7
Image quality and optimization
Resolution is a general term denoting the ability of the imaging method to discriminate the structural detail. The better (higher) the resolution, the greater the clarity and detail of the image. Spatial resolution (axial and lateral) refers to the ability of the B-mode to identify and display echoes from closely spaced echo-producing structures as distinct and separate objects. Axial resolution is the ability to discriminate individual echoes along the direction of the ultrasound beam (beam axis) and is approximately 0.5 to 1 mm at the operating frequency of 3.5 MHz. Higher frequencies produce better axial resolution at the expense of penetration. Lateral resolution is the ability to discriminate echoes located side by side at the same depth, and is approximately 1 to 2 mm at 3.5 MHz. Besides choosing the highest possible frequency that still penetrates to the depth of ROI, spatial resolution is improved by “focal zone” placement at the depth of the ROI (focus control) and by avoiding excessive gain settings. Contrast resolution, also known as grayscale resolution, is the ability to discriminate returning echoes of different amplitudes and assign different grayscale values to the respective pixels. Most ultrasound systems permit assignment of 256 shades of gray, which resolves the subtle differences among various structures. Increasing the contrast (less shades of gray) results in an image that is more pleasing to the human eye but likely contains less diagnostic information.1–5 Temporal resolution corresponds to the image frame rate (refresh rate), which ranges from 15 to 100 frames per second in different imaging modes and decreases when the depth or the number of focal zones is increased.
Modern portable ultrasound systems are significantly automated and similar in their user-adjustable functionality; however, controls (knobs) of the machine are still important to know. Depth (a knob or toggle switch) controls the depth of view and should be used to keep ROI in the central area of the screen (Figure 1-5). Depth is displayed along the edge of the image on a centimeter scale. Depth function alters the manner of acquisition of imaging data (preprocessing). An image at a shallower depth takes less time to form because only earlier-arriving echoes are processed, hence higher frame rates (better temporal resolution). The focus control allows moving the focal zone(s) to the ROI depth to ensure a narrower beam and therefore a better lateral resolution. The focal zone may be indicated as an arrowhead at the side of the image (usually on the depth scale). Most machines allow setting multiple focal zones; multifocusing degrades temporal resolution but improves spatial (both axial and lateral) resolution. Zoom control magnifies the selected image section without adding new information or changing the data acquisition (postprocessing). Some systems have an additional “high-definition zoom” option, whereas the machine’s beam-forming and data-processing capabilities are mobilized from other areas to optimize the image of the ROI.
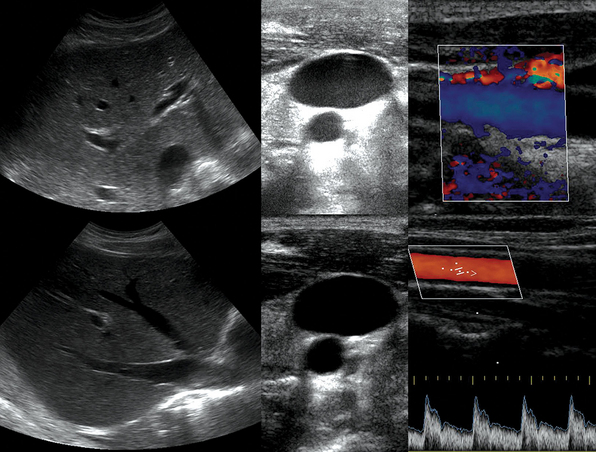
Figure 1-5 “Knobology”: Left, Too-shallow image depth (top) and correct depth adjustment (bottom) to depict the region of interest (ROI, liver). Middle, Image with inappropriate (high) gain (top) and correctly gained (bottom). Right, Increased color gain and large color box that is inappropriately angled (top) resulting in aliasing (common carotid artery) and properly sized and angled color-box with adjusted color gain to perform color Doppler measurements (bottom).
Gain adjusts overall image brightness by amplifying electronic echo signals; thus it works only on the receiving side and has no impact on transmitted power or bioeffects. Gain must be adjusted to such a level that anechoic structures (e.g., fluids) appear black on screen. Using too much gain can degrade the image and create artifacts, and using too little gain can negate real echo data (see Figure 1-5). In addition, most machines also have time gain compensation (TGC) controls (usually a group of slider rheostats) to adjust the gain selectively at various depths. To compensate for attenuation, echoes are electronically amplified proportional to the depth of their origin (i.e., time of their return to the transducer). TGC controls need readjustment when, for example, a large fluid-filled window is used; otherwise, the ROI behind the window will be too bright (overamplified). Further improvement of B-mode image quality can sometimes be achieved by THI.1–5
PRF is the rate of pulses used to analyze the Doppler shift. For PW Doppler measurements of arterial flow, PRF is generally set at 3000 to 4000 pulses/second or Hz, which allows a wide enough Doppler range to fit spectra with most arterial velocities. If the actual shifts exceed the scale, the peak part of the spectrum in excess of the scale appears in the wrong place (PW Doppler) or in the wrong color (color Doppler). This phenomenon is called aliasing, and the Doppler shift limit at which it occurs is called the Nyquist limit and equals 1⁄2 PRF. In color Doppler, aliasing is avoided by increasing the scale (PRF) and/or using the baseline control to dedicate a larger portion of the scale to the flow in the dominant direction (toward or away from the probe), and/or by increasing the angle between the ultrasound beam and the flow vector (e.g., from 45 to 60 degrees) to reduce the actual shifts. In spectral Doppler, similar controls are available. In veins with much lower flow velocities, a PRF setting of 1000 Hz is a typical starting frequency. Modern machines have built-in “presets” for arterial and venous examinations, with PRF set to appropriate values. Older machines may have to be adjusted manually, including frequency filters. In PW Doppler, sample volume (also known as gate) size and placement are essential for correct measurements. A smaller sample volume of 1 to 2 mm is used when detailed investigation of flow within the vessel is required (e.g., when the degree of flow turbulence is to be assessed). The sample volume is placed in the center of the vessel or at the point of peak velocity indicated by the color image. In cases where blood flow is reduced (e.g., venous circuits) a larger sample volume may be appropriate. The Doppler spectral waveforms are produced by spectral analysis of the frequencies contained in the echoes returning from the sample volume area, using real-time fast Fourier transform or similar algorithms.1–5
Artifacts
Acoustic shadowing (Figures 1-6 and 1-7) appears as an echo-free void (shadow) in anatomy image when the beam is unable to pass through a strongly attenuating structure (e.g., a strong absorber or reflector). The orientation of the shadow is always in the direction of beam propagation (away from the probe—vertical with linear probes or radial in sector or convex probes). Shadowing because of large stones, calcifications, and bones is caused mainly by sound absorption, refraction and reflection and the associated shadow tends to be more anechoic (“clean”). In a tissue-air interface, shadowing is caused by complete reflection, whereas secondary reflections created at the interface are displayed as false low-level echoes within the shadow (“dirty shadowing”). Edge shadowing appears as shadowing from the edge of circular structures mainly because of refraction and beam spreading. It is a useful criterion for diagnosing cysts but can mimic stones, especially in the gallbladder fundus and cystic duct. Absence of shadowing from an echogenic (bright) object does not rule out a stone or calcification if it is very small (<3 mm in the most common imaging circumstances). Furthermore, some ultrasound machines use additional beams steered at angles that may bypass the small stone and create elements of true anatomic image behind it, thus suppressing the shadow. This technique is commonly known as real-time image compounding.
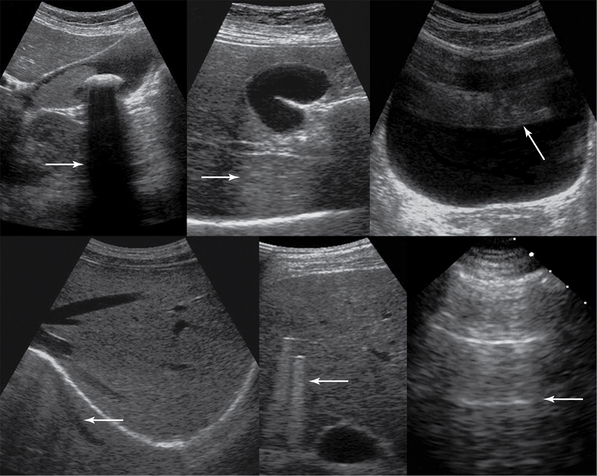
Figure 1-6 Top, left to right, Gallbladder stone casts acoustic shadowing, posterior acoustic enhancement (gallbladder), and reverberations (arrows). Bottom, left to right, Mirror image, comet-tail artifacts produced by bullets embedded in liver parenchyma, and ring-down artifacts of the pleural line (arrows).
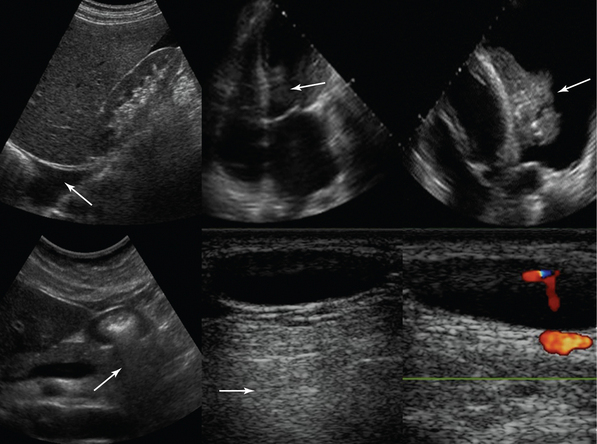
Figure 1-7 Top, left to right, Pleural effusion prevents mirror image duplication of liver; echo introduced falsely in an anechoic structure (left ventricle), mimicking thrombus as it is produced by a lung atelectasis (located at the same depth) floating within a pleural effusion (refraction artifact). Bottom, left to right, Dirty shadow cast by air-filled antrum; posterior acoustic enhancement caused by hypoechoic neck lymph node (arrows).
Posterior acoustic enhancement appears as a hyperechoic (bright, overamplified) area because of reduced attenuation by the area above it. It usually indicates the fluid nature of the weakly attenuating structure, although some low-echogenicity solid masses may cause similar enhancement patterns (see Figure 1-6).
Mirror images appear as two reflectors (true and spurious) with the spurious reflector located deeper than the true reflector and disappearing with transducer’s position change (see Figures 1-6 and 1-7). Refraction artifacts appear as copies of true reflectors whenever the beam strikes a boundary; this is different from the mirror image because it is visualized side by side with the true anatomic structure at the same depth (see Figure 1-7). Reverberations appear as multiple echoes between reflectors. They appear often at the anterior aspect of the distended urinary bladder (see Figure 1-6). Special forms of reverberations include ring-down and comet-tail artifacts (see Figures 1-6 and 1-7). Ring-down artifacts occur from a large mismatch in the acoustic impedance of media (e.g., when an air bubble is encountered) and are usually displayed as a vertical line that goes all the way or almost all the way down the image. Comet-tail is another type of reverberation artifact that appears as hyperechoic trail of reverberations arising from an echogenic structure (e.g., irregularity on the lung surface, some foreign bodies, cholesterol deposits in the gallbladder wall) that fade and taper down distally. Thus the main difference between these two reverberation artifacts is in their length and character (ring-down artifact continues all the way down the image, whereas comet-tails taper fairly close to the origination point). Side-lobe artifacts appear as areas of faded duplicate image side by side with the true anatomic structure and therefore could be mistaken for sediment or septa, usually within a fluid compartment (e.g., ascites), or could artificially enlarge the image of the anatomic structure (e.g., the prostate imaged through the urinary bladder). Fortunately, small probe movements usually eliminate this artifact. Section thickness artifacts appear as a fill-in of an anechoic structure (e.g., a cyst) if the beam has a greater width than the structure in question and could mimic debris, sludge, or clotted blood. As with B-mode, imaging artifacts can arise in color Doppler imaging as well. Color flow artifacts may appear as bright black and white structures within the vessel lumen. Also, if color gain is set too high, then color may appear as pouring out of the vessel, or anechoic areas may be filled with speckled color; however, these artifacts may be also produced by tissue bruits near a vessel stenosis or subtle tissue movements resulting from respiration (color noise). Whenever vessels overlie boundaries (e.g., subclavian artery overlying lung and pleura) mirror-color artifacts may be produced because of multiple reflections. Finally, aliasing and changes in the angle of insonation also produce artifacts.5–7
Although artifacts in general degrade the image and often replace anatomic information, some important ultrasound techniques take advantage of certain types of artifacts or even completely depend on the presence or absence of certain artifacts for accurate diagnostic determination. For example, many pleural and lung ultrasound techniques are based on recognition and assessment of specific artifacts (see Chapters 19 and 20).
Ultrasound technique and safety issues
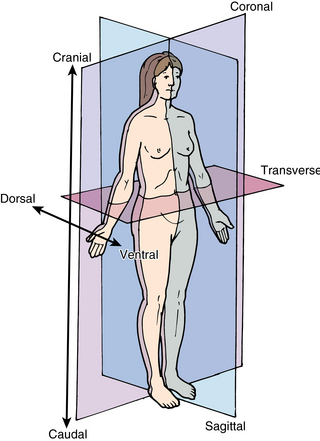
Basic ultrasound scanning orientation terms are shown in Figure 1-8. Coronal refers to the longitudinal scan performed from the patient’s side, and the plane separates the anterior from the posterior. Transverse or axial refers to a plane that separates the cephalad from the caudad. Sagittal refers to the longitudinal anteroposterior plane that divides right from left. Cranial (cephalad) indicates the direction toward the head and caudad the direction toward the feet. Anterior (ventral) and posterior (dorsal) refer to structures lying toward the front or the back of the subject, respectively. Medial means toward the midline and lateral away from it, whereas proximal means toward the origin and distal away from it.5–7
High-intensity focused ultrasound (HIFU) is a therapeutic modality used for ablation of breast tumors, prostates, uterine fibroids, and so on, by producing intensities exceeding 1000 W/cm2 and raising tissue temperatures by up to 25° C. Diagnostic ultrasound devices use orders of magnitude lower intensities and very small duty factors (proportion of transmitting time relative to the total examination time); its thermal effects (the first recognized adverse bioeffect—tissue heating) are expressed as the thermal index (TI), the value of which equals the predicted rise of tissue temperature in degrees C with unlimited exposure. Temperature elevations less than 1° C are considered safe even for ophthalmic imaging.1–3
The second notable adverse bioeffect of ultrasound is cavitation—explosive formation of microscopic bubbles in tissues caused by abrupt pressure fluctuations. This phenomenon is highly unlikely at diagnostic ultrasound intensities. However, experimental studies suggest that contrast agents and agitated saline may, under certain circumstances, promote cavitation even at moderate energies. For example, when investigating a patient with probable right-to-left shunt, agitated saline or a special contrast agent is administered to perform transcranial Doppler (TCD) for bubble detection in the middle cerebral artery (MCA) or the ophthalmic artery (OA). TCD operates at high acoustic power to penetrate the skull through the temporal window; if the same power level is applied through the orbital window, the energy passing through the low-attenuation ocular media may create cavitation within retinal arterioles containing bubbles and result in a hemorrhage. The ability of the given ultrasound mode to cause cavitation is best characterized by the mechanical index (MI), which is required to be displayed along with the thermal index on the screen of all modern ultrasound machines. Minding the vulnerability of the eye, several guidelines require lowering the energy output to limit the ocular scanning energies to levels corresponding to MI less than or equal to 0.23 and TI less than or equal to 1.0. Notwithstanding the cautious approach, all the evidence and theoretic considerations attest to a very high safety margin of diagnostic ultrasound in the clinical context, making it the safest tomographic modality, with no electromagnetic or particle radiation and very low overall energy delivery.5–8
Scope and evolution of ultrasound imaging
To satisfy the unmet need for instantaneous results and repeatable imaging data as part of the patient examination and monitoring by the physician, new branches of ultrasound technology have evolved in recent years: emergency ultrasound (EU) and critical care ultrasound (CCU). These can be considered new modalities that use the same equipment but have a different scope and different effects on patient management. They do not take the place of “radiologic” ultrasound; furthermore, many studies requiring comprehensive analysis are still referred to expert radiologists and cardiologists for thorough consideration, in addition to standardized studies performed by radiologic personnel. In the following sections, we describe the main features of EU and CCU, as well as present the innovative concept of holistic approach (HOLA) to the use of ultrasound in the emergency and critical care environments.
Emergency ultrasound
Documentation of ultrasound examinations, including ultrasound-guided procedures, is essential not only for reimbursement purposes but also for communication with other physicians. Use of electronic or permanent medical records is critical, and both image and video loop archiving are very helpful. A comprehensive hospital credentialing plan is mandatory to ensure proper training and quality assurance and to have a productive emergency ultrasound program in place that will aid patient care, not hinder it.6
Critical care ultrasound
CCU has several limitations. In the ICU, the physical examination is deprived of some basic elements. Patients are usually intubated under sedation and analgesia; they may have difficulty communicating or indicating pain. Mechanically ventilated patients are placed in a supine position, and thus usual ultrasound techniques that are applied in ambulatory patients may not be suitable. Moreover, access to the patient is obstructed by cables, electrodes, catheters, and so on, and, especially in trauma patients, by bandages, splints, burn wounds, and so on, rendering some acoustic windows inaccessible. Acoustic barriers such as bowel gas, subcutaneous emphysema, pneumothorax and pneumoperitoneum may affect clarity of images. Fluid overload is not an absolute barrier, although the presence of diffuse tissue edema in patients with systemic inflammatory response syndrome interferes with image quality.9 Still, persistence in CCU is usually rewarded. For example, in patients with limited windows or excessive bowel gas, abdominal imaging can be facilitated by the use of small-footprint (phased array or microconvex) transducers and/or intercostal approaches.
Prevention of cross-infections in the ICU is essential. Robust disinfection and procedural guidelines should be implemented in routine practice to avoid transmitting nosocomial pathogens (e.g., multiresistant gram-positive or gram-negative strains) between patients. CCU operators should wear gloves and avoid touching other parts of the device with the hand that holds the transducer. This is done by using one hand for handling the transducer and the other one for making system adjustments; alternatively, two operators may participate in the procedure. Operators should follow universal precautions for infection control. In ultrasound-guided invasive procedures, strict sterile protocols must be followed with the use of sterile transducer covers and gels. Upon completion of the examination, transducers must be cleaned immediately in the direction from the cable to the probe face, and disinfected according to the manufacturer’s recommendations. Care and maintenance of ultrasound machines are critical.10 Recent reports indicate the possibility of infection transfer through refillable gel bottles. Some medical facilities have decided to use only prefilled bottles and discard them once empty; this trend will likely continue.
 So far we have underlined major CCU limitations. Sometimes, a limitation proves to be an advantage. Sedation and analgesia facilitate transducer manipulations in all diagnostic examinations. Ultrasound-guided invasive procedures are facilitated by alleviation of pain or discomfort. Myochalasis results in low muscle resistance, and thus applying transducer pressure to identify ROIs becomes easier (e.g., abdominal examination). Mechanical ventilation, although significantly interfering with surface chest ultrasound (Video 1-4), facilitates visualization of subcostal organs. In general, the advantages of an easy-to-perform bedside examination cannot be overstated. CCU in its full-fledged implementation is seen by us as a companion to physical examinations by clinicians who evaluate every new admission in the unit, and selective routine rescanning is imperative in most cases.9,11,12 CCU considers likely complications and diagnoses unsuspected abnormalities, besides facilitating critical care monitoring.13
The holistic approach ultrasound concept
The HOLA concept of ultrasound imaging defines CCU as part of the patient examination by a clinician, to visualize all or any parts of the body, tissues, organs, and systems in their live, anatomically and functionally interconnected state and in the context of the whole patient’s clinical circumstances. This concept is illustrated in Figure 1-9. Details about the various techniques that are integrated in HOLA-CCU are presented throughout this textbook.
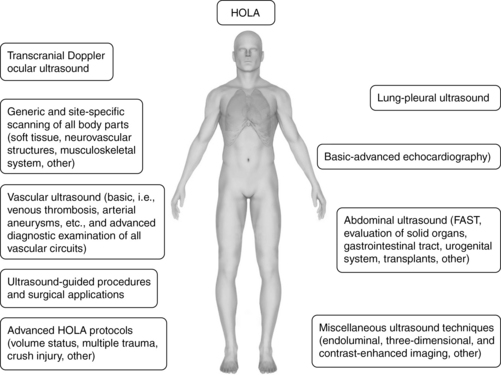
The HOLA concept recognizes the generally accepted division of CCU applications into two categories: basic and advanced (or consultant-level) applications. Basic applications can be seen as either critical, lifesaving applications or focused uses that can significantly expedite care. To this end, ultrasound-guided procedures, focused echocardiography, e-FAST, and abdominal aortic aneurysm examinations may be lifesaving and are considered basic. Focused deep venous thrombosis (DVT) examinations and lung ultrasound as well as dynamic/patient management procedures, such as simple volume status assessment, expedite care and hence also belong in the basic category. Advanced echocardiography, including nonarrest transesophageal applications, is a consultant-level technique. The vast majority of comprehensive ultrasound examinations, such as biliary, renal, vascular, TCD, and open-ended/nonfocused ultrasound examinations are referred for comprehensive radiologic data collection and analysis and also fall into the consultant-level category. Thus practice of HOLA-CCU by a given unit does not mean that all studies are performed by intensivists; the critical care facility is part of the given medical system or hospital and uses radiology and other services as necessary. Although HOLA-CCU could be interpreted globally as the transducer being applicable to all surfaces and tissues, it rather defines the scope of critical care practice, while creating appropriate referrals that require additional ultrasound expertise (see Chapter 57).
In a fictional scenario described later, a sequence of ultrasound-supported physical examination is described to illustrate HOLA-CCU. Examination starts from the head (Figures 1-10 to 1-12) by accessing temporal and ophthalmic windows for TCD; eye and orbit ultrasound is performed using appropriate machine settings (see Chapters 2 to 6). Scanning of maxillary sinuses and other facial structures is also performed (see Chapter 51). Neck and upper limb exploration (Figures 1-13 to 1-19 ) provides information about the trachea, thyroid, soft tissues, and neurovascular and musculoskeletal structures (see Chapters 8 to 16 and Chapters 51 to 54). After both supraclavicular and infraclavicular approaches, scanning reaches the axilla and the shoulder region and is further extended to the upper limbs. The “core” of HOLA ultrasound scanning in the ICU is general chest ultrasound (Figures 1-20 to 1-24), comprising lung, pleural space, and cardiac ultrasound (see Chapters 19 to 34). Lung and pleural ultrasound explores the subpleural lung parenchyma, the diaphragm, and pleural space abnormalities. Echocardiography is essential for cardiac and pericardial pathology and for hemodynamic assessment. Abdominal scanning (Figures 1-25 to 1-28) integrates the e-FAST components for free fluid detection but also targets solids organs (e.g., spleen size), the aorta and abdominal vascular networks, the gastrointestinal tract (peristalsis, small bowel diameter and contents), and the urogenital system, as well as the peritoneum and lower pelvis (see Chapters 8 and Chapters 41 to 46). The inguinal region is often the site for vascular access and corresponding complications, such as hematomas and pseudoaneurysms. Finally, exploration of the inguinal region is protracted to the lower limbs (Figures 1-29 and 1-30). Assessing patency of venous circuits and excluding DVT is essential (see Chapters 9 and 51), whereas gathering information about musculoskeletal abnormalities is often valuable, especially in a patient with appropriate history (see Chapter 51).
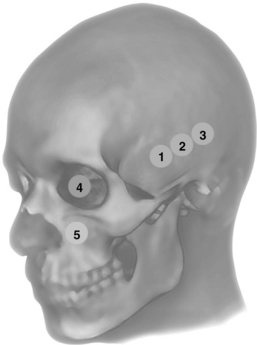
Figure 1-10 Anterior (1), middle (2), and posterior (3) temporal and ophthalmic (4) windows for transcranial Doppler (TCD); eye and orbit ultrasound is performed using appropriate machine settings; (5) examination of the maxillary sinuses and extended scanning to explore other facial structures.
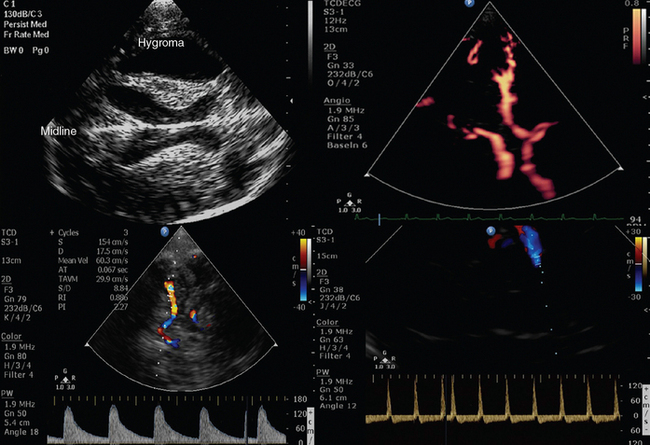
Figure 1-11 Top, B-mode depicting hypoechoic “butterfly-shaped” cerebral peduncles in a patient with posttraumatic hydrocephalus but no apparent shift of the midline (left); power Doppler showing a normal circle of Willis (right). Bottom, Middle cerebral artery transcranial Doppler (TCD) spectral velocities demonstrating increased pulsatility index (PI) values (>2) in a patient with severe brain injury and edema (left) that progressed toward brain tamponade and cerebral circulatory arrest (“to-and-fro” flow patterns, right).
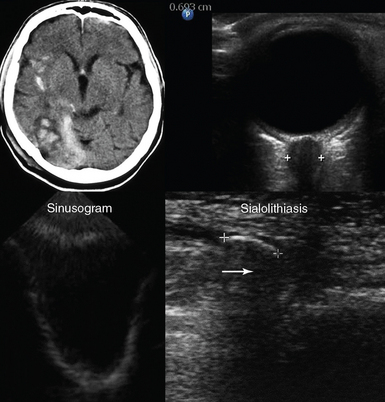
Figure 1-12 Top, Brain computed tomography scan demonstrating severe craniocerebral injury (Marshall scale = III, left) and ocular ultrasound showing increased optic nerve sheath diameter (>0.6 cm) in the same case (right). Bottom, Visualization of the posterior and lateral walls (sinusogram) of a totally fluid-filled maxillary sinus (left) and view of the submandibular gland showing a dilated duct (sialolithiasis) with an intraductal stone (arrow) that casts an acoustic shadow (right).
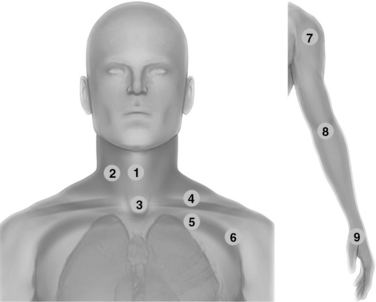
Figure 1-13 Neck scanning zones (left): Median line (1) and lateral (2) scanning zones; suprasternal view (3); supraclavicular (4) and infraclavicular (5) scanning approaches extending laterally (6); upper limb exploration (7, 8, and 9) using the shoulder, elbow, and wrist joints, respectively, as landmarks (right).
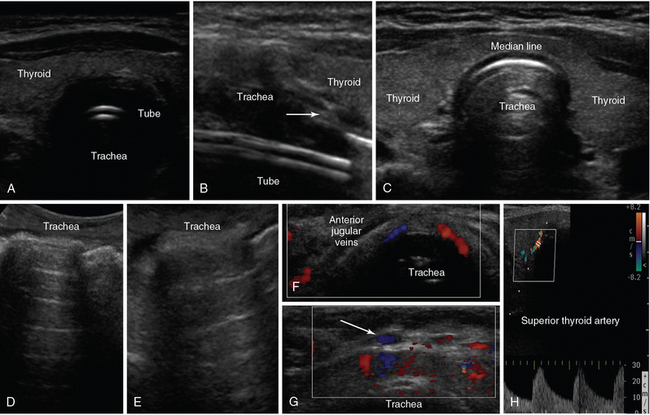
Figure 1-14 A, Median-line transverse view of an intubated trachea. B, Longitudinal view depicting the tracheal rings as a “string of beads” (arrow) and the endotracheal tube as echogenic parallel lines. C, Median-line transverse view at the level of the thyroid gland. D (median line) and E (lateral view), Oblique views of a normal trachea showing its entire anatomic configuration. Median-line transverse views demonstrating the anterior jugular veins (F) and tributaries (arrow) of the venous jugular arch, which may be helpful to identify when selecting optimal sites for performing percutaneous tracheostomy (G). H, Depiction of a normal superior thyroid artery by color Doppler.
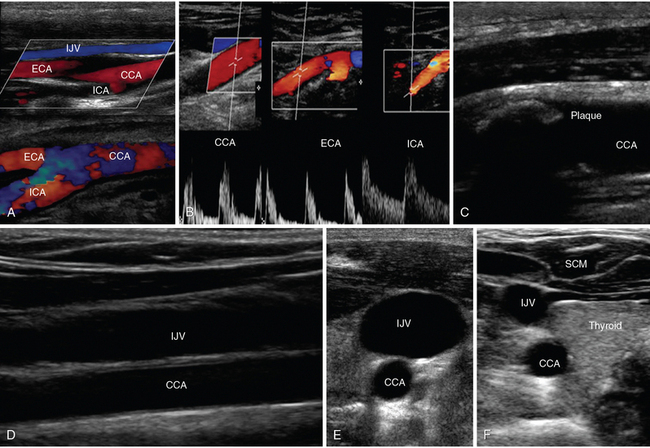
Figure 1-15 A, Lateral neck views of the common carotid artery (CCA) bifurcating into external carotid artery (ECA) and internal carotid artery (ICA), respectively. B, Doppler waveforms of the CCA, ECA, and ICA, respectively. C, Visualization of an atherosclerotic carotid plaque that casts acoustic shadowing. D, Visualization of the internal jugular vein (IJV) overlying the CCA (longitudinal view). Transverse views of the IJV and CCA showing increased and decreased IJV diameters when scanning caudally (E) and cranially (F). SCM, Sternocleidomastoid muscle.
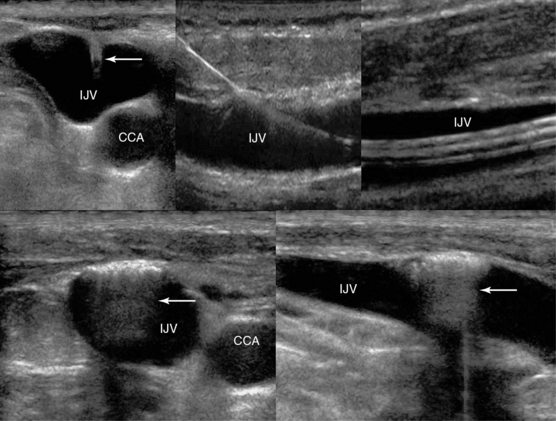
Figure 1-16 Top, left to right, Visualization of ultrasound-guided internal jugular vein (IJV) cannulation: longitudinal views of the vascular cannula tip (transverse view, arrow), wire, and triple lumen catheter, respectively. Bottom, Sequelae of a blind IJV cannulation: transverse and longitudinal views depicting an injury of the IJV anterior wall (hyperechoic), with trapped air enhancing posterior acoustic shadowing (arrow).
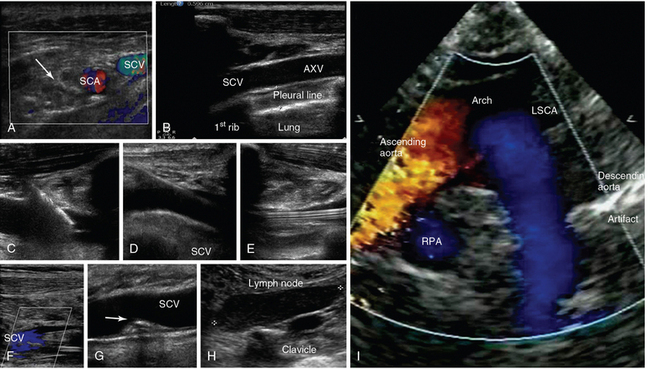
Figure 1-17 A, Transverse infraclavicular view of the subclavian artery (SCA), subclavian vein (SCV) and brachial plexus (arrow). B, Longitudinal infraclavicular view of the axillary vein (AXV), which continues as the SCV (overlying the pleural line). Visualization of an ultrasound-guided SCV cannulation: longitudinal views of the vascular cannula tip (C), wire (D), and triple-lumen catheter (E), respectively. F, Depiction of partial flow in the SCV resulting from central line–associated thrombosis. G, Visualization of a calcified thrombi remnant (arrow) attached to the SCV wall (after anticoagulation treatment). H, Demonstration of a metastatic neck lymph node in a patient with thyroid cancer (supraclavicular view). I, Suprasternal view of the aorta. LSCA, Left subclavian artery; RPA, right pulmonary artery.
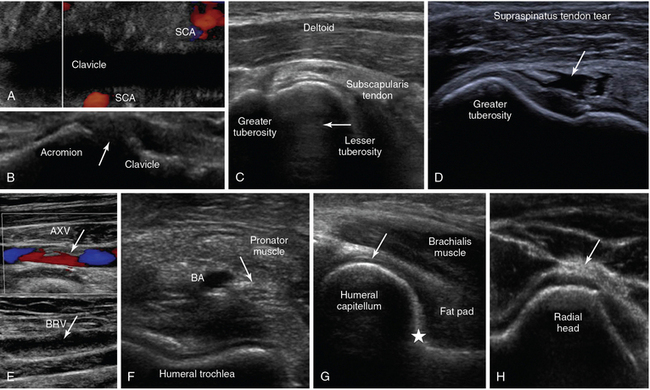
Figure 1-18 A, Oblique lower neck view depicting the subclavian artery (SCA) at the borders of the clavicular acoustic shadow. B, Coronal plane view over the acromioclavicular joint (arrow = joint space). C, Transverse view of the anterior shoulder depicting the biceps tendon’s long head (arrow) between the lesser and greater tuberosity, respectively. D, Visualization of a full-thickness tear of the supraspinatus tendon in a trauma patient (arrow). E, Partial flow in the axillary vein (AXV) resulting from thrombosis (arrows), extending to the brachial vein (BRV). F, Transverse anterior elbow view depicting the V-shaped humeral trochlea and the brachial artery (BA), accompanied by the median nerve (arrow). G, Medial sagittal plane of the coronoid fossa depicting the brachialis muscle and the anterior coronoid recess (star), where a small amount of fluid is normally found (arrow = articular cartilage of distal humeral epiphysis). H, Lateral elbow view depicting the radial head and the posterior interosseous nerve (arrow).
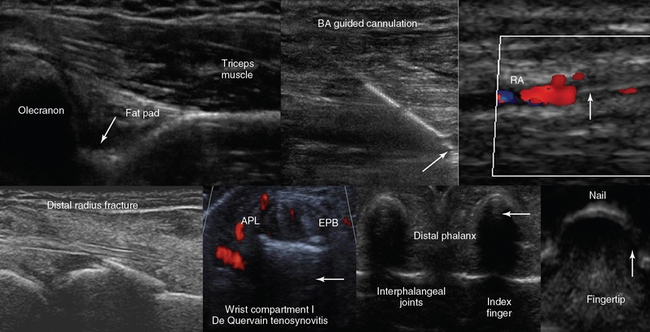
Figure 1-19 Top, left to right, Posterior view of the elbow (partial flexion) depicting the olecranon fossa, triceps muscle, and the posterior olecranon recess (arrow); ultrasound-guided cannulation (longitudinal axis) of a brachial artery (BA) with vasospasm resulting from previous unsuccessful attempts in an obese subject with subcutaneous edema (arrow = artifact demonstrating the use of agitated saline and needle tip movement to confirm cannulation within the vessel lumen); longitudinal view of the lateral wrist confirming an arterial line (arrow) in the radial artery (RA) after guided cannulation. Bottom, left-to-right, Lateral/coronal long-axis scan of the distal forearm in a trauma patient, demonstrating a comminuted distal radius fracture: four distinct segments of bone with mutual misalignment, with a hypoechoic area of a likely hematoma (note the extensor pollicis brevis (EPB) tendon across the screen, parallel to the skin and the general axis of the fractured bone); focal thickening and increased vascularity surrounding the de Quervain tendons of the abductor pollicis longus (APL) and EPB at the level of the radial styloid (arrow) process (de Quervain tenosynovitis); transverse view of the interphalangeal joints of the index and middle fingers (arrow = vincula tendinum); “sonographic fingertip”: transverse view (inverted) of the index finger’s tip and nail (arrow = eponychium).
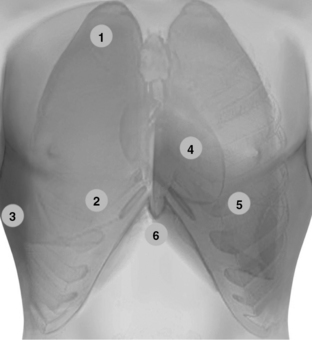
Figure 1-20 Lung ultrasound: Scanning the anterior chest from the lower clavicular border (1) to the upper border of subcostal spaces (2), bilaterally. Pleural ultrasound: flank views (3) advancing from the diaphragm (discrimination point between pleural and peritoneal effusions) to the axilla and from the anterior to the posterior axillary lines (including prone views if applicable). In lung ultrasound examination, it is useful to adopt a systematic scanning protocol by dividing the lung into six regions (upper and lower scans of the anterior, lateral, and posterior regions), which are further outlined by the anterior and posterior axillary lines. Transthoracic echocardiography: The standard parasternal approach (4) is obtained by placing the transducer 2 to 3 inches to the left of the sternum in the fourth or fifth rib interspace. Apical views (5) are obtained by placing the transducer on the fifth intercostal space (approximately left midclavicular line at the point of maximal impulse). In the intensive care unit, the above-mentioned windows are usually improvised (by sweeping the transducer to adjacent sites to visualize the heart) because mechanically ventilated patients are usually in a supine position with 30-degree head-up positioning. Hence the heart is displaced rather caudally. Image acquisition can be difficult because of the effect of mechanical ventilation and various other common lung pathologies (e.g., emphysema, acute respiratory distress syndrome). Alternatively, subcostal and subxiphoid views (6) can be used to visualize the heart.
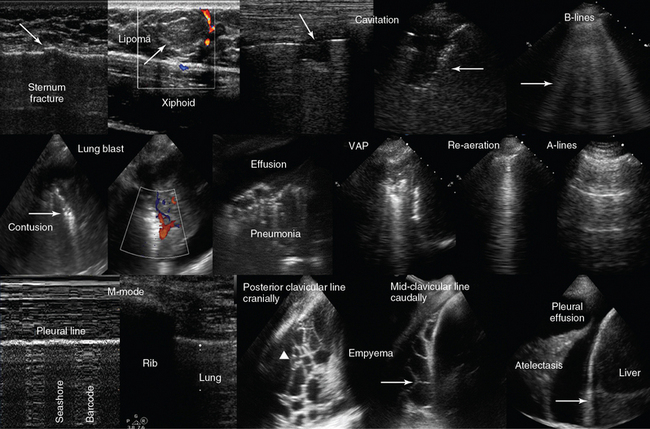
Figure 1-21 Top, left-to-right, Chest scanning. Visualization of a sternum fracture (arrow); superficial lipoma (arrow) over the xiphoid process; disruption of the pleural line (arrow) resulting from a cavitation in a patient with pneumonia (Klebsiella species); B-lines (arrow) in a patient with interstitial lung edema. Middle, left-to-right, Visualization of a lung blast after blunt thoracic trauma, showing a consolidation pattern of increased density with hyperechoic punctiform elements (arrow) and normal vascularity; visualization of pleural effusion and lung consolidation with air-bronchogram (pneumonia); demonstration of lung consolidation and atelectasis in a patient with ventilator-associated pneumonia (VAP). In the latter, after recruitment maneuvers, a B-line pattern was observed (re-aeration), and consequently an A-line pattern was evident as pneumonia subsided (normal lung). Bottom, left-to-right, Demonstration of the lung point by M-mode (pneumothorax): There is a fluctuation over time between “seashore” and “barcode” patterns with the transducer stationary; right flank views depicting an empyema with honeycomb appearance (arrowhead) and septa formation (arrow); and visualization of lung atelectasis floating within a pleural effusion (arrow = diaphragm).
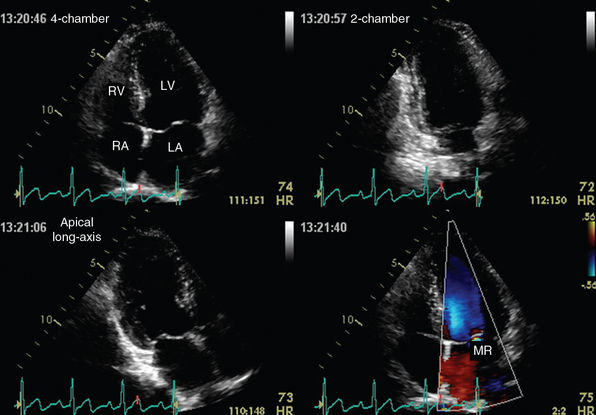
Figure 1-22 Apical views of a normal heart depicted by transthoracic echocardiography. Top, Four-chamber (left) and two-chamber (right) views. Bottom, Apical long-axis view (left) and demonstration of mitral valve regurgitation (MR, right) on color mode. LA, Left atrium; LV, left ventricle; RA, right atrium; RV, right ventricle. (Courtesy Dr. A. Patrianakos.)
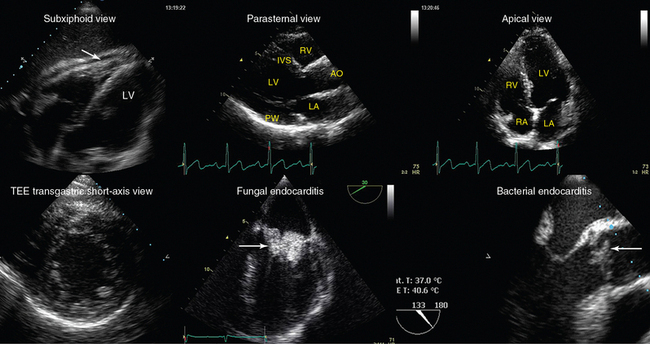
Figure 1-23 Top, left-to-right, Transthoracic echocardiography views. Subxiphoid view depicting a small pericardial effusion (arrow); parasternal and apical views of a normal heart, respectively (AO, Ascending aorta; IVS, intraventricular septum. Bottom, left-to-right, Transesophageal echocardiography views: transgastric short-axis view of a normal heart; midesophageal views demonstrating fungal endocarditis of the mitral valve, and bacterial endocarditis of the aortic valve, respectively (arrows). LA, left atrium; LV, left ventricle; PW, posterior wall; RA, right atrium; RV, right ventricle.
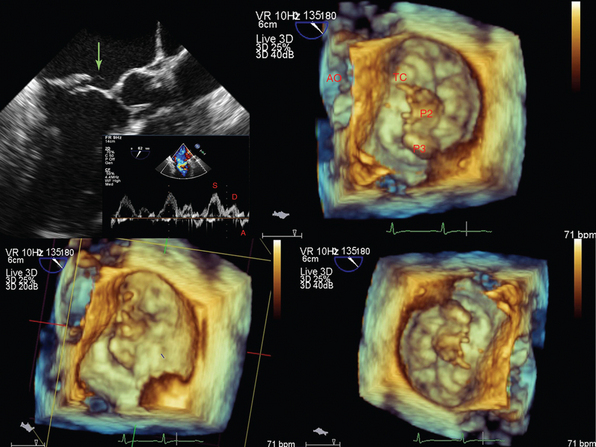
Figure 1-24 A tendinous chord rupture (green arrow) causing acute mitral valve regurgitation (top left), which is further visualized by three-dimensional transesophageal echocardiography at the level of the annulus. AO, Aorta; P2 and P3, scallops of the posterior leaflet, which are the widest around the annulus; TC, tendinous chord.
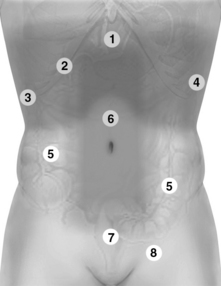
Figure 1-25 Holistic approach (HOLA) abdominal scanning paths (refer also to Figures 1-26 and 1-27). 1, Upper abdominal scans. 2, Extended intercostal and right subcostal oblique scans. 3 and 4, Right and left flank scans, respectively. 5, Small and large intestine scanning paths. 6, Scan of the abdominal vessels (midabdominal). 7, Suprapubic and lower pelvic views. 8, Scan of the inguinal area.
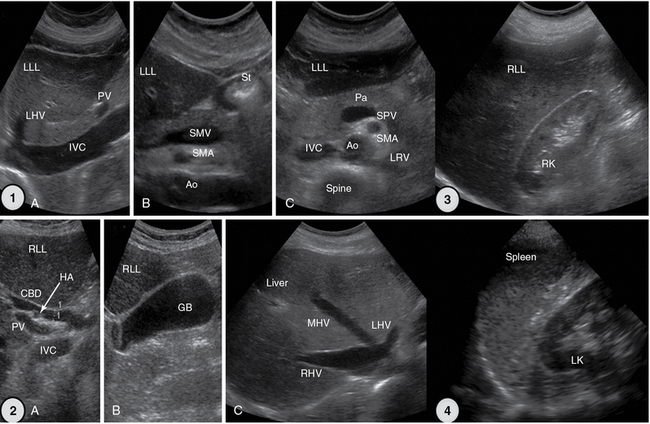
Figure 1-26 1, Upper abdominal longitudinal and transverse scans. 2, Extended intercostal scans (A and B) and right subcostal oblique scan (C). 3, Right flank scan. 4, Left flank scan. Ao, Aorta; CBD, common bile duct; GB, gallbladder; HA, hepatic artery; IVC, inferior vena cava; LHV, left hepatic vein; LK, left kidney; LLL, left liver lobe; LRV, left renal vein; MHV, middle hepatic vein; Pa, pancreas; PV, portal vein; RK, right kidney; RHV, right hepatic vein; RLL, right liver lobe; SMA, superior mesenteric artery; SMV, superior mesenteric vein; SPV, splenic vein; St, stomach, gastric antrum.
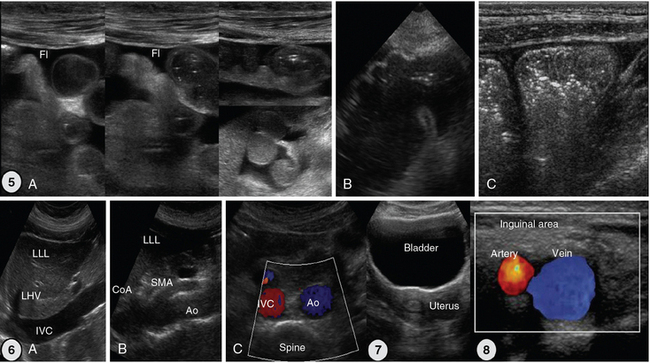
Figure 1-27 5, Scans of the small and large intestine. A, Small intestinal loops are well visualized because of intraperitoneal fluid. B, Caecum. C, Ascending colon with typical haustration. 6, Vascular scanning path (midabdominal): longitudinal (A and B) and transverse (C) views. 7, Suprapubic view of the bladder and uterus. 8, Landmarks of inguinal area: common femoral artery and vein. Ao, Aorta; CoA, celiac artery; Fl, fluid; IVC, inferior vena cava; LHV, left hepatic vein; LLL, left liver lobe; SMA, superior mesenteric artery.
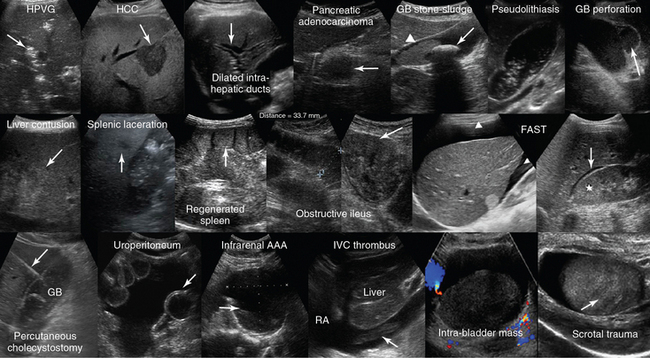
Figure 1-28 Top, left to right, Hepatic portal venous gas (HPVG) depicted as patchy highly reflective areas in the right liver lobe (arrow); visualization of hepatocellular carcinoma (HCC) as an hypoechoic liver mass (arrow); dilation of the intrahepatic ducts (arrow); visualization of an hypoechoic mass (arrow) at the head of pancreas (adenocarcinoma); solitary gallbladder (GB) stone (arrow) with acoustic shadowing and dense sludge (arrowhead); layer of nonshadowing midlevel echoes in the GB (pseudolithiasis); subacute GB perforation (arrow). Middle, left-to-right, Visualization of heterogeneous liver parenchyma (arrow) in a patient with liver contusion; visualization of heterogeneous splenic parenchyma (arrow) and perisplenic fluid delineating adjacent bowel loops (splenic laceration); a fully regenerated (arrow) orthotopic spleen (15 years postsplenectomy); obstructive ileus: dilated small intestinal loops resulting from a large tumor (arrow); focused assessed sonography for trauma (FAST) views of large perihepatic and Morison pouch effusions (arrowheads) as well as of a small effusion in the latter (star = kidney). Bottom, left-to-right, Visualization of a percutaneous cholecystostomy catheter (arrow) entering the inflamed GB in a patient with acute cholecystitis. Uroperitoneum resulting from spontaneous bladder rupture, delineating normal bowel loops (arrow = balloon of indwelling bladder catheter); sagittal view of a huge infrarenal abdominal aortic aneurysm (AAA) with mural thrombus (arrow); fresh floating thrombus (arrow) in the inferior vena cava (IVC) “migrating” toward the right atrium (RA); intrabladder mass without any evidence of blood flow (hematoma) that dissolved after normal saline irrigation. Heterogeneous testicular parenchyma (arrow) and hypoechoic fluid collection (hematoma) in a male patient with scrotal trauma. (Top row: Images of HCC and subacute perforation courtesy Dr. K. Shanbhogue. Bottom row: Image of acute cholecystitis courtesy Dr. S. Dissanaike. Image of intrabladder mass courtesy Dr. K. Shanbhogue.)
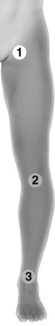
Figure 1-29 Lower limb examination. 1, Exploration of the inguinal area and hip joint. 2 and 3, Extending scanning distally, using the knee and ankle joints as landmarks.
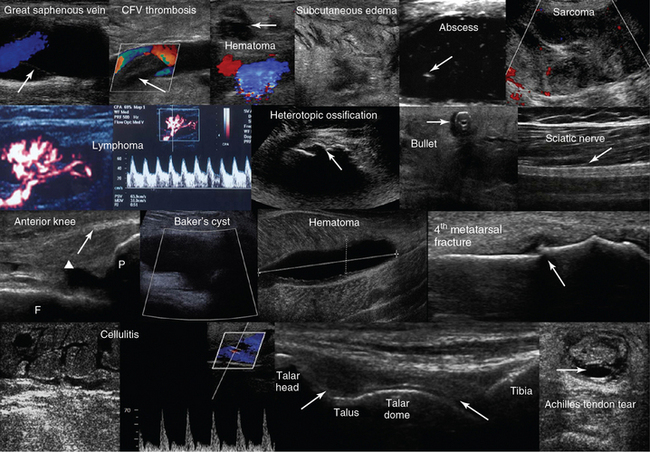
Figure 1-30 Top row, left to right, Depiction of normal venous flow in the great saphenous vein (arrow = valve); visualization of fresh thrombus in the common femoral vein (CFV); groin hematoma (arrow) overlying the common femoral artery and vein; cobblestone appearance of the subcutaneous tissue (inguinal area) resulting from edema; subcutaneous hypoechoic cyst (abscess) with hyperechoic punctiform material (arrow). Hypoechoic groin tumor with ill-defined borders (sarcoma). Second row, left to right, Lymph node with a Doppler-derived RI = 0.51 (power Doppler mode) that was initially characterized as reactive and eventually proved (biopsy) to be malignant (lymphoma) with cystic necrosis. The “zone phenomenon” in heterotopic ossification: The inner hypoechoic core is surrounded by hyperechoic mineralized islands (arrow) within the iliopsoas muscle adjacent to the hip joint. Visualization of a bullet in the area of the thigh casting an acoustic shadow (arrow, “halo” sign); posterior aspect of the thigh (longitudinal plane) illustrating the sciatic nerve (arrow). Third row, left to right, Longitudinal anterior knee view depicting the femur (F), patella (P), suprapatellar synovial recess (arrowhead), and the distal third of the quadriceps tendon (arrow); visualization of a cystic structure (absent blood flow), between the medial gastrocnemius and semimembranosus tendon, in the popliteal fossa (Baker cyst); visualization of a liquefying hematoma in the gastrocnemius muscle; longitudinal image (dorsal approach) of the fourth metatarsal bone, depicting a cortical discontinuity with step deformity and adjacent tissue damage and edema (fracture). Bottom row, left-to-right, Cobblestone appearance of the subcutaneous tissue (tibial area) and unusually increased peak systolic velocity derived by color Doppler in a local perforator (cellulitis); midlongitudinal plane over the dorsum of the ankle joint, showing the talar dome and the anterior recess of the tibiotalar joint (arrows); transverse view of a full-thickness Achilles tendon tear (arrow = hematoma). (Top row: Image of subcutaneous hypoechoic cyst courtesy Dr. J. Poularas. Image of hypoechoic groin tumor courtesy Dr. K Shanbhogue. Second row: Image of bullet in thigh courtesy Dr. K. Shanbhogue.)
Ultrasound-guided procedures and development of complex evaluation protocols14 (e.g., combination of lung, cardiac ultrasound, and vena cava analysis, linked with clinical and laboratory data to assess volume status) are examples of clinically driven modular applications of the HOLA ultrasound concept. The latter is adjustable to meet the diagnostic and monitoring specificities of individual clinical scenarios (e.g., trauma, sepsis, etc.). HOLA-CCU is easily scaled down to specific application profiles; some of those require expert input to interpret findings that should be processed under the light of clinical judgment or require special expertise.
Although CCU routinely deals with acoustical barriers, there should be no formal or subjective barriers in the way of its implementation in routine intensive care practice. HOLA ultrasound related issues are further discussed in Chapter 57 with an inclusive set of principles to phase in and implement all CCU methods and universal generic scanning of a patient in a critical care facility. We believe that a proper mass of evidence has been reached that shows ultrasound as the “wave” moving in the direction of more vigorous, operationally responsive and efficient patient care. Appropriate application of ultrasound imaging technology can offer crucial information for diagnostic determinations as well as for optimizing management in real time. The HOLA concept is, first and foremost, a means to conceptually embrace the universality of ultrasound imaging and adopt a course toward a balanced system for its use to optimize care and improve patient outcomes, facilitate direct care by intensivists, as well as to inform health care administrators and ensure their support of rapid implementation of new powerful tools for critical care optimization.
Note: The term “holistic” in the HOLA acronym is used in its original meaning in ancient Greek, to emphasize the importance of the whole and the interdependence of its parts. The term and the acronym must not be confused with “holistic medicine,” which has a different patient population, scope, and methodology. The concept of “holistic approach–critical care ultrasound,” the title of the same, and the respective acronym have been suggested by Dimitrios Karakitsos (see Chapter 57). The HOLA ultrasound project has been further refined by Ashot Ernest Sargsyan, Michael Blaivas, and Dimitrios Karakitsos. We define the HOLA concept as an approach to ultrasound imaging in emergency and critical care medicine as follows: ultrasound is part of the patient examination by a clinician, to visualize all or any parts of the body, tissues, organs, and systems in their live, anatomically, and functionally interconnected state and in the context of the whole patient’s clinical circumstances.
Pearls and highlights
• Knowledge of basic ultrasound physics and artifacts improves scanning confidence and helps avoid pitfalls.
• High-frequency transducers are used to visualize superficial structures and low-frequency transducers for scanning deeper structures; high resolution equals less penetration.
• Ultrasound machines are easy to operate and have automated features; basic machine controls and functions are still needed for image optimization and facilitate each examination.
• Ultrasound is safe if used when clinically indicated and with minimally necessary energy exposures, following the ALARA principle (As Low As Reasonably Achievable).
• Care, maintenance, and cleaning of equipment are critical.
• Most emergency ultrasound examinations are focused and ask binary questions; critical care ultrasound uses both focused techniques and complex evaluation and monitoring protocols.
• CCU is used as an adjunct to physical examination; however, ultrasound has inherent limitations related to operator abilities and the machine, patient, and ICU environment.
• The HOLA concept is based on the universality of ultrasound imaging and its real-time visual nature. In the ICU environment, HOLA is easily scaled down to specific application profiles; some of those require expert input to interpret findings that should be processed under the light of clinical judgment or require special expertise.
References
1. Stewart, HF, Stratmeyer, M. An overview of ultrasound, theory, measurement, medical applications, and biological effects. Rockville, MD: Bureau of Radiological Health, U.S. Department of Health and Human Services, Public Health Service, Food and Drug Administration; 1982.
2. Fish, P. Physics and instrumentation of diagnostic medical ultrasound. Chichester, NY: John Wiley & Sons; 1990.
3. Hedrick, WR, David, L, Hykes, D, et al. Ultrasound physics and instrumentation, ed 3. St Louis: Mosby; 1995.
4. Middleton, W, Kurtz, AB, Hertzberg, BS. Practical physics. In Middleton WD, Kurtz AB, Hertzberg BS, eds.: Ultrasound: the requisites, ed 2, St Louis: Mosby, 2004.
5. Merritt, C, Physics of ultrasound ed 4. Rumack, C, Wilson, S, Charboneau, JW, Levine, D, eds.. Diagnostic ultrasound; vol 1. Mosby/Elsevier, Philadelphia, 2011.
6. Ma, OJ, Mateer, J, Blaivas, M, Emergency ultrasound. ed 2. McGraw-Hill, New York, 2008.
7. Sanders, RC, Winter, T, Clinical sonography: a practical guide. ed 4. Lippincott Williams & Wilkins, Philadelphia, 2007.
8. Piscaglia, F, Nolsøe, C, Dietrich, CF, et al, The EFSUMB Guidelines and Recommendations on the Clinical Practice of Contrast Enhanced Ultrasound (CEUS): update 2011. on non-hepatic application. Ultraschall Me. 2012; 33:33–59.
9. Lichtenstein, D. Whole body ultrasonography in the critically ill. Berlin, Heidelberg: Springer-Verlag; 2010.
10. Lamperti, M, Bodenham, AR, Pittiruti, M, et al. International evidence-based recommendations on ultrasound-guided vascular access. Intensive Care Med. 2012; 38:1105–1117.
11. Hoppmann, R, Karakitsos, D. Ultrasound applications in critical care medicine. Crit Care Res Pract 2012; 2012. [382615].
12. Karabinis, A, Fragou, M, Karakitsos, D, Whole-body ultrasound in the intensive care unit: a new role for an aged technique. J Crit Car. 2010; 25:509–513.
13. Manno, E, Navarra, M, Faccio, L, et al, Deep impact of ultrasound in the intensive care unit: the “ICU-sound” protocol. Anesthesiolog. 2012; 117:801–809.
14. Lichtenstein, D, Karakitsos, D. Integrating lung ultrasound in the hemodynamic evaluation of acute circulatory failure (the fluid administration limited by lung sonography protocol. J Crit Care 27. 2012; 533:e11–e19.
[/level-membership-for-critical-care-medicine-category][not-level-membership-for-critical-care-medicine-category]1
Fundamentals: Essential technology, concepts, and capability
“There is geometry in the humming of the strings . . . there is music in the spacing of the spheres”
Fundamentals: Principles, terms, and concepts
Ultrasound is a mechanical wave that requires a medium to travel (i.e., human tissue), with a frequency above the audible range ceiling of 20 kHz. Ultrasound systems are tomographic devices that transmit short pulses of ultrasound into the body and measure the round-trip time and intensity of each of the numerous echoes returning after the pulse. The time of arrival of an echo determines the distance from the transducer, that is, the location of its source in the body. The intensity of the echo is converted to brightness of a given point in the image. In other words, each pixel (element of the image) on the display device corresponds to a point inside the body, and its brightness depends on the strength of the echo that came from that location. Together, all pixels form a grayscale tomographic image. Parts of the image with mostly bright pixels (a brighter overall appearance) are termed hyperechoic, as opposed to hypoechoic (darker) areas. The relative ability of an organ or tissue to produce echoes is called echogenicity, that is, tissues or structures producing hyperechoic image are considered more echogenic.1–7 Parts of the image with only black pixels are called anechoic or echo-free and mostly correspond to homogenous liquids (e.g., blood, urine, effusion, cystic fluid).
Frequency (measured in cycles per second [hertz, Hz]) is the number of wave cycles in 1 second. Frequency is determined solely by the sound source and not by the medium. Frequencies used by general-purpose ultrasound machines range between 2 and 15 megahertz (MHz). Higher frequencies, up to 40 MHz, are used for intravascular and other catheter-based applications and in specialized ophthalmologic and dermatologic techniques. Propagation speed is the velocity of sound in a given medium and is determined solely by the characteristics of the medium, such as density and stiffness (does not depend on the source of sound or its frequency). Ultrasound travels through soft tissues at a speed of approximately 1.54 mm/μsec, or 1540 m/sec). The stiffer the tissue, the greater the propagation speed (Figure 1-1). Ultrasound waves are generated by piezoelectric crystals (e.g., lead zirconate titanate, or PZT) that convert electrical energy into mechanical energy and vice versa (see Figure 1-1). Electrical pulses or short bursts of alternating voltage stimulate crystals to produce ultrasound pulses in the medium, causing displacement and oscillation of its molecules. Pressure change–Velocity of such oscillations in response to sound pressure determines the acoustic impedance (lower velocities correspond to higher impedance). As ultrasound passes from one medium to another (e.g., from gas to liquid), an impedance gradient at the tissue boundary causes a part of the energy to form a reflected wave (echo) while the remainder of the energy proceeds into the second medium.1–7 Reflection occurs every time the ultrasound pulse encounters a new boundary (reflector). Specular (mirror-like) reflectors are smooth and flat boundaries larger than the pulse dimensions (e.g., diaphragm, walls of a major vessels). The echo reflection angle equals the angle of incidence; when the beam strikes a specular reflector at 90 degrees (normal incidence, Figure 1-2), a very strong echo travels back toward the source. Nonspecular reflection, or scattering, occurs when the incident beam strikes boundaries that have irregular surface or are smaller than the beam’s dimensions, resulting in the beam’s energy scattering in multiple different directions (see Figure 1-2). The beam travels around even smaller obstacles without scattering (diffraction). Because a higher frequency results in smaller beam dimensions, obstacles diffracting at lower frequencies act as scatterers at higher frequencies. This explains both higher imaging resolution and higher beam attenuation at higher frequencies. Refraction is the redirection of a beam when striking obliquely at a boundary between two media with different propagation speeds. Unlike reflection, refraction does not contribute to the image formation process but contributes to attenuation (see Figure 1-2). Part of the ultrasound beam’s energy is transferred to the medium in the form of heat. This is absorption, which also increases proportionally to frequency in soft tissues. The bones absorb ultrasound more intensely, together with other energy loss mechanisms, producing acoustic shadows behind them. Finally, part of the original beam is converted by tissues to waves with double or higher-order frequency (harmonic waves). The total propagation losses from the combined effects of scattering, refraction, and absorption are called attenuation, which is directly proportional to frequency. Body compartments with low attenuation that allow imaging deeper structures through them are good acoustic windows (e.g., liquid cavities), while those with high attenuation are acoustic barriers (e.g., bones). The near-total loss of ultrasound at boundaries between tissues and gas makes gas the strongest barrier; nevertheless, important lung ultrasound techniques rely on the abundant artifacts that the aerated lung creates.
Figure 1-1 Propagation speed is different in different tissues (top); electrical impulses stimulate the lead zirconate titanate (PZT) crystal to produce a beam (bottom), while every time an echo is reflected back, the crystal deforms and vibrates, generating another impulse that is processed into an image.
Figure 1-2 Left panel, Reflection (top), specular reflection (middle), and refraction (bottom) of the incident beam. Right panel, Scattering occurs when the incident beam strikes boundaries that are irregular in shape (top) or smaller than the beam’s dimensions (bottom), resulting in the beam’s energy scattering in multiple different directions.
Equipment and imaging modes
Equipment
Ultrasound machines consist of electric pulse generators, transducers, systems for processing received echoes, and image display screens. Modern systems use digital technology and have central processing units running advanced software that forms beams and processes echoes and thereafter stores images. The key elements of transducers (probes) are PZT crystals, matching layers, backing material, cases, and electrical cables (Figure 1 E-1). Modern electronic transducers generate a range of frequencies (bandwidth) around the central frequency, and contain multiple crystal elements (arrays). This permits them to display the sequence of two-dimensional (2D) images so rapidly that motion is displayed as it actually occurs (real-time scanning). Main transducer types are phased array (sector), linear array, and curved array (Figure 1-3). Sector (phased array) transducers (2 to 4 MHz) have small footprints that produce images of sector format through small acoustic windows (e.g., cardiac and cranial applications). Linear array transducers (7 to 15 MHz) provide images in rectangular or trapezoidal format. They feature high resolution and shallow depth of view because their penetration into deeper structures is limited. Convex (curved array, curvilinear) transducers (2 to 6 MHz) of different shapes and sizes produce images in a sector-shaped format with a wide apex. Microconvex transducers (3 to 8 MHz) feature small footprints and are useful in difficult-access areas, such as the neonatal brain. Transducers generating frequencies of 2.5 to 5 MHz feature a larger curvature radius and are used for abdominal imaging. A variety of convex arrays operating at higher frequencies are used in intracavitary and transesophageal scanning. Finally, transducers with frequencies up to 50 MHz are used for endovascular applications and ultrasound biomicroscopy.1–7
Figure 1-3 Main types of transducers and formats of their produced images (top and middle); basic imaging modes (bottom).
Notwithstanding the similarities of all general-purpose ultrasound systems, it is critical for every user to be especially familiar with a specific machine’s features, transducer choices, and controls in advance and to practice with it sufficiently in nonemergency settings. Attempting to navigate screens or modes while resuscitating a critically ill patient can be a frustrating process. A demonstration of a common ultrasound machine and its essential controls is provided in Video 1-1. The ability to switch transducers between imaging applications or their components helps optimize image acquisition; even seemingly simple examinations, such as the extended Focused Assessment by Sonography for Trauma (e-FAST) evaluation, may require a transducer change, as well as the use of depth and gain adjustment and image optimization techniques. An e-FAST examination using several transducers is demonstrated in Video 1-2, whereas Video 1-3 shows the use of various imaging modes and may be helpful for novice ultrasound users. Some imaging modes may appear to be the prerogative of advanced users; however, novices quickly learn taking advantage of the additional information they offer. Of note, correct choice of transducers and machine settings will help ensure proper identification of pathology or estimation of physiologic parameters, whereas poor preparation may render the study ambiguous or completely nondiagnostic.
Imaging modes (see figure 1-3)
A-mode (amplitude) is a nonimaging mode no longer used in general-purpose machines. B-mode (brightness) is the main imaging mode of any ultrasound machine. Each grayscale tomographic image in B-mode is composed of pixels with brightness, that depends on the intensity of the echo received from the corresponding location in the body. M-mode (motion) displays the movement of structures along a single line (axis of the ultrasound beam) chosen by the operator (Figure 1-4). M-mode is used in the intensive care unit (ICU) for evaluating heart wall or valve motion (echocardiography), hemodynamic status (vena cava analysis), and documentation of lung sliding or movement of the diaphragm. Doppler modes detect frequency shifts created by sound reflections off a moving target (Doppler effect). A moving reflector or scatterer changes the frequency of the beam (Doppler shift), as in (Fs − Ft) = 2VFt cos Φ/c, where V = the velocity of moving blood cells, c = the propagation speed, Ft = the frequency emitted by the transducer, Fs = backscattered frequency returning to the transducer, and Φ = the angle between beam and blood flow direction). If the beam lines up in parallel with blood flow (Φ = 0 degrees), cos 0 degrees = 1 (maximum Doppler shift). If the beam is perpendicular to the blood flow (Φ = 90 degrees), velocity measurements cannot be performed because cos 90 degrees = 0 (no Doppler shift). Angles in the 45- to 60-degree range are generally preferred.7
Figure 1-4 Old and new ultrasound techniques are useful in the intensive care unit. Left, M-mode showing diaphragmatic motion during T-piece trials (spontaneous breathing): normal movement (top), deep inspiration (middle), and flat-line in hemidiaphragmatic paralysis (bottom). Right, Contrast agents “light up” the left ventricle, and an apical thrombus is revealed.
The Doppler effect is used in several modes. Color Doppler maps all Doppler shifts in the region of interest (ROI) by using a color scale over the grayscale anatomic image. The colors (usually shades of red and blue) denote flow toward and away from the transducer, regardless of the vessel’s nature (artery or vein). The power Doppler mode, also known as Doppler angiography, displays all flow within the ROI in one color (usually orange) without regard to direction and is more sensitive (Figure 1 E-2). Spectral Doppler (see Video 1-3) refers to two different techniques: pulsed wave (PW) Doppler and continuous wave (CW) Doppler. CW Doppler involves continuous (not pulsed) generation of ultrasound by one crystal and reception of echoes by another, detects all shifts along the line chosen by the operator, and detects high velocities accurately. In PW Doppler, transmission is pulsed, and reception is performed by the same crystal. The operator places a special cursor (sample volume or gate) at the point of interest (e.g., center of a vessel). Its main advantage is the ability to display a full spectrum of frequency shifts from a specific anatomic point only. However, PW Doppler is unable to measure velocities greater than 1.5 to 2 m/sec because of aliasing. The term duplex ultrasound refers to the combination of anatomic information of B-mode with either color or spectral Doppler information on the same display. Triplex ultrasound demonstrates a grayscale image, the color Doppler overlay, and the spectral Doppler graph on the same display. Color M-mode displays in color the pulsed Doppler information along a single line of interrogation versus time. The Doppler velocity shift is color-encoded and superimposed on the M-mode image, providing high temporal resolution data on the direction and timing of flow events and is used mainly in cardiovascular imaging. Tissue Doppler imaging (TDI) is a modality in which the small Doppler shifts from tissue movements (most <20 mm/sec) are detected, while higher shifts from blood flow are suppressed. It is increasingly used in echocardiography for the assessment of various aspects of myocardial performance, especially in the diastolic function and greatly contributes to the differential diagnosis and management of myocardial pathology (Figure 1 E-3).7
Figure 1 E-3 Pulsed wave, tissue Doppler imaging–derived myocardial velocities (peak myocardial velocities during systole = Sa, early = Ea, and late = Aa diastole, respectively) obtained adjacent to the tricuspid annulus (echocardiography). Reduced velocities have been documented in several disorders, such as postinferior myocardial infarction, chronic pulmonary hypertension, and chronic heart failure.
Harmonic frequencies are higher-integer multiples of the fundamental transmitted frequency that are produced as beams travels through tissues. With tissue harmonic imaging (THI), a software filter suppresses the fundamental frequency in the echoes and allows only harmonic signals to be received and processed into images. This may improve resolution and attain higher signal-to-noise ratios, minimizing the degradation effect of body wall fat. In some circumstances, however, THI image quality may actually be poor because of excessive filtering, with a resulting decrease in penetration and resolution. Anisotropic imaging is a recent evolution in ultrasound used for identifying abnormalities within normally anisotropic tissues. Anisotropy is a directional dependency of backscattered waves, which is present to varying extents in myocardium, renal cortex, tendons, and cartilage.7
Three-dimensional (3D) ultrasound acquires the anatomical information in a volume (3D) format. This technology undergoes continuous refinement as vendors seek to improve the performance and utility of 3D systems. By moving the 2D transducer in a controlled manner (linear-shift, swinging, or rotation), spatially tagged 2D data matrices are stored, to be reconstructed mathematically. 3D imaging can work with both B- and color Doppler modes, and its field of applications is constantly expanding (cardiology, obstetrics, neonatology, etc.). 3D images can be displayed in a variety of formats, including multiplanar reconstruction, surface rendering, volume rendering, and virtual endoscopy.7 This technology undergoes continuous refinement as vendors seek to improve the utility and performance of 3D systems.
Contrast-enhanced imaging has been a major development in ultrasound technology in recent years. Most contrast agents are microbubbles of gas encapsulated in a polymer shell. They are much more reflective than normal tissues and thus significantly improve B-mode and color Doppler image quality (see Figure 1-4). It is a generally safe method for cardiac imaging, vascular evaluation, and parenchymal enhancement. Microbubbles in some agents “burst” when subjected to ultrasound energy, enhancing the image even further. Potential ICU applications include detection of right-to-left shunts, thrombosis, and solid organ injury, as well as assessment of renal perfusion and demonstration of ischemia.8
When the goal is to attain unimpeded, high-resolution views of hard-to-reach tissues and structures, specialized high-frequency transducers are available. Endocavitary (vaginal, rectal) and transesophageal transducers are usually of microconvex configuration. Endoluminal imaging techniques (e.g., intravascular, endobronchial, and endourologic ultrasound) are catheter-based techniques using rotational scanning that produce 360-degree B-mode views of the vascular (ureteral, etc.) wall and adjacent tissue. Some of these invasive techniques are applied in the ICU to evaluate intraluminal disorders and guide procedures.7
Image quality and optimization
Resolution is a general term denoting the ability of the imaging method to discriminate the structural detail. The better (higher) the resolution, the greater the clarity and detail of the image. Spatial resolution (axial and lateral) refers to the ability of the B-mode to identify and display echoes from closely spaced echo-producing structures as distinct and separate objects. Axial resolution is the ability to discriminate individual echoes along the direction of the ultrasound beam (beam axis) and is approximately 0.5 to 1 mm at the operating frequency of 3.5 MHz. Higher frequencies produce better axial resolution at the expense of penetration. Lateral resolution is the ability to discriminate echoes located side by side at the same depth, and is approximately 1 to 2 mm at 3.5 MHz. Besides choosing the highest possible frequency that still penetrates to the depth of ROI, spatial resolution is improved by “focal zone” placement at the depth of the ROI (focus control) and by avoiding excessive gain settings. Contrast resolution, also known as grayscale resolution, is the ability to discriminate returning echoes of different amplitudes and assign different grayscale values to the respective pixels. Most ultrasound systems permit assignment of 256 shades of gray, which resolves the subtle differences among various structures. Increasing the contrast (less shades of gray) results in an image that is more pleasing to the human eye but likely contains less diagnostic information.1–5 Temporal resolution corresponds to the image frame rate (refresh rate), which ranges from 15 to 100 frames per second in different imaging modes and decreases when the depth or the number of focal zones is increased.
Modern portable ultrasound systems are significantly automated and similar in their user-adjustable functionality; however, controls (knobs) of the machine are still important to know. Depth (a knob or toggle switch) controls the depth of view and should be used to keep ROI in the central area of the screen (Figure 1-5). Depth is displayed along the edge of the image on a centimeter scale. Depth function alters the manner of acquisition of imaging data (preprocessing). An image at a shallower depth takes less time to form because only earlier-arriving echoes are processed, hence higher frame rates (better temporal resolution). The focus control allows moving the focal zone(s) to the ROI depth to ensure a narrower beam and therefore a better lateral resolution. The focal zone may be indicated as an arrowhead at the side of the image (usually on the depth scale). Most machines allow setting multiple focal zones; multifocusing degrades temporal resolution but improves spatial (both axial and lateral) resolution. Zoom control magnifies the selected image section without adding new information or changing the data acquisition (postprocessing). Some systems have an additional “high-definition zoom” option, whereas the machine’s beam-forming and data-processing capabilities are mobilized from other areas to optimize the image of the ROI.
Figure 1-5 “Knobology”: Left, Too-shallow image depth (top) and correct depth adjustment (bottom) to depict the region of interest (ROI, liver). Middle, Image with inappropriate (high) gain (top) and correctly gained (bottom). Right, Increased color gain and large color box that is inappropriately angled (top) resulting in aliasing (common carotid artery) and properly sized and angled color-box with adjusted color gain to perform color Doppler measurements (bottom).
Gain adjusts overall image brightness by amplifying electronic echo signals; thus it works only on the receiving side and has no impact on transmitted power or bioeffects. Gain must be adjusted to such a level that anechoic structures (e.g., fluids) appear black on screen. Using too much gain can degrade the image and create artifacts, and using too little gain can negate real echo data (see Figure 1-5). In addition, most machines also have time gain compensation (TGC) controls (usually a group of slider rheostats) to adjust the gain selectively at various depths. To compensate for attenuation, echoes are electronically amplified proportional to the depth of their origin (i.e., time of their return to the transducer). TGC controls need readjustment when, for example, a large fluid-filled window is used; otherwise, the ROI behind the window will be too bright (overamplified). Further improvement of B-mode image quality can sometimes be achieved by THI.1–5
PRF is the rate of pulses used to analyze the Doppler shift. For PW Doppler measurements of arterial flow, PRF is generally set at 3000 to 4000 pulses/second or Hz, which allows a wide enough Doppler range to fit spectra with most arterial velocities. If the actual shifts exceed the scale, the peak part of the spectrum in excess of the scale appears in the wrong place (PW Doppler) or in the wrong color (color Doppler). This phenomenon is called aliasing, and the Doppler shift limit at which it occurs is called the Nyquist limit and equals 1⁄2 PRF. In color Doppler, aliasing is avoided by increasing the scale (PRF) and/or using the baseline control to dedicate a larger portion of the scale to the flow in the dominant direction (toward or away from the probe), and/or by increasing the angle between the ultrasound beam and the flow vector (e.g., from 45 to 60 degrees) to reduce the actual shifts. In spectral Doppler, similar controls are available. In veins with much lower flow velocities, a PRF setting of 1000 Hz is a typical starting frequency. Modern machines have built-in “presets” for arterial and venous examinations, with PRF set to appropriate values. Older machines may have to be adjusted manually, including frequency filters. In PW Doppler, sample volume (also known as gate) size and placement are essential for correct measurements. A smaller sample volume of 1 to 2 mm is used when detailed investigation of flow within the vessel is required (e.g., when the degree of flow turbulence is to be assessed). The sample volume is placed in the center of the vessel or at the point of peak velocity indicated by the color image. In cases where blood flow is reduced (e.g., venous circuits) a larger sample volume may be appropriate. The Doppler spectral waveforms are produced by spectral analysis of the frequencies contained in the echoes returning from the sample volume area, using real-time fast Fourier transform or similar algorithms.1–5
