[level-membership-for-critical-care-medicine-category]33
Evaluation of right ventricular function in the intensive care unit by echocardiography
(CONSULTANT-LEVEL EXAMINATION)
Overview
Assessment of right ventricular (RV) function is a key element in the hemodynamic evaluation of patients in the intensive care unit (ICU) with shock or respiratory failure.1,2 For several decades the former was considered to play a minor role in hemodynamic failure. However, RV dysfunction may be a crucial element in the hemodynamic compromise that intensivists encounter in various clinical scenarios such as pulmonary embolism (PE), sepsis and septic shock, myocardial infarction, and acute respiratory distress syndrome (ARDS).3–5 The right ventricle is highly sensitive to changes in preload and afterload and, unlike the left ventricle (LV), may become acutely enlarged. A pulmonary artery catheter can be used to estimate right atrial pressure (RAP), pulmonary arterial pressure (PAP) and resistance, and cardiac output. In recent years, echocardiography has progressively replaced the former in the ICU. Echocardiography facilitates accurate, noninvasive, prompt, and serial evaluation of RV function in ICU patients.
Right ventricular physiology
The configuration of the right ventricle is rather complex in that it has two perpendicular chambers—a horizontal one corresponding to the filling chamber (the sinus) and a vertical one corresponding to the outflow tract (the cone or infundibulum). The right ventricle has a normal free wall thickness of 4 mm and is less muscular than the LV since it is adapted to the pulmonary vasculature. It is very sensitive to changes in afterload and becomes acutely dilated; its ejection fraction is radically decreased whenever abrupt increments in PAP occur. In the latter case, RV pressure may become transiently greater than pressure in the LV and thus cause end-systolic bowing of the interventricular septum into the LV.6,7 Chronically increased PAP induces RV hypertrophy. Because the heart is enveloped by the pericardium and the right ventricle is wrapped around the LV, any modification in one ventricle will modify the size and the function of the other (left-right ventricular interdependency). The LV normally contributes 25% of RV contraction, which may be increased up to 35% in patients with pulmonary hypertension.7,8 The right ventricle is very sensitive to coronary flow and is perfused, unlike the LV, during both systole and diastole.9
Evaluation of right ventricular function by echocardiography
Right ventricular size
RV size may be assessed by measurement of volume. Two-dimensional (2D) echocardiography is unable to provide an accurate estimate of RV volume because of its complex shape. Three-dimensional (3D) echocardiography is more accurate. However, it is time-consuming and not yet readily available, and a perfect view of the endocardial contour is required (which is hard to achieve in the critically ill). Vieillard Baron et al proposed measuring the right (RVEDA) and left (LVEDA) ventricular end-diastolic areas by tracing the endocardium on an apical four-chamber view.10 When the endocardium is not well identified, the area should be traced to the epicardium. The RVEDA/LVEDA ratio was assessed in normal subjects and found to vary between 0.36 and 0.60. Thus a ratio lower than 0.6 (Table 33-1) is considered normal, whereas ratios between 0.6 and 1 and higher than 1 correspond to moderate and severe RV dilatation, respectively (Figures 33-1 and 33-2). This sonographic evaluation is performed by using either transthoracic (TTE) or transesophageal (TEE) echocardiography.10 The American Society of Echocardiography and the European Association of Echocardiography have published guidelines for evaluation of RV function by echocardiography11; Howeverhowever, several of the recommendations are not easily applicable in the ICU.
TABLE 33-1
Evaluation of Right Ventricular Function by Echocardiography: Abnormal Values of Various Doppler and Two-Dimensional Echocardiographic Indices
| Abnormal Value | |
| Maximal RV diameter (parasternal view) (see Figure 33-3) | >42 mm |
| RVEDA/LVEDA (apical 4-chamber view) (see Figures 33-1 and 33-2) | >0.6 |
| RV two-dimensional fractional area contraction (apical four-chambers view) | <35% |
| RV ejection fraction | <44% |
| RV free wall thickness | >4 mm |
| SPAP (on tricuspid regurgitation or pulmonary regurgitation; see Figures 33-5 and 33-6C) | >35-40 mm Hg |
| TAPSE (see Figure 33-4A) | <16 mm |
| S on TDI (see Figure 33-4B) | <0 cm/sec |
Data from Jardin F, Dubourg O, Bourdarias JP: Echocardiographic pattern of acute cor pulmonale, Chest 111:209-217, 1997; and Rudski LG, Lai WW, Afilalo J, et al: Guidelines for the echocardiographic assessment of the right heart in adults: a report from the American Society of Echocardiography endorsed by the European Association of Echocardiography, a registered branch of the European Society of Cardiology, and the Canadian Society of Echocardiography, J Am Soc Echocardiogr 23:685-713, quiz 786-788, 2010.
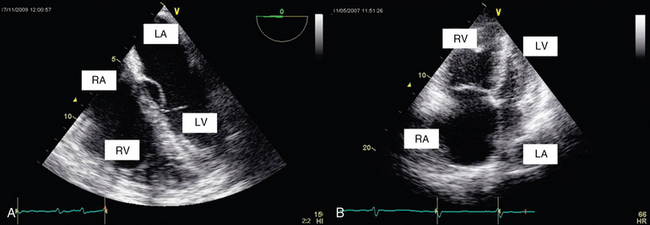
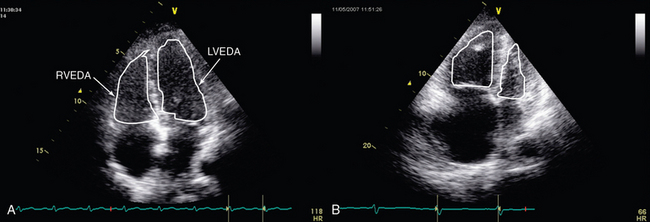
Figure 33-2 Transthoracic echocardiographic apical four-chamber view: assessment of the ratio of right ventricular to left ventricular end-diastolic area in a normal patient (A) and one with acute cor pulmonale (B).
Alterations in RV shape may be used to assess dilatation. As it dilates, the right ventricle loses its characteristic triangular shape and becomes more rounded. Quantitative measurement of RV size by means of the RVEDA/LVEDA ratio is simple and has good reproducibility. Charon et al proposed using subjective (qualitative) assessment of RV size by eyeballing the right ventricle on an apical four-chamber view since they found significant correlation with measurements of the RVEDA/LVEDA ratio.12 The subcostal view, which is usually more accessible than other views (e.g., apical) in mechanically ventilated patients, may be used to perform RV measurements in the ICU.
Interventricular septal shape and movement
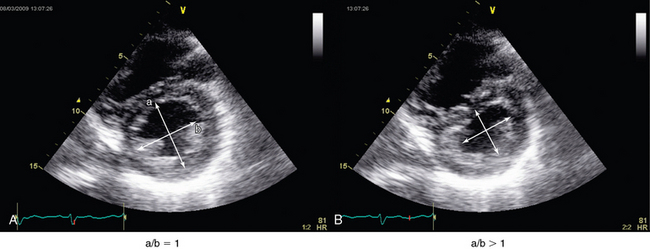
The interventricular septum should be analyzed in patients with RV dysfunction. It is best analyzed on a parasternal short-axis view at the level of left ventricular papillary muscles. In normal subjects, left ventricular pressure is always higher than RV pressure. Consequently, on a parasternal short-axis view the septum bows into the right ventricle, thus giving the LV its circular shape (O shape). Whenever RV systolic overload occurs, RV end-systolic pressure exceeds that in the LV (because of a prolongation in RV contraction), and this causes the interventricular septum to move toward the LV (septal dyskinesia). This flattening of the septum produces a D-shaped LV and represents a qualitative assessment of this paradoxic septal movement. In addition, a quantitative evaluation can be achieved by direct measurement of the systolic eccentricity index.10–12 The latter, which is measured on a parasternal short-axis view at the level of left ventricular papillary muscles, is the ratio of the diameter that bisects the papillary muscle to the perpendicular diameter at end-systole. In septal dyskinesia, the systolic eccentricity index is higher than 1 (Figure 33-3; also see Figure 33-2).
Assessment of right ventricular systolic function
Right ventricular fractional area change
Percent RV fractional area change (RVFAC) has been shown to correlate with the RV ejection fraction (RVEF) obtained via cardiac magnetic resonance imaging.13,14 RVFAC is calculated by tracing the RV endocardium in both systole and diastole from the annulus along the free wall to the apex and back to the annulus along the interventricular septum (apical four-chamber view). Normal RVFAC values are usually greater than 35% to 40% (see Table 33-1).11 Several experts consider RVFAC a simple and reliable measure for assessing RV function and monitoring the effects of therapy (e.g., administration of vasoactive substances).
Tricuspid annular plane systolic excursion
Tricuspid annular plane systolic excursion (TAPSE) measures the distance of tricuspid annulus systolic excursion at the RV lateral wall level by placing an M-mode cursor through the tricuspid annulus (four-chamber apical view, Figure 33-4A). TAPSE-derived values lower than 16 mm indicate RV dysfunction. TAPSE is easy to record, simple, and reproducible, but it depends on preload and afterload conditions, as well as on left ventricular function.11,15
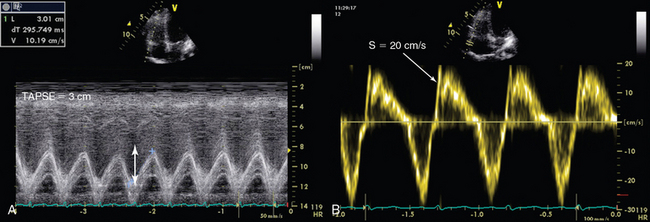
Tissue doppler imaging of the tricuspid annulus
The longitudinal velocity of tricuspid annulus excursion is assessed by tissue Doppler imaging. On a four-chamber apical view the Doppler sample volume is placed at the level of the junction of the tricuspid annulus and the RV lateral wall (Figure 33-4B). The recorded systolic velocity is called “S.” S is simple to record and reproducible. An S velocity lower than 10 cm/sec is usually associated with an RVEF lower than 50%.11,16
Estimation of pulmonary arterial pressure
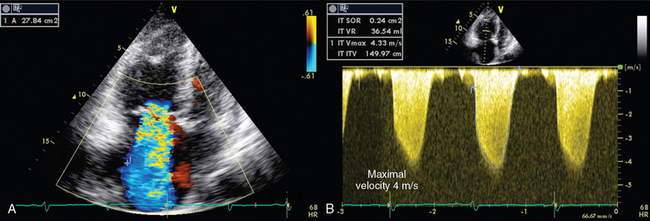
Systolic pressure, diastolic pressure, and mean PAP can be estimated from tricuspid (TR) and pulmonary (PR) regurgitant flow by using the simplified Bernoulli equation. Trivial pulmonary and tricuspid regurgitation occurs frequently in normal subjects and may be recorded on color and continuous wave Doppler.17 Peak TR velocity corresponds to the maximal systolic gradient between the right ventricle and the right atrium. By adding RAP to this gradient it is possible to estimate RV systolic pressure, which in the absence of pulmonary valve stenosis, is equal to systolic PAP (Figure 33-5 and see Imaging Case Figure 33-6C).11 In the ICU, RAP can also be measured with a central venous catheter or be estimated from the size and collapsibility of the inferior vena cava (IVC).11 Systolic PAP in excess of 35 to 40 mm Hg is considered high. Diastolic pressure and mean PAP can be estimated from the end-diastolic and peak velocity of PR flow, respectively. Pulsed wave Doppler of RV outflow was shown to be useful in assessing pulmonary hypertension. Acceleration time (time between the pulmonary valve opening and maximal velocity of pulmonary flow) correlates to PAP. A time to peak velocity of less than 100 msec is associated with pulmonary hypertension and a time shorter than 60 msec is associated with PAP higher than 60 mm Hg, whereas the presence of a midsystolic deceleration (notch) is indicative of pulmonary hypertension secondary to PE with proximal obstruction.18–20
Acute cor pulmonale
Acute cor pulmonale (ACP) occurs as a result of acute increments in PAP that may be attributed to various causes (e.g., ARDS, PE). ACP is characterized by systolic and diastolic RV overload. With RV dilatation, increments in the RVEDA/LVEDA ratio are usually observed; the former can equally be assessed by eyeballing, as mentioned in previous pargraphs.10 The RVEDA/LVEDA ratio has good prognostic value, especially in patients with PE.21,22 As the right ventricle dilates, various alterations in its configuration may be evident: it appears more rounded on apical four-chamber views and oval (rather than crescent shaped) on parasternal views. Alternatively, subcostal views can be used in patients with poor parasternal or apical windows.21 Also, right atrial and IVC enlargement can occur as a result of increased RV preload, and left ventricular size is reduced because of RV enlargement.22 Hence mitral flow recordings (pulsed wave Doppler, four-chamber view) show a pattern of impaired relaxation with a decreased E/A ratio of less than 1. The D-shaped configuration of the LV (parasternal short-axis view) and an eccentricity index higher than 1 can also be attributed to the aforementioned ventricular interdependency (see Figure 33-3), whereas pulmonary hypertension is featured by high-velocity TR flow (0.3 m/sec) (see Figure 33-5).
Chronic cor pulmonale
RV dilatation, abnormal septal motion, and pulmonary hypertension may be due to chronic disorders such as left ventricular failure, chronic pulmonary hypertension secondary to lung disease, primary pulmonary hypertension, or congenital cardiovascular disorders. The RV free wall thickens in chronic pulmonary hypertension, and LV hypertrophy is not rare.23 In ACP, RV hypertrophy can develop rapidly (within 48 hours of PAP elevation), but it is usually moderate (around 4 to 6 mm), whereas in chronic cases the RV wall may thicken to as much as 10 to 11 mm (usually .7 mm). RV free wall thickness is measured from the subcostal view at end-diastole.10,11 If ACP suddenly develops on the grounds of chronic pulmonary hypertension, ruling out left ventricular pathology such as severe valve disorders, prosthetic valve dysfunction, or acute myocardial failure is mandatory.
Cor pulmonale in various clinical scenarios
ARDS is associated with ACP in 20% to 40% of cases. It may be attributed to various factors, such as regional occlusion of the pulmonary vascular bed and increments in RV afterload secondary to compression of pulmonary capillaries by high plateau pressure, as well as acidosis and hypoxemia, which increase pulmonary vasoconstriction. Monitoring of RV function by serial echocardiographic examination aids in optimizing mechanical ventilation strategies: adjust tidal volume and plateau pressure, monitor the effect of positive end-expiratory pressure (PEEP), and decide whether to place patients prone.24 Notably, PE is associated with RV dysfunction in 25% to 70% of cases.25,26 The latter variation may be partially due to miscellaneous definitions used to describe RV dilatation or dysfunction. For example, RV dilatation has been featured as an RVEDA/LVEDA ratio higher than 1 or an RV end-diastolic diameter greater than 30 mm (from a precordial view), whereas RV dysfunction has been described as global hypokinesia, hypokinesia sparing the apex (McConnell sign),27 paradoxic septal movements, and pulmonary hypertension without RV hypertrophy. However, RV dysfunction seems to have strong prognostic value in PE.25 Recently, Platz et al28 used speckle-tracking software to show that in acute PE, RV free wall longitudinal strain was altered and mid and basal septum strain rates were reduced (only in the RV free wall), even in absence of dilatation. Though not usually identified by TTE or TEE, in cases of PE, clots may appear as mobile and serpiginous structures in the right ventricle or atrium, as well as in the right or main pulmonary arteries.
RV dysfunction can be responsible for pulse pressure variations (PPVs) in mechanically ventilated patients, which may be erroneously interpreted as a sign of fluid responsiveness and thus lead to fluid loading.29 This may be due to the effect of positive-pressure ventilation on RV afterload (and not on preload). Therefore, when predicting fluid responsiveness in patients with RV dilatation or dysfunction, PPV measurements are considered false-positive ones.30 In septic shock, RV dysfunction is usually accompanied by left ventricular systolic dysfunction.31 This septic myocardial depression tends to occur early and recover completely within 7 to 10 days.
IMAGING CASE
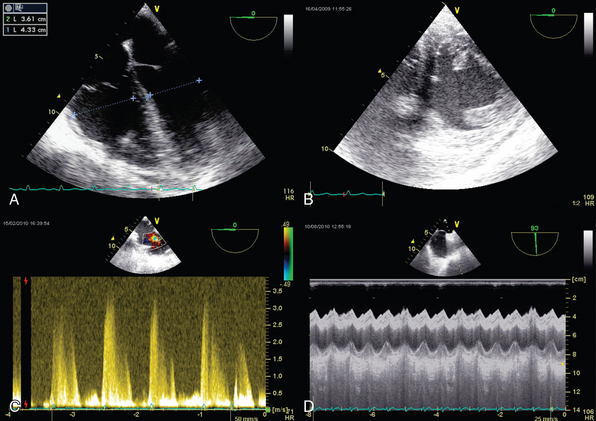
Figure 33-6
A 76-year-old woman was admitted to our unit with septic shock secondary to pneumococcal pneumonia. On day 5 acute lung injury developed, and thereafter she was intubated and mechanically ventilated (tidal volume, 8 mL/kg; Fio2, 100%; PEEP, 10 cm H2O; respiratory rate, 25 breaths/min; plateau pressure, 35 cm H2O). On day 6 hemodynamic failure developed (mean arterial pressure, 50 mm Hg; PPV, 22%). Echocardiography revealed ACP with severe RV dilatation (Figure 33-6A) and paradoxic septal movement (Figure 33-6B). We found moderate tricuspid regurgitation with a maximal velocity of 3.4 m/sec, which corresponds to a gradient of 36 mm Hg (4 × 3.42) between the right ventricle and right atrium. Central venous pressure was 14 mm Hg, and thus PAP was estimated to be 50 mm Hg (gradient 1 RAP = 36 + 14 = 50 mm Hg) (Figure 33-6C). Superior vena cava analysis confirmed that the patient was not fluid responsive despite a PPV of 22%, which was due to an inspiratory RV afterload effect (Figure 33-6D). After decreasing tidal volume and plateau pressure, mean arterial pressure increased as ACP subsided.
Pearls and highlights
• The right ventricle is highly sensitive to changes in preload and afterload and, unlike the LV, may become acutely enlarged. Moreover, it is sensitive to coronary flow and is perfused during the entire cardiac cycle.
• Though a key element in the hemodynamic evaluation of ICU patients with shock (e.g., PE, sepsis) or respiratory failure (e.g., ARDS), RV dysfunction remained an underdiagnosed clinical entity in the ICU for several decades.
• The echocardiographic techniques that are used to evaluate RV function can optimize the management of mechanically ventilated patients with RV dysfunction in various clinical scenarios.
• Several experts consider RVFAC a simple and reliable measure for assessing RV function and monitoring the effects of therapy (e.g., administration of vasoactive substances).
• An RVEDA/LVEDA ratio lower than 0.6 is considered normal, whereas ratios between 0.6 and 1 and higher than 1 correspond to moderate and severe RV dilatation, respectively. This ratio has good prognostic value for ACP, especially in patients with PE.
• In ACP, RV hypertrophy can develop rapidly (within 48 hours of PAP elevation) but is usually moderate (around 4 to 6 mm), whereas in chronic cases the RV free wall may thicken to as much as 10 to 11 mm (usually 0.7 mm).
References
1. , Expert Round Table on Ultrasound in ICU: International expert statement on training standards for critical care ultrasonography. Intensive Care Me. 2011; 37:1077–1083.
2. Mayo, PH, Beaulieu, Y, Doelken, P, et al. American College of Chest Physicians/La Société de Réanimation de Langue Française statement on competence in critical care ultrasonography. Chest. 2009; 135:1050–1060.
3. Vieillard-Baron, A, Qanadli, SD, Antakly, Y, et al, Transesophageal echocardiography for the diagnosis of pulmonary embolism with acute cor pulmonale: a comparison with radiological procedures,. Intensive Care Me. 1998; 24:429–433.
4. Jardin, F, Dubourg, O, Bourdarias, JP. Echocardiographic pattern of acute cor pulmonale. Chest. 1997; 111:209–217.
5. Vieillard-Baron, A. Septic cardiomyopathy. Ann Intensive Care. 2011; 1:6–10.
6. Hoffman, D, Sisto, D, Frater, RW, Nikolic, SD. Left-to-right ventricular interaction with a noncontracting right ventricle. J Thorac Cardiovasc Surg. 1994; 107:1496–1502.
7. Jardin, F, Farcot, JC, Boisante, L, et al. Influence of positive end-expiratory pressure on left ventricular performance. N Engl J Med. 1981; 304:387–392.
8. Redington, AN, Gray, HH, Hodson, ME, et al. Characterisation of the normal right ventricular pressure-volume relation by biplane angiography and simultaneous micromanometer pressure measurements. Br Heart J. 1988; 59:23–30.
9. Cross, C. Right ventricular pressure and coronary flow. Am J Physiol. 1962; 202:12–16.
10. Vieillard-Baron, A, Prin, S, Chergui, K, et al. Echo-Doppler demonstration of acute cor pulmonale at the bedside in the medical intensive care unit. Am J Respir Crit Care Med. 2002; 166:1310–1319.
11. Rudski, LG, Lai, WW, Afilalo, J, et al, Guidelines for the echocardiographic assessment of the right heart in adults: a report from the American Society of Echocardiography endorsed by the European Association of Echocardiography, a registered branch of the European Society of Cardiology, and the Canadian Society of Echocardiography. J Am Soc Echocardiog. 2010; 23:685–713. [quiz 786-788].
12. Charon, C, Prat, G, Caille, V, et al. Validation of a skills assessment scoring system for transesophageal echocardiographic monitoring of hemodynamics. Intensive Care Med. 2007; 33:1712–1718.
13. Lai, WW, Gauvreau, K, Rivera, ES, et al. Accuracy of guideline recommendations for two-dimensional quantification of the right ventricle by echocardiography. Int J Cardiovasc Imaging. 2008; 24:691–698.
14. Anavekar, NS, Gerson, D, Skali, H, et al, Two-dimensional assessment of right ventricular function: an echocardiographic-MRI correlative study. Echocardiograph. 2007; 24:452–456.
15. Lamia, B, Teboul, JL, Monnet, X, et al. Relationship between the tricuspid annular plane systolic excursion and right and left ventricular function in critically ill patients. Intensive Care Med. 2007; 33:2143–2149.
16. Miller, D, Farah, MG, Liner, A, et al. The relation between quantitative right ventricular ejection fraction and indices of tricuspid annular motion and myocardial performance. J Am Soc Echocardiogr. 2004; 17:443–447.
17. Jobic, Y, Slama, M, Tribouilloy, C, et al. Doppler echocardiographic evaluation of valve regurgitation in healthy volunteers. Br Heart J. 1993; 69:109–113.
18. Kitabatake, A, Inoue, M, Asao, M, et al. Noninvasive evaluation of pulmonary hypertension by a pulsed Doppler technique. Circulation. 1983; 68:302–309.
19. Torbicki, A, Kurzyna, M, Ciurzynski, M, et al. Proximal pulmonary emboli modify right ventricular ejection pattern. Eur Respir J. 1999; 13:616–621.
20. Okamoto, M, Miyatake, K, Kinoshita, N, et al. Analysis of blood flow in pulmonary hypertension with the pulsed Doppler flowmeter combined with cross sectional echocardiography. Br Heart J. 1984; 51:407–415.
21. Fremont, B, Pacouret, G, Jacobi, D, et al, Prognostic value of echocardiographic right/left ventricular end-diastolic diameter ratio in patients with acute pulmonary embolism: results from a monocenter registry of 1,416 patients. Ches. 2008; 133:358–362.
22. Vieillard-Baron, A, Schmitt, JM, Augarde, R, et al, Acute cor pulmonale in acute respiratory distress syndrome submitted to protective ventilation: incidence, clinical implications, and prognosis. Crit Care Me. 2001; 29:1551–1555.
23. Jardin, F, Gueret, P, Prost, JF, et al. Two-dimensional echocardiographic assessment of left ventricular function in chronic obstructive pulmonary disease. Am Rev Respir Dis. 1984; 129:135–142.
24. Bouferrache, K, Vieillard-Baron, A. Acute respiratory distress syndrome, mechanical ventilation, and right ventricular function. Curr Opin Crit Care. 2011; 17:30–35.
25. Wolde, M, Söhne, M, Quak, E, et al. Prognostic value of echocardiographically assessed right ventricular dysfunction in patients with pulmonary embolism. Arch Intern Med. 2004; 164:1685–1689.
26. Grifoni, S, Olivotto, I, Cecchini, P, et al. Short-term clinical outcome of patients with acute pulmonary embolism, normal blood pressure, and echocardiographic right ventricular dysfunction. Circulation. 2000; 101:2817–2822.
27. McConnell, MV, Solomon, SD, Rayan, ME, et al. Regional right ventricular dysfunction detected by echocardiography in acute pulmonary embolism. Am J Cardiol. 1996; 78:469–473.
28. Platz, E, Hassanein, AH, Shah, A, et al. Regional right ventricular strain pattern in patients with acute pulmonary embolism. Echocardiography. 2012; 29:464–470.
29. Michard, F, Boussat, S, Chemla, D, et al. Relation between respiratory changes in arterial pulse pressure and fluid responsiveness in septic patients with acute circulatory failure. Am J Respir Crit Care Med. 2000; 162:134–138.
30. Mahjoub, Y, Pila, C, Friggeri, A, et al, Assessing fluid responsiveness in critically ill patients: false-positive pulse pressure variation is detected by Doppler echocardiographic evaluation of the right ventricle. Crit Care Me. 2009; 37:2570–2575.
31. Vieillard Baron, A, Schmitt, JM, Beauchet, A, et al. Early preload adaptation in septic shock? A transesophageal echocardiographic study. Anesthesiology. 2001; 94:400–406.
[/level-membership-for-critical-care-medicine-category][not-level-membership-for-critical-care-medicine-category]33
Evaluation of right ventricular function in the intensive care unit by echocardiography
(CONSULTANT-LEVEL EXAMINATION)
Overview
Assessment of right ventricular (RV) function is a key element in the hemodynamic evaluation of patients in the intensive care unit (ICU) with shock or respiratory failure.1,2 For several decades the former was considered to play a minor role in hemodynamic failure. However, RV dysfunction may be a crucial element in the hemodynamic compromise that intensivists encounter in various clinical scenarios such as pulmonary embolism (PE), sepsis and septic shock, myocardial infarction, and acute respiratory distress syndrome (ARDS).3–5 The right ventricle is highly sensitive to changes in preload and afterload and, unlike the left ventricle (LV), may become acutely enlarged. A pulmonary artery catheter can be used to estimate right atrial pressure (RAP), pulmonary arterial pressure (PAP) and resistance, and cardiac output. In recent years, echocardiography has progressively replaced the former in the ICU. Echocardiography facilitates accurate, noninvasive, prompt, and serial evaluation of RV function in ICU patients.
Right ventricular physiology
The configuration of the right ventricle is rather complex in that it has two perpendicular chambers—a horizontal one corresponding to the filling chamber (the sinus) and a vertical one corresponding to the outflow tract (the cone or infundibulum). The right ventricle has a normal free wall thickness of 4 mm and is less muscular than the LV since it is adapted to the pulmonary vasculature. It is very sensitive to changes in afterload and becomes acutely dilated; its ejection fraction is radically decreased whenever abrupt increments in PAP occur. In the latter case, RV pressure may become transiently greater than pressure in the LV and thus cause end-systolic bowing of the interventricular septum into the LV.6,7 Chronically increased PAP induces RV hypertrophy. Because the heart is enveloped by the pericardium and the right ventricle is wrapped around the LV, any modification in one ventricle will modify the size and the function of the other (left-right ventricular interdependency). The LV normally contributes 25% of RV contraction, which may be increased up to 35% in patients with pulmonary hypertension.7,8 The right ventricle is very sensitive to coronary flow and is perfused, unlike the LV, during both systole and diastole.9
Evaluation of right ventricular function by echocardiography
Right ventricular size
RV size may be assessed by measurement of volume. Two-dimensional (2D) echocardiography is unable to provide an accurate estimate of RV volume because of its complex shape. Three-dimensional (3D) echocardiography is more accurate. However, it is time-consuming and not yet readily available, and a perfect view of the endocardial contour is required (which is hard to achieve in the critically ill). Vieillard Baron et al proposed measuring the right (RVEDA) and left (LVEDA) ventricular end-diastolic areas by tracing the endocardium on an apical four-chamber view.10 When the endocardium is not well identified, the area should be traced to the epicardium. The RVEDA/LVEDA ratio was assessed in normal subjects and found to vary between 0.36 and 0.60. Thus a ratio lower than 0.6 (Table 33-1) is considered normal, whereas ratios between 0.6 and 1 and higher than 1 correspond to moderate and severe RV dilatation, respectively (Figures 33-1 and 33-2). This sonographic evaluation is performed by using either transthoracic (TTE) or transesophageal (TEE) echocardiography.10 The American Society of Echocardiography and the European Association of Echocardiography have published guidelines for evaluation of RV function by echocardiography11; Howeverhowever, several of the recommendations are not easily applicable in the ICU.
TABLE 33-1
Evaluation of Right Ventricular Function by Echocardiography: Abnormal Values of Various Doppler and Two-Dimensional Echocardiographic Indices
| Abnormal Value | |
| Maximal RV diameter (parasternal view) (see Figure 33-3) | >42 mm |
| RVEDA/LVEDA (apical 4-chamber view) (see Figures 33-1 and 33-2) | >0.6 |
| RV two-dimensional fractional area contraction (apical four-chambers view) | <35% |
| RV ejection fraction | <44% |
| RV free wall thickness | >4 mm |
| SPAP (on tricuspid regurgitation or pulmonary regurgitation; see Figures 33-5 and 33-6C) | >35-40 mm Hg |
| TAPSE (see Figure 33-4A) | <16 mm |
| S on TDI (see Figure 33-4B) | <0 cm/sec |
Data from Jardin F, Dubourg O, Bourdarias JP: Echocardiographic pattern of acute cor pulmonale, Chest 111:209-217, 1997; and Rudski LG, Lai WW, Afilalo J, et al: Guidelines for the echocardiographic assessment of the right heart in adults: a report from the American Society of Echocardiography endorsed by the European Association of Echocardiography, a registered branch of the European Society of Cardiology, and the Canadian Society of Echocardiography, J Am Soc Echocardiogr 23:685-713, quiz 786-788, 2010.
Figure 33-2 Transthoracic echocardiographic apical four-chamber view: assessment of the ratio of right ventricular to left ventricular end-diastolic area in a normal patient (A) and one with acute cor pulmonale (B).
Alterations in RV shape may be used to assess dilatation. As it dilates, the right ventricle loses its characteristic triangular shape and becomes more rounded. Quantitative measurement of RV size by means of the RVEDA/LVEDA ratio is simple and has good reproducibility. Charon et al proposed using subjective (qualitative) assessment of RV size by eyeballing the right ventricle on an apical four-chamber view since they found significant correlation with measurements of the RVEDA/LVEDA ratio.12 The subcostal view, which is usually more accessible than other views (e.g., apical) in mechanically ventilated patients, may be used to perform RV measurements in the ICU.
Interventricular septal shape and movement
The interventricular septum should be analyzed in patients with RV dysfunction. It is best analyzed on a parasternal short-axis view at the level of left ventricular papillary muscles. In normal subjects, left ventricular pressure is always higher than RV pressure. Consequently, on a parasternal short-axis view the septum bows into the right ventricle, thus giving the LV its circular shape (O shape). Whenever RV systolic overload occurs, RV end-systolic pressure exceeds that in the LV (because of a prolongation in RV contraction), and this causes the interventricular septum to move toward the LV (septal dyskinesia). This flattening of the septum produces a D-shaped LV and represents a qualitative assessment of this paradoxic septal movement. In addition, a quantitative evaluation can be achieved by direct measurement of the systolic eccentricity index.10–12 The latter, which is measured on a parasternal short-axis view at the level of left ventricular papillary muscles, is the ratio of the diameter that bisects the papillary muscle to the perpendicular diameter at end-systole. In septal dyskinesia, the systolic eccentricity index is higher than 1 (Figure 33-3; also see Figure 33-2).
