[level-membership-for-radiology-category]15
Evaluating statistics – explanations of terminology in general use
1. Reliability – reproducibility of results. (These may be from the same observer or from different observers.) Assessment of this can be built into a study of diagnostic accuracy of a technique, or evaluated beforehand.
2. Accuracy: ‘proportion of results (positive and negative) which agree with the final diagnosis’, i.e.
3. Sensitivity – ‘proportion of diseased patients who are reported as positive’, i.e.

4. Specificity – ‘proportion of disease-free patients who are reported as negative’, i.e.

5. Positive predictive value – ‘proportion of patients reported positive who have the disease’, i.e.

6. Negative predictive value – ‘proportion of patients reported negative who do not have the disease’, i.e.

Predictive values are now in common use to indicate the usefulness of an imaging test. However, these depend on sensitivity, specificity and prevalence and therefore only apply to settings with a similar prevalence. Formulae are available for calculation of predictive values for different prevalences – see Further Reading.
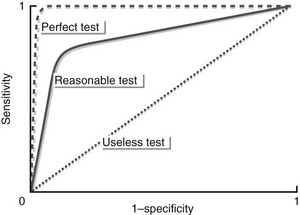
7. Receiver operating characteristics (ROC) curves – in many situations it is not possible to be definitely positive or definitely negative when reporting. With this method approximately five or six levels of certainty may be used in reporting (e.g. 1 = definitely positive, 2 = probably positive, etc.). Using each of these levels in turn as the point of cut-off between a ‘definitely positive’ and a ‘definitely negative’ result, the sensitivity and specificity for each level are then plotted in the form of a graph of sensitivity against 1 − specificity. The area under the curve will be 1.0 for a perfect technique (or observer) and 0.5 for an absolutely useless technique (or observer!) (see figure).
[/level-membership-for-radiology-category][not-level-membership-for-radiology-category]15
Evaluating statistics – explanations of terminology in general use
1. Reliability – reproducibility of results. (These may be from the same observer or from different observers.) Assessment of this can be built into a study of diagnostic accuracy of a technique, or evaluated beforehand.
2. Accuracy: ‘proportion of results (positive and negative) which agree with the final diagnosis’, i.e.
3. Sensitivity – ‘proportion of diseased patients who are reported as positive’, i.e.
4. Specificity – ‘proportion of disease-free patients who are reported as negative’, i.e.
[/not-level-membership-for-radiology-category]
