Objectives
• Discuss the assessment and management of adrenal dysfunction in critical illness.
• Describe the management of hyperglycemia in critical illness.
• Compare and contrast etiology and management of type 1 and type 2 diabetes.
• Describe the use of intensive insulin therapy in the critical care unit.
• Compare and contrast management of diabetic ketoacidosis and hyperglycemic hyperosmolar syndrome.
• Discuss the nursing priorities for managing a patient with diabetes insipidus.
• List three causes of the syndrome of inappropriate secretion of antidiuretic hormone.

Be sure to check out the bonus material, including free self-assessment exercises, on the Evolve web site at http://evolve.elsevier.com/Urden/priorities/.
The endocrine system is almost invisible when it functions well, but it causes widespread upset when an organ is overly suppressed, stimulated, or under physiological stress. This results in a wide spectrum of possible disorders; some are rare, and others are frequently encountered in the critical care unit. This chapter focuses on the neuroendocrine stress associated with critical illness, and disorders of the pancreas.
Neuroendocrinology of Stress and Critical Illness
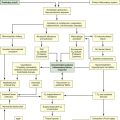
Major neurological and endocrine changes occur when an individual is confronted with physiological stress caused by any critical illness,1,2 sepsis,3–5 trauma, major surgery, or underlying cardiovascular disease.5,6 The normal “fight-or-flight” response that is initiated in times of physiological or psychological stress is exacerbated in critical illness through activation of the neuroendocrine system, specifically the hypothalamic-pituitary-adrenal axis (HPA),3,7 thyroid,8 and pancreas.1,2 The influence of the HPA on the course of critical illness is just beginning to be understood. Hormonal neuroendocrine output is active at the beginning of a critical insult but greatly diminishes if the critical illness is prolonged.9,10 All endocrine organs are affected by acute critical illness, as shown in Table 24-1.
TABLE 24-1
| GLAND OR ORGAN | HORMONE | RESPONSE OR PHYSICAL EXAMINATION |
| Adrenal cortex | Cortisol | ↑ Insulin resistance → ↑ glycogenolysis → ↑ glucose circulation ↑ Hepatic gluconeogenesis → ↑ glucose available ↑ Lipolysis ↑ Protein catabolism ↑ Sodium → ↑ water retention to maintain plasma osmolality by movement of extravascular fluid into the intravascular space ↓ Connective tissue fibroblasts → poor wound healing |
| Glucocorticoid | ↓ Histamine release → suppression of immune system ↓ Lymphocytes, monocytes, eosinophils, basophils ↑ Polymorphonuclear leukocytes → ↑ infection risk ↑ Glucose ↓ Gastric acid secretion |
|
| Mineralocorticoids | ↑ Aldosterone → ↓ sodium excretion → ↓ water excretion → ↑ intravascular volume ↑ Potassium excretion → hypokalemia ↑ Hydrogen ion excretion → metabolic acidosis |
|
| Adrenal medulla | Epinephrine Norepinephrine |
↑ Endorphins → ↓ pain ↑ Metabolic rate to accommodate stress response ↑ Live glycogenolysis → ↑ glucose ↑ Insulin (cells are insulin resistant) ↑ Cardiac contractility ↑ Cardiac output ↑ Dilation of coronary arteries ↑ Blood pressure ↑ Heart rate ↑ Bronchodilation → ↑ respirations ↑ Perfusion to heart, brain, lungs, liver, and muscle ↓ Perfusion to periphery of body ↓ Peristalsis |
| Norepinephrine | ↑ Peripheral vasoconstriction ↑ Blood pressure ↑ Sodium retention ↑ Potassium excretion |
|
| Pituitary Anterior pituitary |
All hormones Corticotropin |
↑ Endogenous opioids → ↓ pain ↑ Aldosterone → ↓ sodium excretion → ↓ water excretion → ↑ intravascular volume ↑ Cortisol → ↑ blood volume |
| Growth hormones | ↑ Protein anabolism of amino acids to protein ↑ Lipolysis → ↑ gluconeogenesis |
|
| Posterior pituitary | Antidiuretic hormone | ↑ Vasoconstriction ↑ Water retention → restoration of circulating blood volume ↓ Urine output ↑ Hypoosmolality |
| Pancreas | Insulin Glucagon |
↑ Insulin resistance → hyperglycemia ↑ Glycolysis (directly opposes action of insulin) ↑ Glucose for fuel ↑ Glycogenolysis ↑ Gluconeogenesis ↑ Lipolysis |
| Thyroid | Thyroxine | ↓ Routine metabolic demands during stress |
| Gonads | Sex hormones | Energy and oxygen supply diverted to brain, heart, muscles, and liver |
Acute Neuroendocrine Response to Critical Illness
The fight-or-flight acute response to physiological threat is a rapid discharge of the catecholamines norepinephrine and epinephrine into the bloodstream.6 Norepinephrine is released from the nerve endings of the sympathetic nervous system (SNS).6
Hypothalamic-Pituitary-Adrenal Axis in Acute Stress
Epinephrine (adrenalin) is released from the medulla of the adrenal glands. Epinephrine increases cerebral blood flow and cerebral oxygen consumption and may be the trigger for recruitment of the hypothalamic-pituitary axis.6
The pituitary gland has two parts (anterior and posterior) that function under control of the hypothalamus, as described in Figure 23-1 in Chapter 23. As a response to stress, the posterior pituitary gland releases antidiuretic hormone (ADH), also known as vasopressin (pitressin). This hormone is an antidiuretic with a powerful vasoconstrictive effect on blood vessels.6 The combination of epinephrine and vasopressin raises blood pressure quickly; it also decreases gastric motility.6 Epinephrine increases heart rate, causes ventricular dysrhythmias in susceptible patients, and provides some analgesia or lack of pain awareness during acute physical stress.6
The anterior pituitary gland is under the control of the hypothalamus (see Figure 23-1 in Chapter 23). In acute physiological stress, “pulses” of growth hormone (GH) are released from the anterior pituitary gland to boost serum GH levels.10 In critical illness, the anterior pituitary actively secretes GH hormone, but the quantity may be insufficient for extreme physiological needs. A different problem is that peripheral tissues may be resistant and unable to use the anabolic GH.11 The anterior pituitary gland also produces corticotropin (also called ACTH), which stimulates release of cortisol from the adrenal cortex.12 Cortisol release is an important protective response, and serum levels increase sixfold with normal adrenal function.12
Liver and Pancreas in Acute Stress
The liver releases the hormone glucagon to stimulate the liver to pour additional glucose into the bloodstream. This greatly raises blood glucose levels.3 Paradoxically, the pancreas does not produce more insulin, and serum insulin levels remain normal, even with the increased metabolic demand associated with critical illness or sepsis. Peripheral tissues become insulin resistant.3 In other words, the tissues are unable to use the available insulin to transport glucose inside the cells for normal metabolism. This raises blood glucose levels, causing persistent hyperglycemia. There is an alternative glucose transport system that enables insulin to enter the cell by means of specialized glucose transporters, usually abbreviated as GLUT. Although insulin-independent glucose transporters (GLUT-1, GLUT-2, and GLUT-3) are active during physiological stress, they cannot keep up with the massive increase in glucose production by the liver.13
Thyroid Gland in Acute Stress
Within 2 hours after trauma or surgery, serum levels of triiodothyronine (T3) decrease.10 The greater the decrease of T3 in the first 24 hours, the more severe the critical illness.8 Thyroid-stimulating hormone (TSH) and thyroxine (T4) briefly increase and then return to normal levels. In the acute phase of critical illness, a low serum T3 is associated with a poor prognosis.10
Systemic illnesses that do not directly involve the thyroid gland but alter thyroid gland metabolism are referred to as nonthyroidal illness syndromes or sick euthyroid syndromes.14 The significance of altered thyroid function in critical illness is unknown.14,15
Prolonged Neuroendocrine Response to Critical Illness
If critical illness is prolonged, the neuroendocrine response changes dramatically. The initially high hormonal levels are reduced, and output decreases from all endocrine glands.
Hypothalamic-Pituitary-Adrenal Axis in Prolonged Stress
If critical illness is prolonged for more than 7 to 10 days, the production of hormones from the pituitary gland is significantly lessened.
Adrenal dysfunction is a frequent finding if critical illness lasts longer than 7 to 10 days. A 20-fold increase in adrenal failure has been reported in critically ill patients older than 50 years who spend more than 14 days in a critical care unit.10 If the critical illness is prolonged and the patient remains hypotensive, vasopressor-dependent, and mechanically ventilated, adequacy of adrenal function must be evaluated. Older patients are particularly susceptible to adrenal failure.16
Liver-Pancreas in Prolonged Stress
Hyperglycemia is often persistent. Gluconeogenesis (the metabolism of glucose from fat or protein) and proteolysis (protein breakdown) continue throughout the catabolic phase of critical illness.11 Critically ill patients can lose up to 10% of their lean body mass per week.11 The addition of adequate supplemental nutrition is recommended, in addition to an intravenous insulin infusion, to reduce hyperglycemia and provide additional substrate other than the patient’s own body tissues.1,2 Insulin is an anabolic hormone and can improve protein synthesis and reduce protein breakdown.11 While the critical illness is ongoing, nutrition and insulin seem to limit rather than stop the loss of lean body mass.
Thyroid Gland in Prolonged Stress
The thyroid gland appears to follow a pattern similar to that of the pituitary gland when critical illness is prolonged. The serum levels of T3, T4, and TSH are greatly reduced, and the normal pulses of TSH are flattened.10
Adrenal Dysfunction in Critical Illness
Diminished adrenal gland function may result from one or more causes during critical illness:
• Primary adrenal failure is rare and occurs in only 0.01% to 3% of critically ill patients.17,18
• Critical illness-related corticosteroid insufficiency (CIRCI) describes a situation in which the adrenal gland produces glucocorticosteroids but the quantity is insufficient for the disease process. Estimates of the frequency of CIRCI range from about 20% in medical patients to 60% in septic patients.19
• Peripheral cortisol resistance is thought to occur in severe sepsis and septic shock.7,17 In septic patients, inflammatory cytokines induce cellular resistance to cortisol; low-dose, short-term replacement corticosteroids may be provided to patients with CIRCI.7,17
Assessment of Adrenal Function
Clinical assessment of adrenal dysfunction is difficult in the critically ill, and a specialized laboratory assay is necessary for an accurate diagnosis. First, a baseline serum cortisol level is obtained. Adrenal failure is likely if the cortisol level is less than 10 mcg/dL.7
Cosyntropin Stimulation Test
Further confirmation of adrenal dysfunction may be obtained by performance of a corticotropin stimulation test (cosyntropin test). Cosyntropin is a medication made from the first 24 amino acids of corticotropin.12 In the test, 250 mcg cosyntropin is administered by the intravenous route, and serum blood levels are measured 30 minutes later. A serum cortisol rise from baseline of less than 9 mcg/dL after 30 minutes denotes inability of the adrenal gland to respond to a stress stimulus (nonresponder).7,12 If the cortisol rise is greater than 9 mcg/dL in response to corticotropin stimulation, the adrenal glands are functioning normally (responder).7 Corticosteroids are given only to nonresponders. The combination of a low baseline cortisol value (<10 mcg/dL) with minimal or no rise (<9 mcg/dL) after cosyntropin stimulation is evidence of corticosteroid deficiency.7
Corticosteroid Replacement
Clinical practice guidelines7 recommend short-term provision of low-dose hydrocortisone for patients who have a diagnosis of septic shock with refractory vasopressor-dependent hypotension. Hydrocortisone is the recommended replacement because it is the pharmacological steroid that most resembles endogenous cortisol.
The guidelines recommend use of the cosyntropin stimulation test as described previously. However, the test is not recommended as a stand-alone method to identify patients who might receive low-dose steroids. This apparent contradiction is explained by the fact that several clinical trials of low-dose steroid replacement in sepsis have demonstrated a faster resolution of the shock symptoms but no difference in overall mortality compared with placebo.7 The controversy continues. The most recently published randomized control trial of low-dose steroids versus placebo in 499 patients with septic shock did not show any mortality benefit, even among responders to the cosyntropin stimulation test. Nor was there any difference in survival between those who responded to the 250 mcg cosyntropin and received steroids and those who responded and received a placebo.20
High-dose steroid replacement is never recommended in the management of sepsis. Corticosteroids are never discontinued abruptly and must be tapered gradually over several days.7
Hyperglycemia in Critical Illness
Normal fasting blood glucose levels range between 70 and 100 mg/dL in a healthy person. Critically ill patients frequently have much higher blood glucose levels, and several retrospective analyses have reported that hyperglycemic patients have a higher mortality rate than patients with normal blood glucose values.21 In 2001 a landmark prospective, randomized study showed a significant reduction in morbidity and mortality among critically ill surgical patients whose blood glucose concentration was maintained between 80 and 110 mg/dL with a continuous insulin infusion, compared with those whose blood glucose was only treated if it was greater than 180 mg/dL.1 A study of medical critical care patients by the same group with the same protocol demonstrated a mortality benefit after 3 days of tight glucose control with an insulin infusion.2 These initial studies were greeted with tremendous enthusiasm and many critical care units adopted stringent glucose-control standards to reduce hyperglycemia-associated morbidity and mortality. However, these earlier studies have now been challenged.
The NICE-SUGAR trial was a prospective randomized trial of 6,014 critically ill patients.22 It compared continuous insulin infusion to achieve tight glucose control (target 80 to 108 mg/dL) with a conventional glucose-control range (target below 180 mg/dL).22 In the tight glucose-control group, 6.8% had episodes of severe hypoglycemia (below 40 mg/dL); in the conventional control group, only 0.5% experienced severe hypoglycemia.22 There was a 2.6% higher risk of death in the intensive glucose-control group (27.5% died) compared with the conventional control group (24.9% died).22 Other prospective, randomized trials23,24 and meta-analysis25 were unable to demonstrate a reduction in mortality with tight glucose control. These research studies suggest that the risks of hypoglycemia with the use of intensive insulin protocols outweigh the benefits of tight glucose control in the critically ill.22–25
Clinical Practice Guidelines Related to Blood Glucose Management in Critically III Patients
As a result of the studies just described, the American Association of Clinical Endocrinologists (AACE) and the American Diabetes Association (ADA) developed clinical practice guidelines that recommend the use of continuous insulin infusions to maintain blood glucose in critical care patients between 140 to 180 mg/dL, with frequent monitoring of blood glucose.5 The 140 to 180 mg/dL level was selected to minimize the risk of hypoglycemia.
Other glucose-control guidelines relevant to critical illness have also been published. The Society of Critical Care Medicine (SCCM) Surviving Sepsis guidelines recommend maintaining blood glucose concentration lower than 150 mg/dL in critically ill septic patients after initial stabilization.4 The American Heart Association recommends a target range of 90 to 140 mg/dL while avoiding hypoglycemia.26 The American College of Physicians (ACP) recommends a target blood glucose range of 140 to 200 mg/dL for ICU patients whether diabetic or nondiabetic.27 More liberal blood glucose ranges for critically ill patients are now recommended in clinical guidelines.4,5,26,27
Hyperglycemia and the Cardiovascular System
Many patients who are admitted to the hospital with acute complications of atherosclerotic disease are diabetic. Risk of coronary artery disease is two to three times higher in diabetics compared with nondiabetics.28 Hyperglycemia is present in 25% to 50% of patients with acute coronary syndrome (ACS) who are admitted to the hospital, and the higher the blood glucose level, the greater the risk of death.26 Diabetic patients who were admitted to the hospital for an acute myocardial infarction and had an admission blood glucose level greater than 180 mg/dL had a 70% relative increase in the risk of in-hospital death compared with similar patients who had a normal glucose value on admission.26 Retrospective analyses of blood glucose levels of cardiac surgery patients show a higher in-hospital mortality rate for patients with elevated blood glucose concentrations.29,30 Patients who were unaware of their diabetes before hospital admission and nondiabetic patients who were hyperglycemic during their critical illness also had higher mortality rates.31,32
Hypoglycemia and Brain Injury
The brain does not store glucose and is dependent on a continuous supply of glucose from the peripheral bloodstream. It is essential to avoid hypoglycemia in any brain-injured patient. However, there are no published guidelines as what the correct target glucose range should be for this population. Experts favor a less restrictive target, because blood glucose concentrations lower than 135 mg/dL (6 mmol/L) have been shown to increase brain metabolic distress.33
Insulin Management in the Critically Ill
A profound shift in the management of the hyperglycemic critically ill ventilated patient has recently taken place. As a result of the research that has highlighted the deleterious effects of hyperglycemia in critical illness, most hospitals have developed an institution-specific tight glucose-control algorithm to lower blood glucose into the targeted range. The vigilance of the critical care nurse is pivotal to the success of any intervention to lower blood glucose using a continuous insulin infusion. As discussed earlier, many glucose-control protocols are becoming less restrictive due to concerns about iatrogenic hypoglycemia.
Some clinical interventions increase the likelihood that the patient will receive exogenous insulin. Infusion of total parental nutrition (TPN) typically requires a continuous insulin infusion to normalize blood glucose. In a study of critically ill surgical patients with preexisting type 2 diabetes who did not previously require insulin, 77% of patients needed insulin to control blood sugar while receiving TPN.34 Some enteral nutrition formulas are high in carbohydrates and increase blood sugar in the same way. In this situation, the composition of the enteral feeding is altered, or the insulin dosage is increased to achieve target blood glucose levels. It is important to provide nutrition, and insulin can be a powerful adjunct to nutritional support.
Frequent Blood Glucose Monitoring
Monitoring blood glucose with a point-of-care glucometer is the basis of targeted glucose control. As part of the comprehensive initial assessment, the blood sugar is measured by a standard laboratory sample or by a finger-stick capillary blood sample. In many institutions, if the blood sugar is greater than 180 mg/dL (an initial value that may vary among hospitals), the patient is started on a continuous intravenous insulin infusion. In critically ill catabolic patients, the initial blood glucose level can be well above 200 mg/dL. While the glucose is elevated, blood sample measurements are usually obtained hourly, to allow titration of the insulin drip to lower blood glucose. After the patient is stable, blood glucose measurements can be spaced approximately every 2 hours, based on individual hospital protocols.21
Several different blood-sampling methods are available. A capillary finger-stick is perhaps the easiest initial option, although the fingers can become noticeably marked if there are numerous sticks over several days. Trauma to the fingers is also exacerbated if peripheral perfusion is diminished. If a central venous catheter (CVC) or an arterial line with a blood conservation system attached is in place, this can be a highly efficient system for sampling, because there is no blood wastage. If a blood conservation setup is not attached, use of the venous or arterial catheter for access is unacceptable because of the amount of waste blood that would be discarded.
Continuous Insulin Infusion
Many hospitals use insulin infusion protocols that are implemented by the critical care nurse for management of stress-induced hyperglycemia.5 Effective glucose protocols gauge the insulin infusion rate based on two parameters: (1) the immediate blood glucose result and (2) the rate of change in the blood glucose level since the last hourly measurement. The following three examples illustrate this concept:
The important point to emphasize is that the rate of change of the blood glucose is as important as the most recent blood glucose measurement. Each of the patients described in the examples may have the same insulin infusion rate, depending on their catabolic state, but individualization among patients with different diagnoses can be safely achieved as long as the rate of change is also considered.
A person’s insulin requirement often fluctuates over the course of an illness. This occurs in response to changes in the clinical condition, such as development of an infection, caloric alterations caused by stopping or starting enteral nutrition or TPN, administration of therapeutic steroids, or because the person is less catabolic.34 A method to allow for corrective incremental changes (up or down) to adapt to the reality of clinical developments and maintain the glucose within the target range is essential.34 Some protocols alter only the infusion rate, whereas others incorporate bolus insulin doses if the glucose concentration is greater than a preestablished threshold (e.g., 180 mg/dL). Typically, after the blood glucose has remained within the target range for a number of hours (4 to 12 hours, depending on the hospital protocol), the time interval between measurements for blood glucose monitoring is extended to every 2 hours.
Transition from Continuous to Intermittent Insulin Coverage
The transition from a continuous insulin infusion to intermittent insulin coverage must be handled with care to avoid large fluctuations in blood glucose levels. Before the conversion, the regular insulin infusion should be at a stable and preferably low rate, and the patient’s blood glucose level should be maintained consistently within the target range. The transition from intravenous to subcutaneous administration depends on numerous factors, especially whether the patient is able to eat a normal diet.34
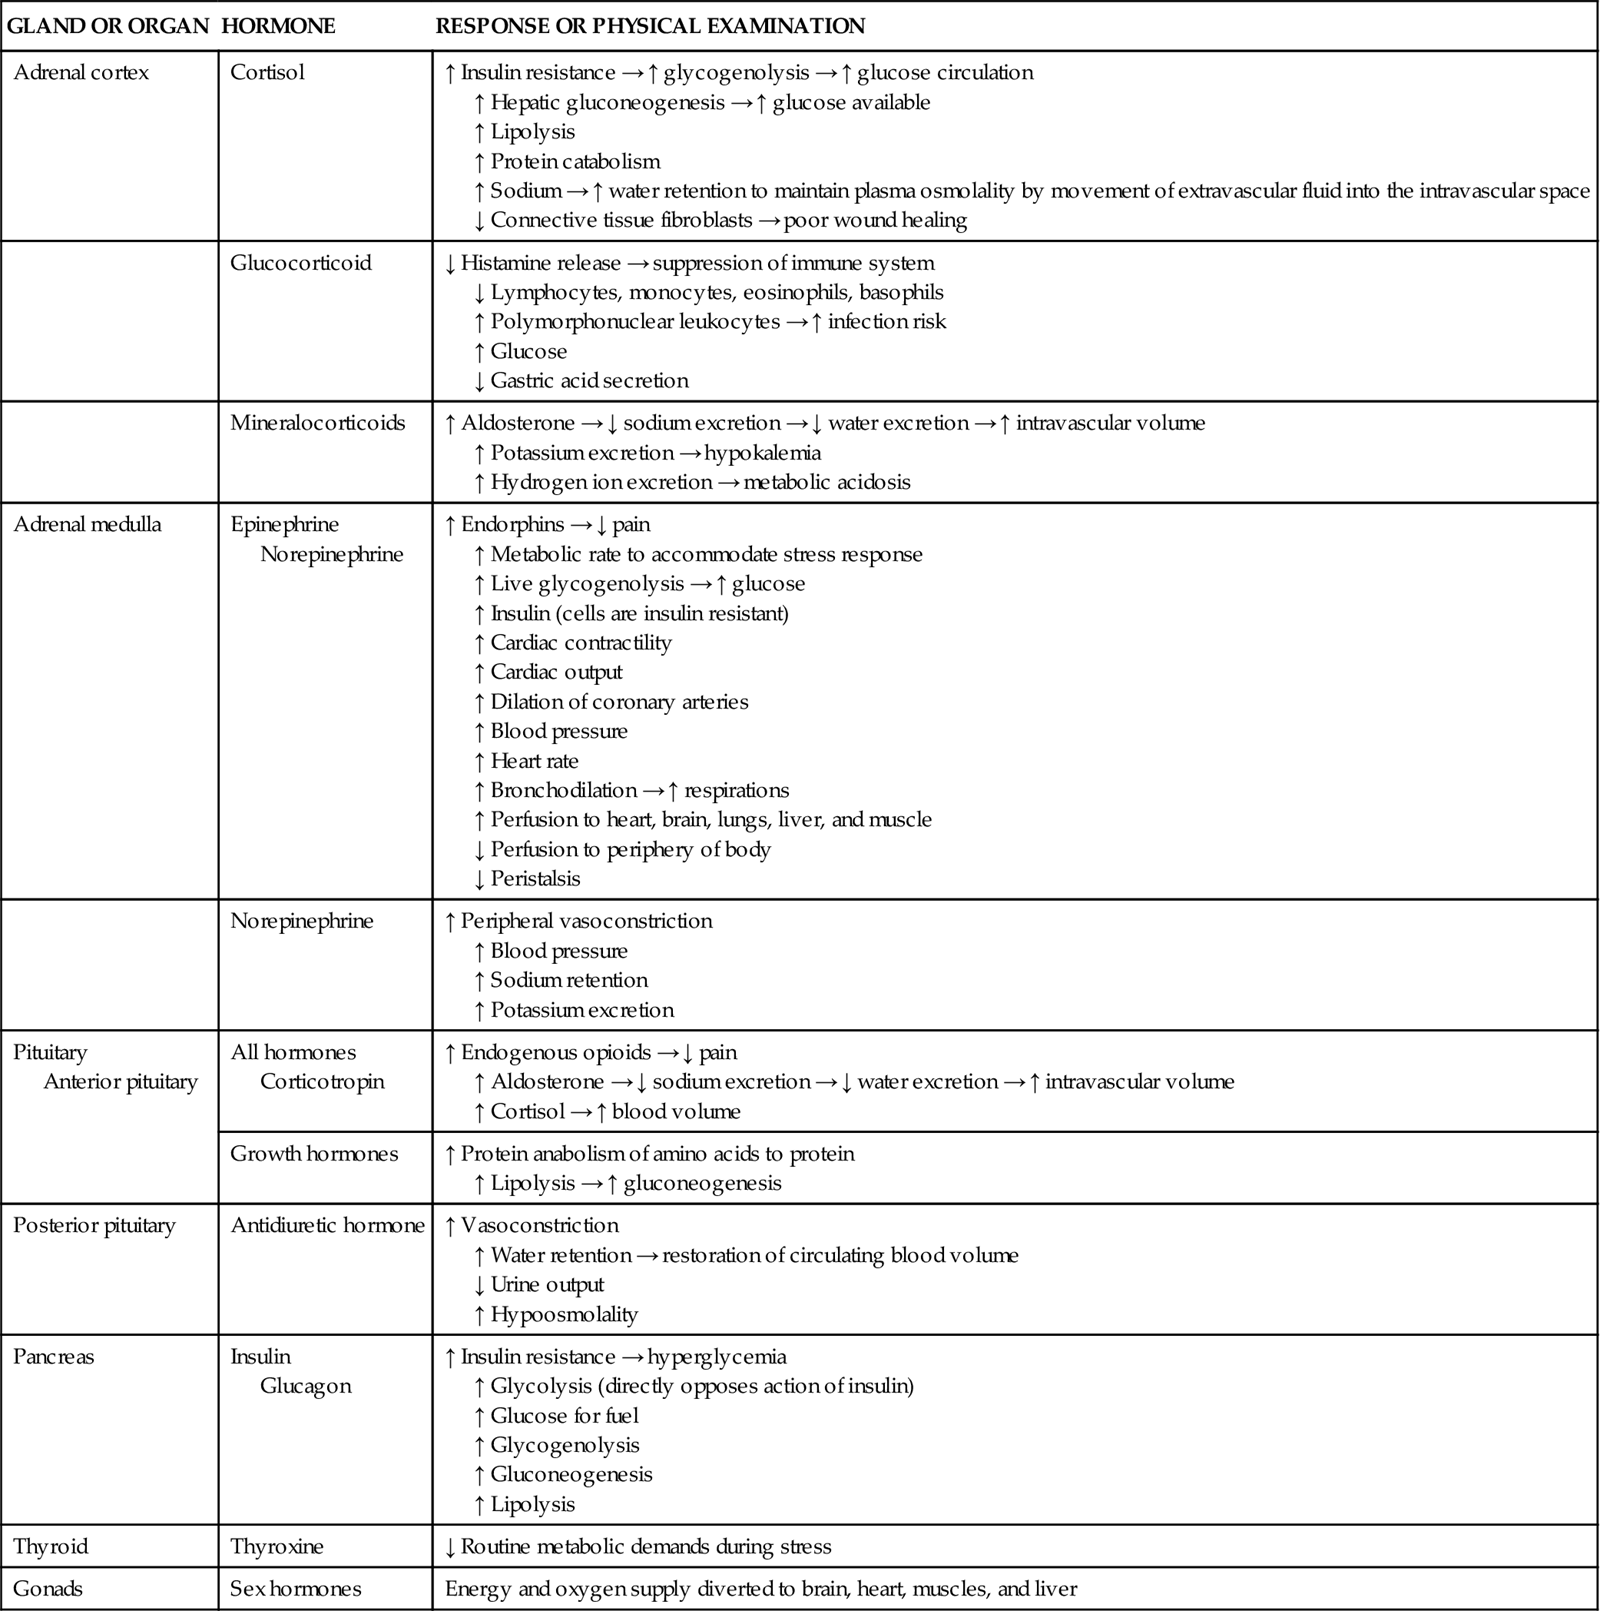
Clinicians use various methods to calculate the quantity of insulin to prescribe during the transition from intravenous to subcutaneous insulin to maintain stable blood glucose levels. Figure 24-1 depicts hypothetical examples of how a combination of basal and bolus insulin regimens (prandial insulin) can work in clinical practice.21,35 The following paragraphs describe the application of one calculation method for a 67-year-old patient, Alice Smith, who is recovering from critical illness and has recently been extubated.
2 The 30 units of insulin infused during the previous 24 hours is Ms. Smith’s required daily insulin dose. To transition to subcutaneous insulin, a proportion of this amount (i.e., 75%-80%) will be divided between basal and prandial components.5 In this situation, 80% of the 30 units = 24 units. Half of this amount (12 units) will be administered subcutaneously as intermediate or long-acting insulin; the other half will be administered as short-acting insulin to coincide with meals (i.e., 4 units with each of three meals).
3 The options for insulin administration for Ms. Smith are as follows:34–36
After the transition to subcutaneous insulin, the dosage is adjusted to the individual patient’s needs. In a stable insulin-sensitive patient, 1 unit of short-acting insulin will lower the blood glucose by 50 to 100 mg/dL.21 In a critical care patient, more insulin is typically required to reduce blood glucose levels, because of the physiological stress of the critical illness.36
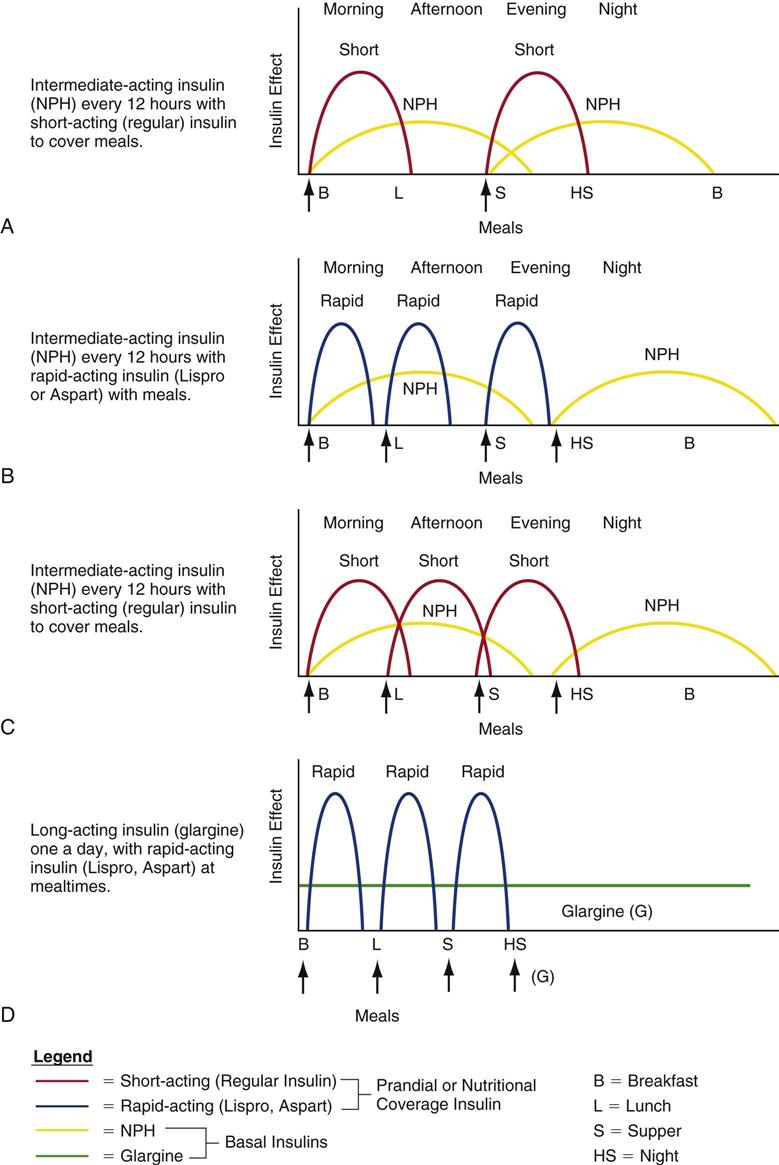
Table 24-2 describes the various types of insulin available for use. These include ultra-short-acting, short-acting, intermediate-acting, long-acting, and combination insulin replacement options. Even after the transition to subcutaneous insulin is completed, blood glucose is monitored frequently to maintain blood glucose within the target range and detect hyperglycemia or hypoglycemia.
TABLE 24-2
PHARMACOLOGICAL MANAGEMENT: INSULIN*
| INSULIN | ROUTE† | ACTION | ONSET/PEAK/DURATION | SPECIAL CONSIDERATIONS |
| Ultra-Short-Acting Insulins | ||||
| Aspart (NovoLog) | SQ & IV | Insulin replacement, rapid onset | 5-15 min/30-90 min/<5 hr | Insulin analogue almost immediately absorbed; must be taken with food. |
| Insulin appearance should be clear. | ||||
| Must be used in combination with intermediate-acting or long-acting basal insulin regimen. See Figure 24-1. | ||||
| Lispro (Humalog) | SQ | Insulin replacement, rapid onset | 5-15 min/30-90 min/<5 hr | First available synthetic insulin (analogue); almost immediately absorbed; must be taken with food. |
| Shorter duration of action than regular insulin; should be used with basal longer-acting insulin. See Figure 24-1. | ||||
| Glulisine (Apidra) | SQ & IV | Insulin replacement, rapid onset | 5-15 min/30-90 min/<5 hr | New insulin analog |
| Short-Acting Insulin | ||||
| Regular | IV or SQ | Insulin replacement therapy | IV: <15 min SQ: 30-60 min/2-3 hr/5-8 hr |
Only type of insulin suitable for IV continuous infusion or bolus administration. |
| Intermediate-Acting Basal Insulin | ||||
| Neutral Protamine Hagedorn (NPH) | SQ | Insulin replacement, intermediate action | 2-4 hr/4-10 hr/10-16 hr | |
| Long-Acting Basal Insulins | ||||
| Glargine (Lantus) | SQ | Long-acting basal insulin analog; longer-acting than NPH or Ultralente | 2-4 hr until steady state/no peak; concentration relatively constant over 20-24 hr | Synthetic insulin (analog); differs from human insulin by three amino acids, slowing release over 24 hr; no peak. |
| Decrease dose by 20% if switching from NPH to glargine. | ||||
| Must not be diluted or mixed with other insulins. See Figure 24-1. | ||||
| Detemir (Levemir) | SQ | Long-acting basal analog | 3-8 hr until steady state/no peak/5-23 hr | |
| Combination (Premixed) Insulins | ||||
| Various | SQ | Rapid plus intermediate or long-acting insulin combination | Varies according to combination used | Many combinations exist; examples (long-acting component/short-acting component) include 70/30 regular (70% NPH with 30% regular), NovoLog mix 70/30 (70% aspart protamine suspension with 30% aspart), and Humalog mix 75/25 (75% lispro protamine suspension with 25% lispro). |
IV, intravenous; SQ, subcutaneous.
*Dosages are individualized according to patient’s age and size.
†Only regular insulin is suitable for intravenous use.
Data from Rodbard HW, et al: American Association of Clinical Endocrinologists medical guidelines for clinical practice for the management of diabetes mellitus, Endocr Pract 13(Suppl 1):3, 2007.
Intermittent Insulin Coverage
A patient may be prescribed supplemental “correctional” doses of insulin in addition to the basal/prandial insulin combination. The use of the trio of basal, prandial, and correctional insulin is designed to eliminate the use of the traditional sliding scale.35 A frequent criticism of sliding-scale therapy is that the dosages are rarely reevaluated or adjusted once established.34 A second criticism is that the scales treat hyperglycemia only after it has occurred; they are not proactive in the manner of continuous insulin infusions.34
Hypoglycemia Management
It is important to have a protocol for the management of hypoglycemia. The major drawback to use of intensive insulin protocols, as described earlier, is the potential for hypoglycemia. Whenever hypoglycemia is detected, it is important to stop any continuous infusion of insulin. An example of one protocol to reverse hypoglycemia follows:
In all cases of hypoglycemia, the blood glucose concentration is monitored every 15 to 20 minutes until the blood sugar has risen into a safe range. The ADA recommends incorporation of level of consciousness plus the blood glucose result as a guide to glucose replacement to treat hypoglycemia.37 Administer 15 to 20 g of glucose to the conscious hypoglycemic patient. A different protocol suggests the following response to a blood glucose concentration of less than 60 mg/dL:36
Nursing Management
Nursing management of the patient with neuroendocrine stress resulting from critical illness incorporates a variety of nursing diagnoses. Nursing priorities are directed toward (1) monitoring blood glucose levels, insulin therapy, and avoiding hypoglycemia; (2) providing nutrition; and (3) providing education to the patient and family.
Monitoring Hyperglycemic Side Effects of Vasopressor Therapy
Two vasopressors frequently used as continuous infusions to counteract hypotension in the critically ill also raise blood glucose. Epinephrine and, to a lesser extent, norepinephrine stimulate an increase in gluconeogenesis (creation of new glucose), an increase of skeletal muscle and hepatic glycogenolysis (increased glucose production), an increase in lipolysis (increased fat breakdown), direct suppression of insulin secretion, and an increase in peripheral insulin resistance.13 All of these actions serve to raise the serum glucose level in the bloodstream.
Monitoring Blood Glucose Levels, Insulin Therapy, Avoiding Hypoglycemia
The critical care nurse is responsible for the hourly monitoring of blood glucose and titration of the insulin infusion according to the hospital’s established protocol while the patient is hyperglycemic. The use of standardized protocols makes possible a systematic approach to the control of blood glucose. This results in improved glycemic control and lower rates of hypoglycemia. It is essential and recommended that nurses receive effective and ongoing education about the anabolic impact of insulin therapy in critical illness.5 Hospital protocols to minimize development of hypoglycemia, such as using the 140 to 180 mg/dL target range,5 and rapid reversal of any occurrence of severe hypoglycemia (below 40 mg/dL) by provision of intravenous dextrose (D50W) are mandatory.
Providing Nutrition
Whenever an insulin infusion is started to lower blood glucose, nutritional support (enteral or TPN) should be considered. In the absence of nutrition, a 10% dextrose solution may temporarily be infused. The 10% dextrose offers the advantage of carbohydrate calories for metabolism, limits fluctuations in the blood sugar, and reduces the risk of hypoglycemia. After the patient’s metabolic condition is stable, introduction of non-glucose nutrition (protein and fat) is recommended.38
Providing Patient Education
When the patient is acutely ill, the majority of the educational interventions are directed to the family and supportive friends at the bedside. Numerous explications are required to describe the IV medications, the nutritional needs, the purpose of insulin, the role of other medications, and the ongoing nursing care to provide comfort and prevent complications.
Collaborative Management
It is well established that standardized protocols designed to manage the complications of critical illness result in lower morbidity and mortality for patients. Optimally, all disciplines concerned with the endocrine status of the patient will have participated in the design of these guidelines in each critical care area. The guideline that applies to most patients relates to targeted glucose control. Many professional organizations have endorsed the importance of monitoring blood glucose in the critically ill patient, as described in the Evidence-Based Collaborative Practice Box on Hyperglycemia Management in Critical Illness.5,34
Diabetes Mellitus
Diabetes mellitus is a progressive endocrinopathy associated with carbohydrate intolerance and insulin dysregulation.
Morbidity and Mortality Associated with Diabetes Mellitus
According to the U.S. Centers for Disease Control and Prevention (CDC), diabetes is the sixth most common cause of death among U.S. adults. Heart disease and stroke are the first and third leading causes of death among U.S. adults.39 These data must be interpreted in light of the knowledge that adults with diabetes have a risk for dying from cardiovascular diseases that is two to four times greater than in adults without diabetes. Diabetes is also associated with an increased risk of cancer. Malignant neoplasms are the second leading cause of death in the United States.39 The CDC reports that diabetes is also an independent predictor of mortality from cancer of the colon, the pancreas, the female breast and, in men, the liver and the bladder.40 The annual cost for hospital care per capita for persons with diabetes is $6,309, compared with $2,971 for persons without diabetes.34 This represents a cost ratio of 2 : 1.34
Diagnosis of Diabetes
Diabetes mellitus is diagnosed by measurement of the fasting plasma glucose (FPG) laboratory test. The blood glucose may also be called a fasting blood glucose (FBG) or fasting blood sugar (FBS) level. The benchmarks for a normal FPG value have been progressively lowered as more knowledge has been gained about the benefits of maintaining the plasma glucose level as close to normal as possible.
The current values endorsed by the American Diabetes Society are as follows:41
• An FPG level of 70 to 100 mg/dL (5.6 mmol/L) signifies normal fasting glucose.
• An FPG level between 100 and 125 mg/dL (5.6 and 6.9 mmol/L) denotes impaired fasting glucose (IFG).
Two FPG values of 126 mg/dL or higher confirm the diagnosis of diabetes. For the acutely ill patient, hyperglycemia is actively treated with insulin to lower the blood sugar to a safe target range.5 There are differences in the values of plasma versus whole blood glucose measurements. Plasma glucose values are 10% to 15% higher than whole blood glucose values, and it is essential that health care clinicians and people with diabetes know whether their monitor and strips provide whole blood or plasma results, especially when results from more than one setting (laboratory or monitor) are being compared. Although most laboratories measure plasma glucose levels, most home-monitoring units and point-of-care units measure glucose using whole blood from capillary blood obtained by a finger-stick.42
The benefit and importance of maintaining blood glucose at levels as close to normal as possible has been conclusively demonstrated in patients with type 1 and type 2 diabetes.42 The Diabetes Control and Complications Trial (DCCT) of 1995 on type 1 diabetes, and the United Kingdom Prospective Diabetes Study (UKPDS), published in 1998, on type 2 diabetes, demonstrated that lifestyle changes and use of medications that lead to consistently normal glucose levels reduce microvascular diabetes-related complications and decrease mortality.42
Glycated Hemoglobin
For individuals with diabetes, maintenance of blood glucose within a tight normal range is fundamental to avoid the development of microvascular and neuropathic secondary conditions. Although the FPG produces a snapshot of the blood glucose concentration at a single point in time, the glycated hemoglobin (HbA1C), also known as glycosylated hemoglobin, identifies the percentage of glucose that the red cells have absorbed from the plasma over the previous 3-month period. A normal HbA1c falls between 4% and 6%.41 The target for diabetic patients is an A1C value lower than 6.5%.41,43 The HbA1C value is also used to diagnose diabetes.43
Types of Diabetes
Two distinct types of diabetes are discussed in this chapter:41
• Type 1 diabetes results from beta-cell destruction, usually leading to absolute insulin deficiency.
The two diseases are different in nature, cause, treatment, and prognosis.41 A further category of prediabetes has more recently been added to describe patients with impaired fasting glucose (FPG between 100 and 125 mg/dL) who are likely to develop diabetes at some time in the future and are at increased risk for coronary artery disease and stroke.41 Other conditions, such as gestational diabetes, are not discussed in this chapter.
Type 1 Diabetes
Type 1 diabetes mellitus accounts for only about 5% to 10% of the diabetic population.37 Older names for this condition included insulin-dependent diabetes (IDDM) and juvenile diabetes. Type 1 diabetes is a cellular-mediated autoimmune disease that causes progressive destruction of the beta cells of the islets of Langerhans in the pancreas. Autoantibodies falsely identify the patient’s own pancreas as “foreign” and destroy the native pancreatic tissue. Many responsible autoantibodies contribute to pancreatic destruction, including autoantibodies to the islet cell, to insulin, to glutamic acid decarboxylase (GAD65), and to the tyrosine phosphatases IA-2 and IA-2β.37 One or more of these autoantibodies are present in 85% to 90% of individuals with type 1 diabetes when fasting hyperglycemia is initially detected.37 Over time, the autoantibodies render the pancreatic beta cells incapable of secreting insulin and regulating intracellular glucose. In type 1 diabetes, the rate of beta-cell destruction is highly variable. It occurs rapidly in some individuals (mainly children) and slowly in others (mainly adults). Some patients, particularly children and adolescents, may have ketoacidosis as the first manifestation of their disease.
Genetic predisposition and unknown environmental factors are also believed to play an important role.37 Patients with type 1 diabetes are prone to development of other autoimmune disorders such as Graves’ disease (hyperthyroidism), Hashimoto’s thyroiditis, Addison’s disease, autoimmune hepatitis, myasthenia gravis, and pernicious anemia.37 Lack of insulin impairs carbohydrate, protein, and fat metabolism.
Management of Type 1 Diabetes
Patients with type 1 diabetes must receive intravenous (IV) or subcutaneous (SC) insulin therapy. Treatment with exogenous insulin replacement restores normal entry of glucose into the cells. The range of insulin replacements available is expanding, and it is essential that critical care nurses be knowledgeable about this class of medications (see Table 24-2). Without insulin, the rapid breakdown of noncarbohydrate substrate, particularly fat, leads to ketonemia, ketonuria, and diabetic ketoacidosis (DKA), a life-threatening complication associated with type 1 diabetes (see later discussion).
Type 2 Diabetes
An estimated 8.7% of the population in the United States has diabetes; almost all of them have type 2.44 Most individuals are older and obese and have a condition known as cardiometabolic syndrome.45 However, the number of adolescents and young adults with type 2 diabetes is also rising.41 Up to one third of people with diabetes remain undiagnosed. Patients at high risk for type 2 diabetes include those who meet the following criteria:44–46
In type 2 diabetes, pancreatic beta cells are present and functioning; however, the amount of insulin they produce varies greatly among patients:
• In some patients, the pancreas may produce sufficient insulin or even more than is needed (hyperinsulinemia), but the tissues are resistant to the effects of the insulin. This is known as insulin resistance syndrome.47
Insulin resistance describes a complex metabolic situation in which organ and tissue cells deny entry to insulin and glucose. This creates the clinical paradox in which elevated serum insulin levels and hyperglycemia are present at the same time. Obesity increases insulin resistance.41 Insulin resistance has a strong association with type 2 diabetes.45,47
Cardiometabolic Syndrome
The major known stimuli for development of metabolic syndrome are obesity and disorders of insulin resistance.45 Specific measurable factors are diagnostic of metabolic syndrome. These include abdominal adiposity, as demonstrated by a waist measurement greater than 40 inches in men or 35 inches in women; triglyceride levels higher than 150 mg/dL; high-density lipoprotein (L) cholesterol levels lower than 40 mg/dL in men or 35 mg/dL in women; blood pressure higher than 130/85 mm Hg; and an FPG value higher than 100 mg/dL. The ADA uses the FPG cutoff point of 100 mg/dL to identify individuals who are prediabetic.45
Screening for Type 2 Diabetes
The ADA recommends screening individuals who are at risk for type 2 diabetes at 3-year intervals, beginning at 45 years of age, especially those who are overweight (defined as a body mass index [BMI] ≥25 kg/m2) or obese (BMI ≥30 kg/m2).44 With the rise of obesity in the United States, the incidence of type 2 diabetes in children and adolescents has also increased dramatically in the last decade.41
Lifestyle Management for Type 2 Diabetes
Most adults with type 2 diabetes are overweight or obese based on their BMI. For most patients with type 2 diabetes, a program of weight reduction, increased physical exercise, and a change in diet pattern are recommended. Diets that contain large quantities of carbohydrate are discouraged.48 The diet should contain less than 30% of calories from fat; reduced sugar intake; low levels of saturated and trans fats; and an increased quantity of whole grains, vegetables, and fruits. Crash diets are discouraged, and a gradual program of weight loss and increased exercise, if needed, is recommended.48,49
Pharmacological Management of Type 2 Diabetes
If lifestyle changes are unsuccessful in reversing the pattern of type 2 diabetes, oral antihyperglycemic medications are prescribed. These drugs are not oral forms of insulin, because insulin would be destroyed by gastric juices. Oral antidiabetic drugs lower plasma glucose levels by several different mechanisms that include increasing insulin secretion, increasing sensitivity to insulin, or delaying carbohydrate absorption.49–53
A serious complication of type 2 diabetes that often requires admission to a critical care unit is hyperglycemic hyperosmolar state (HHS).54 This severe, sustained elevation of glucose levels leads to a serum hyperosmolality, and if left untreated, it progresses toward cellular dehydration, coma, and death (discussed later).
Diabetic Ketoacidosis
Epidemiology and Etiology
Diabetic ketoacidosis (DKA) is a life-threatening hyperglycemic crisis associated with diabetes mellitus. Type 1 diabetics who are dependent on insulin are typically affected. The diagnostic criteria for DKA are as follows:54
• pH <7.3
Infection is a major reason that diabetic patients progress to DKA. Symptoms of fatigue and polyuria may precede full-blown DKA, which can develop in less than 24 hours in a person with type 1 diabetes. In an undiagnosed diabetic patient, it is unknown how long it may take for DKA to develop as the pancreatic beta cells gradually fail. About 20% of hospital admissions for DKA are related to diagnosis of new-onset type 1 diabetes.55 With current management, the mortality rate for adults with type 1 diabetes in DKA is less than 1%,54 although a mortality rate of greater than 5% has been reported in older adults and in patients with life-threatening critical illness.54
Changes in the type of insulin, change in dosage, or increased metabolic demand can precipitate DKA in individuals with type 1 diabetes.54 Life-cycle changes, such as growth spurts in the adolescent, require an increase in insulin intake, as do surgery, infection, and trauma. In young persons with diabetes, psychological problems combined with eating disorders are a contributing factor in up to 20% of cases of DKA.54
Ketoacidosis also occurs with acute pancreatitis. In addition to elevated glucose and acidosis, the serum amylase and lipase are abnormally high, which helps to establish the diagnosis as separate from type 1 diabetes.55 Other nondiabetes causes of ketoacidosis are starvation and alcoholism. These cases are distinguished from classical DKA by clinical history and usually by a plasma glucose concentration of less than 250 mg/dL.54
Pathophysiology
Insulin Deficiency
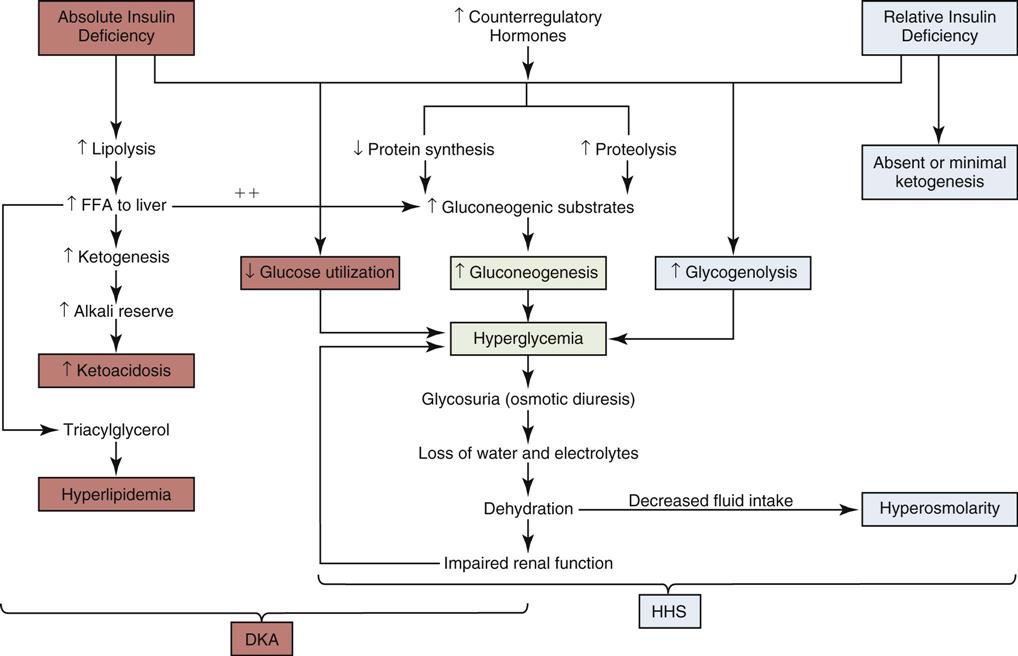
Insulin is the metabolic key to the transfer of glucose from the bloodstream into the cell, where it can be used immediately for energy or stored for use at a later time. Without insulin, glucose remains in the bloodstream, and cells are deprived of their energy source. A complex pathophysiological chain of events follows (Figure 24-2).54 The release of glucagon from the liver is stimulated when insulin is ineffective in providing the cells with sufficient glucose for energy. Glucagon increases the amount of glucose in the bloodstream by breaking down stored glucose, a process known as glycogenolysis. Noncarbohydrates (fat and protein) are converted into glucose, by a process known as gluconeogenesis. The breakdown of protein is termed proteolysis. The breakdown of fat (lipid) is known as lipolysis.
Blood glucose levels for the patient in DKA typically range from 300 to 800 mg/dL of blood. The reason the plasma glucose concentration is not higher is because of the short time period during which DKA develops in a patient with established type 1 diabetes. Elevated serum glucose levels alone do not define DKA; the major determining factor is an elevation in the total blood concentration of ketones54 and often the presence of ketoacidosis.
Hyperglycemia
Hyperglycemia increases the plasma osmolality, and the blood becomes hyperosmolar. Cellular dehydration occurs as the hyperosmolar extracellular fluid draws the more dilute intracellular and interstitial fluid into the vascular space in an attempt to return the plasma osmolality to normal.
Dehydration stimulates catecholamine production in an effort to provide emergency support. Catecholamine output stimulates further lipolysis, glycogenolysis, and gluconeogenesis, pouring glucose into the bloodstream (see Figure 24-2). Counterregulatory hormones, such as glucagon and epinephrine, govern this physiological process. These hormones are normally released with hypoglycemia. In DKA, although the plasma glucose is elevated, the interior of the cells are starved of glucose, and the lack of intracellular glucose initiates the physiological processes described in Figure 24-2. DKA presentation is described as mild, moderate, or severe, depending on the plasma blood glucose (Table 24-3). As the blood glucose rises, acidosis develops and the level of consciousness decreases.
TABLE 24-3
DIAGNOSTIC CRITERIA FOR DIABETIC KETOACIDOSIS (DKA) AND HYPERGLYCEMIC HYPEROSMOLAR SYNDROME (HHS)
| DKA | HHS | |||
| MILD (PLASMA GLUCOSE >250 mg/dL) | MODERATE (PLASMA GLUCOSE >250 mg/dL) | SEVERE (PLASMA GLUCOSE >250 mg/dL) | PLASMA GLUCOSE >600 mg/dL | |
| Arterial pH | 7.25-7.30 | 7.00 to <7.24 | <7.00 | >7.30 |
| Serum bicarbonate (mEq/L) | 15-18 | 10 to <15 | <10 | >18 |
| Urine ketone* | Positive | Positive | Positive | Small |
| Serum ketone* | Positive | Positive | Positive | Small |
| Effective serum osmolality† | Variable | Variable | Variable | >320 mOsm/kg |
| Anion gap‡ | >10 | >12 | >12 | Variable |
| Mental status | Alert | Alert/drowsy | Stupor/coma | Stupor/coma |
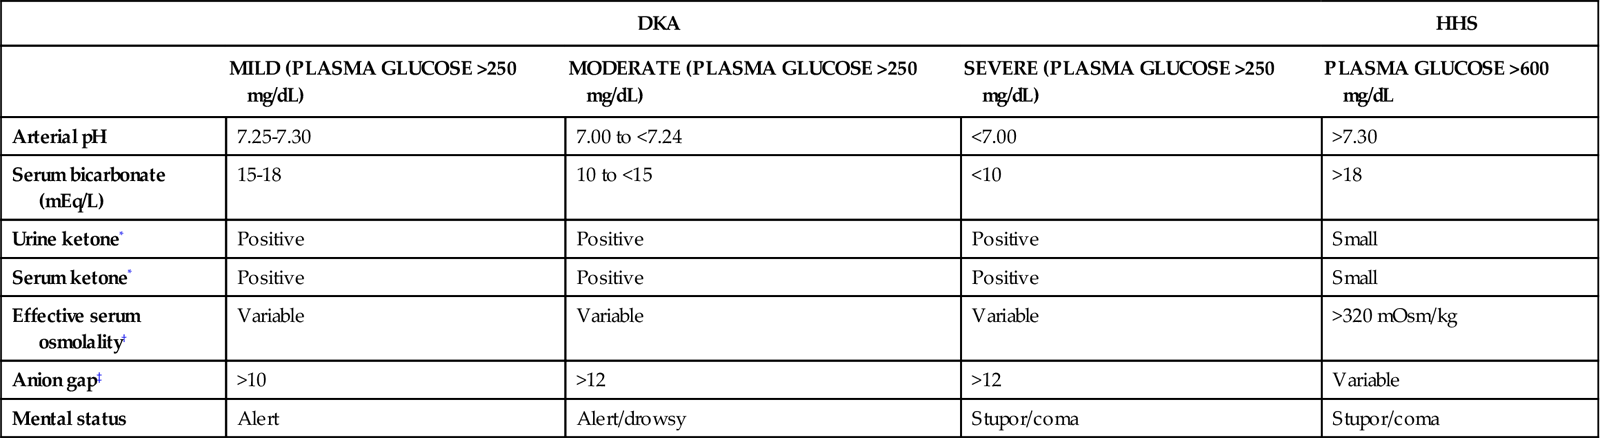
*Nitroprusside reaction method.
†Effective serum osmolality: 2[measured Na+(mEz/L)] + glucose (mg/dL)18.
‡Anion gap: (Na+) − (Cl− + HCO3−) mEq/L.
Data from Kitabchi AE, et al: Hyperglycemic crises in adult patients with diabetes: a consensus statement from the American Diabetes Association, Diabetes Care 32(7):1335, 2009.
Fluid Volume Deficit
Polyuria (excessive urination) and glycosuria (sugar in the urine) occur as a result of the osmotic particle load that occurs with DKA. The excess glucose, filtered at the glomeruli, cannot be resorbed at the renal tubule and spills into the urine. The unresorbed solute exerts its own osmotic pull in the renal tubules, and less water is returned to circulation through the collecting ducts. As a result, large volumes of water, along with sodium, potassium, and phosphorus, are excreted in the urine, causing a fluid volume deficit. The serum sodium concentration may be decreased because of the movement of water from the intracellular to the extracellular (vascular) space.54
Ketoacidosis
In the healthy individual, the presence of insulin in the bloodstream suppresses the manufacture of ketones. In insulin deficiency states, fat is rapidly converted into glucose (gluconeogenesis). Ketoacidosis occurs when free fatty acids are metabolized into ketones: acetoacetate, β-hydroxybutyrate, and acetone are the three ketone bodies that are produced.56 During normal metabolism, the ratio of β-hydroxybutyrate to acetoacetate is 1 : 1, with acetone present in only small amounts. In insulin deficiency, the quantities of all three ketone bodies increase substantially, and the ratio of β-hydroxybutyrate to acetoacetate increases to as much as 10 : 1.56 β-Hydroxybutyrate and acetoacetate are the ketones responsible for acidosis in DKA. Acetone does not cause acidosis and is safely excreted in the lungs, causing the characteristic fruity odor.
Ketones are measurable in the bloodstream (ketonemia). Blood tests that measure the quantity of β-hydroxybutyric acid, the predominant ketone body in the blood, are the most useful.54 Because ketones are excreted by the kidney, they are also measurable in the urine (ketonuria). Ketone blood tests are preferred over urine tests for diagnosis and monitoring of DKA in critical care. When the blood and urine become clear of ketones, the DKA is resolved.
Acid-Base Balance
The acid-base balance varies depending on the severity of the DKA. The patient with mild DKA typically has a pH between 7.25 and 7.30. In moderate to severe DKA, the pH can drop below 7.00.54 Acid ketones dissociate and yield hydrogen ions (H+), which accumulate and precipitate a fall in serum pH. The level of serum bicarbonate also decreases, consistent with a diagnosis of metabolic acidosis. Breathing becomes deep and rapid—a respiratory pattern known as Kussmaul respirations—to release carbonic acid in the form of carbon dioxide. Acetone is exhaled, giving the breath its characteristic fruity odor.
Assessment and Diagnosis
Clinical Manifestations
DKA has a predictable clinical presentation. It is usually preceded by patient complaints of malaise, headache, polyuria (excessive urination), polydipsia (excessive thirst), and polyphagia (excessive hunger). Nausea, vomiting, extreme fatigue, dehydration, and weight loss follow. Central nervous system depression, with changes in the level of consciousness, can lead quickly to coma.41,54
The patient with DKA may be stuporous or unresponsive, depending on the degree of fluid-balance disturbance. The physical examination reveals evidence of dehydration, including flushed dry skin, dry buccal membranes, and skin turgor that takes longer than 3 seconds to return to its original position after the skin has been lifted. Often “sunken eyeballs,” resulting from lack of fluid in the interstitium of the eyeball, are observed. Tachycardia and hypotension may signal profound fluid losses. Kussmaul respirations are present, and the fruity odor of acetone may be detected.
Laboratory Studies
Considering the complexity and potential seriousness of DKA, the laboratory diagnosis is straightforward. With a known diabetic patient, the presence of urine ketones and hyperglycemia on bedside finger-stick samples provides rapid diagnostic confirmation of DKA. If a blood gas sample is obtained, it can confirm the acid-base imbalance. Other clues may be gleaned from the venous blood chemistry panel. CO2, if measured, is low in the presence of uncompensated metabolic acidosis, and the anion gap is elevated. Serum sodium may be low because water moves from the intracellular space into the extracellular (vascular) space.54 The serum potassium level may be elevated, as potassium moves from inside the cell to the extracellular space.54
Medical Management
Diagnosis of DKA is based on the combination of presenting symptoms, patient history, medical history (type 1 diabetes), precipitating factors (if known), and results of serum glucose and urine ketone testing. After diagnosis, DKA requires aggressive clinical management to prevent progressive decompensation. The goals of treatment are to reverse dehydration, replace insulin, reverse ketoacidosis, and replenish electrolytes.
Reversing Dehydration
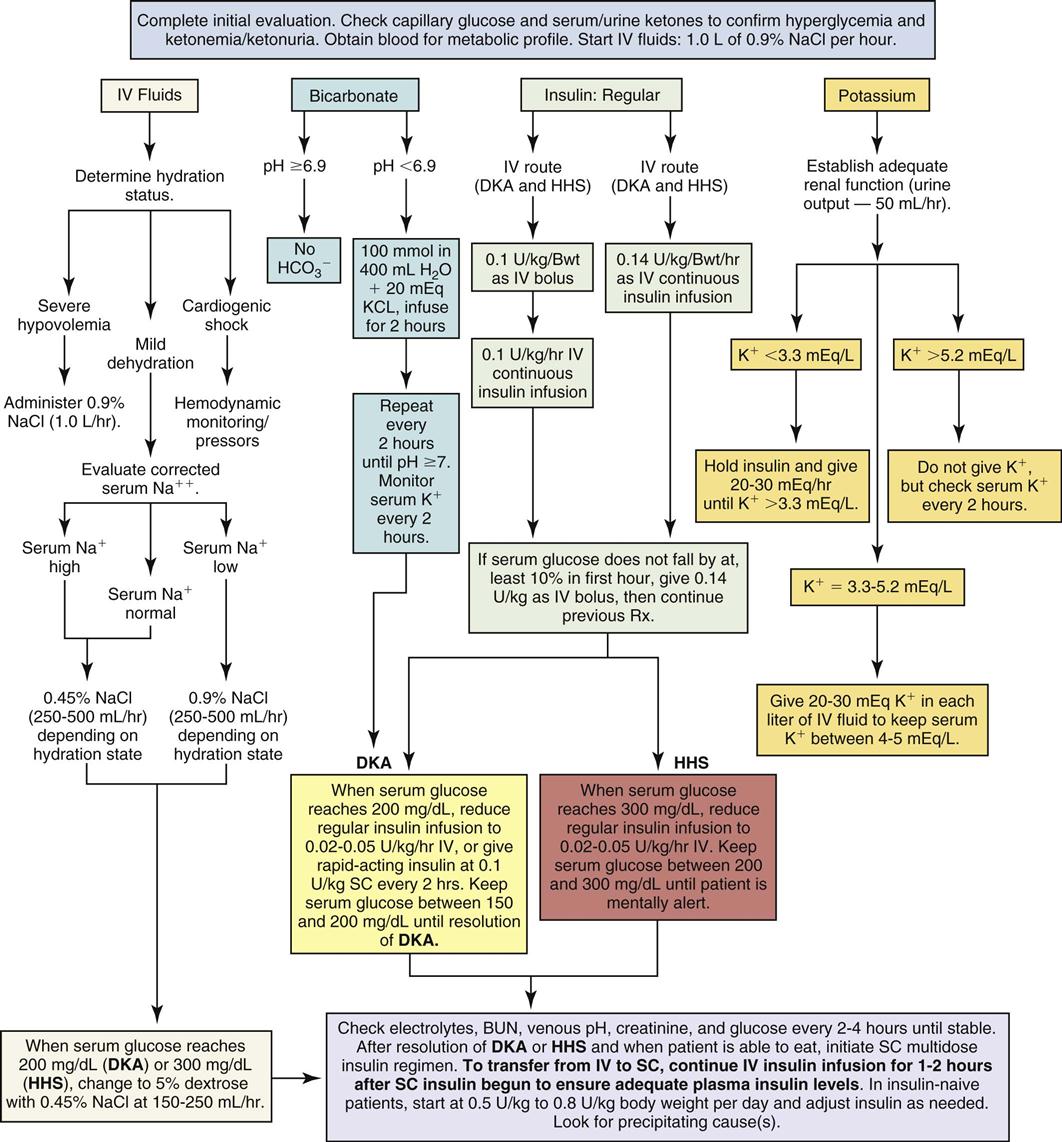
The patient with DKA is dehydrated and may have lost 5% to 10% of body weight in fluids. A fluid deficit of up to 6 L can exist in severe dehydration. Aggressive fluid replacement is provided to rehydrate the intracellular and extracellular compartments and prevent circulatory collapse (Figure 24-3).54 Assessment of hydration is an important first step in the treatment of DKA.
Intravenous isotonic normal saline (0.9% NaCl) is infused to replenish the vascular deficit and to reverse hypotension. For the severely dehydrated patient, 1 L of normal saline is infused immediately. Laboratory assessment of serum osmolality and the serum sodium concentration can help guide the subsequent interventions.
After the serum glucose level decreases to 200 mg/dL, the infusing solution is changed to a 50/50 mix of hypotonic saline (0.45% NaCl) and 5% dextrose, infused at 150 to 250 mL/hour.54 Dextrose is added to replenish depleted cellular glucose as the circulating serum glucose level falls. Dextrose infusion also prevents unexpected hypoglycemia when the insulin infusion is continued but the patient cannot take in sufficient carbohydrate from an oral diet.
Replacing Insulin
In moderate to severe DKA, an initial intravenous (IV) bolus of regular insulin at 0.1 unit for each kilogram of body weight is administered.54 Subsequently, a continuous infusion of regular insulin at 0.1 unit/kg/hr is infused simultaneously with intravenous fluids (see Figure 24-3).54 The plasma glucose concentration is expected to fall by 50 to 75 mg/dL per hour with this regimen. The glucose measurement should be rechecked and the hydration status of the patient re-evaluated. Figure 24-3 is a diagrammatic representation of intravenous and subcutaneous insulin administration options in DKA.
Frequent assessment of the patient’s blood glucose concentration is mandatory in moderate to severe DKA. Initially, blood glucose tests are performed hourly. The frequency then decreases to every 2 to 4 hours as the patient’s blood glucose level stabilizes and approaches normal. After the level has decreased to 200 mg/dL, the acidosis has been corrected, and rehydration has been achieved, the insulin IV infusion rate may be decreased to 0.02–0.05 unit/kg/hr.54 It is important to verify that the serum potassium concentration is not lower than 3.3 mEq/L and to replace potassium if necessary, before administering the initial insulin bolus.54
Reversing Ketoacidosis
Replacement of fluid volume and insulin interrupts the ketotic cycle and reverses the metabolic acidosis. In the presence of insulin, glucose enters the cells, and the body ceases to convert fats into glucose.
Adequate hydration and insulin replacement usually correct the acidosis, and this treatment is sufficient for many patients with DKA. As shown in Figure 24-3, replacement of bicarbonate is no longer routine except for the severely acidotic patient with a serum pH value lower than 7.0.54 An indwelling arterial line provides access for hourly sampling of arterial blood gases (ABGs) to evaluate pH, bicarbonate, and other laboratory values in the patient with severe DKA. If an arterial line is not available, the venous pH can be used.54
Hyperglycemia usually resolves before the ketoacidemia does. In one clinical report, patients with previously diagnosed type 1 diabetes in DKA took an average of 21 hours after being started on an intravenous insulin protocol to clear ketones from the urine; the infusion was continued for 36 hours until the patients could tolerate an oral diet; and the patients received a total of 9.5 L of normal saline for rehydration.55 Patients who are newly diagnosed with type 1 diabetes take longer to clear urine ketones and require more insulin to achieve normal glycemic control, compared with long-term diabetics.55
Replenishing Electrolytes
Low serum potassium (hypokalemia) occurs as insulin promotes the return of potassium into the cell and metabolic acidosis is reversed. Replacement of potassium by administration of potassium chloride (KCl) begins as soon as the serum potassium falls below normal. Frequent verification of the serum potassium concentration is required for the DKA patient receiving fluid resuscitation and insulin therapy.
The serum phosphate level is sometimes low (hypophosphatemia) in DKA. Insulin treatment may make this more obvious as phosphate is returned to the interior of the cell. If the serum phosphate level is less than 1 mg/dL, phosphate replacement is recommended.54 See Figure 24-3 for further information about potassium replacement options.
Nursing Management
Nursing management of the patient with DKA incorporates a variety of nursing diagnoses (Nursing Diagnoses Priorities Box on Diabetic Ketoacidosis). Nursing priorities are directed toward (1) administering fluids, insulin, and electrolytes; (2) monitoring response to therapy; (3) surveillance for complications; and (4) providing patient education.
Administering Fluids, Insulin, and Electrolytes
Rapid intravenous fluid replacement requires the use of a volumetric pump. Insulin is administered intravenously to patients who are severely dehydrated or have poor peripheral perfusion, to ensure effective absorption. Patients with DKA are kept on NPO status (nothing by mouth) until the hyperglycemia is under control. Throughout the insulin therapy, the patient’s response and the laboratory data are assessed for changes relating to blood glucose levels. The critical care nurse is responsible for monitoring the rate of plasma glucose decline in response to insulin. The goal is to achieve a fall in glucose levels of approximately 50 to 75 mg/dL each hour.54 The coordination involved in monitoring blood glucose, potassium, and often blood gases on an hourly basis is considerable.
When the blood glucose level falls to 200 mg/dL, a 5% dextrose solution (D5W) with 0.45% NaCl solution is infused to prevent hypoglycemia.54 At this time, it is likely that the insulin dose per hour will also be decreased. The regular insulin drip is not discontinued until the ketoacidosis subsides, as identified by absence of ketones and a normal pH by arterial or venous blood gas analysis.54
Insulin is given subcutaneously after glucose levels, dehydration, hypotension, and acid-base balance are normalized and the patient is in stable condition and taking an oral diet.
Monitoring Response to Therapy
Accurate intake and output (I&O) measurements must be maintained to monitor reversal of dehydration. Hourly urine output is an indicator of kidney function and provides information to prevent overhydration or underhydration. Vital signs, especially heart rate (HR), hemodynamic values, and blood pressure (BP), are continuously monitored to assess response to the fluid replacement. Evidence that fluid replacement is effective includes normal central venous pressure (CVP), decreased HR, and normal BP. Box 24-1 lists the standard features to be included in an assessment of hydration status. More invasive hemodynamic monitoring, such as a pulmonary artery catheter, is rarely needed. Further evidence of hydration improvement includes a change from a previously weak pulse to a pulse that is strong and full, and a change from hypotension to a gradual elevation of systolic BP. Respirations are assessed frequently for changes in rate, depth, and presence of the fruity acetone odor.
Blood glucose is measured each hour in the initial period. Sometimes, potassium is measured just as frequently. The serum osmolality and serum sodium concentration are evaluated, and blood urea nitrogen (BUN) and creatinine levels are assessed for possible kidney impairment related to decreased renal perfusion. The purpose of these frequent assessments is to determine that the patient’s clinical status is improving. After the patient has stable laboratory indicators and is awake and alert, the transition to subcutaneous insulin and an oral diet can be made. Hypoglycemia is a risk during the transition period. For example, in anticipation of discontinuing the insulin and intravenous dextrose infusion, a patient receives a subcutaneous dose of insulin and is expected to eat a meal. However, if the patient is then unable to eat an adequate amount, hypoglycemia results from the administration of subcutaneous insulin without adequate glucose.55
The markers for resolution of DKA include a blood glucose level lower than 200 mg/dL, absence of ketones in the blood, a serum bicarbonate level greater than 18 mEq/L, and a venous pH level greater than 7.3.54
Surveillance for Complications
The patient in DKA can experience a variety of complications, including fluid volume overload, hypoglycemia, hypokalemia or hyperkalemia, hyponatremia, cerebral edema, and infection.
Fluid Volume Overload
Fluid overload from rapid volume infusion is a serious complication that can occur in the patient with a compromised cardiopulmonary system or kidneys. Neck vein engorgement, dyspnea without exertion, and pulmonary crackles on auscultation signal circulatory overload. Reduction in the rate and volume of infusion, elevation of the head of the bed, and provision of oxygen may be required to manage the increased intravascular volume. Hourly urine measurement is mandatory to assess renal output and adequacy of fluid replacement.
Hypoglycemia
Hypoglycemia is defined as a serum glucose level lower than 70 mg/dL.41 Most acute care hospitals have specific procedures for management of the hypoglycemic patient. For example, if hypoglycemia is detected by finger-stick point-of-care testing at the bedside, a blood sample is sent to the laboratory for verification, the physician is notified immediately, and replacement glucose is given intravenously or orally, depending on the patient’s clinical condition, diagnosis, and level of consciousness.
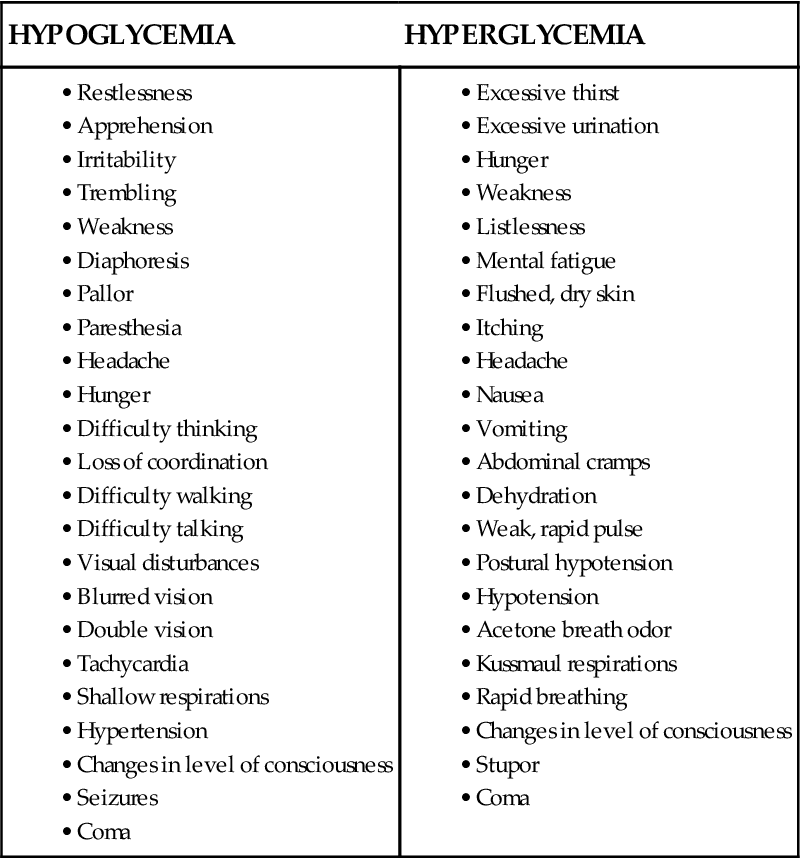
Unexpected behavior change or decreased level of consciousness, diaphoresis, and tremors are physical warning signs that the patient has become hypoglycemic. These symptoms are especially important to recognize if the frequency of glucose testing has lengthened to 2- to 4-hour intervals. A comparison between the physical symptoms expected with hypoglycemia and those of hyperglycemia is provided in Box 24-2.
Box 24-2
Clinical Manifestations of Hypoglycemia and Hyperglycemia
Hypokalemia and Hyperkalemia
Hypokalemia can occur within the first 4 hours of rehydration and insulin treatment. Continuous cardiac monitoring is required, because low serum potassium (hypokalemia) can cause ventricular dysrhythmias.
Hyperkalemia occurs with acidosis or with overaggressive administration of potassium replacement in patients with compromised kidney function. Severe hyperkalemia is demonstrated on the cardiac monitor by a large, peaked T-wave; flattened P-wave; and widened QRS complex. See Figure 11-45 in Chapter 11. Ventricular fibrillation can follow if the hyperkalemia is not corrected.
Hyponatremia
Sodium elimination from the body results from the osmotic diuresis and is compounded by the vomiting and diarrhea that occur during DKA. Clinical manifestations of hyponatremia include abdominal cramping, apprehension, postural hypotension, and unexpected behavioral changes. Sodium chloride is infused as the initial intravenous solution. Maintenance of the saline infusion depends on clinical manifestations of sodium imbalance and serum laboratory values.
Risk for Cerebral Edema
Changes in the patient’s neurological status may be insidious. Alterations in level of consciousness, pupil reaction, and motor function may be the result of fluctuating glucose levels and cerebral fluid shifts. Confusion and sudden complaints of headache are ominous signs that may signal cerebral edema. These observations require immediate action to prevent neurological damage. Neurological assessments are performed every hour or as needed during the acute phase of hyperglycemia and rehydration. Assessment of level of consciousness (LOC) is the index of the brain’s response to rehydration therapy.
Skin Integrity
Skin care takes on new dimensions for the patient with DKA. Dehydration, hypovolemia, and hypophosphatemia interfere with oxygen delivery at the cell site and contribute to inadequate perfusion and tissue breakdown. Patients must be repositioned frequently to relieve capillary pressure and promote adequate perfusion to body tissues. The typical patient with type 1 diabetes is of normal weight or underweight. Bony prominences must be assessed for tissue breakdown, and the patient’s body weight must be repositioned every 1 to 2 hours. Irritation of skin from adhesive tape, shearing force, and detergents should be avoided. Maintenance of skin integrity prevents unwanted portals of entry for microorganisms. Diabetic patients are at high risk of microvascular complications that decrease circulation to the legs and feet. This can result in diabetic ulcers and foot infections that require specialized wound care assessment and treatment.
Oral care, including tooth brushing and use of lip balm, helps keep lips supple and prevents cracking. Prepared sponge sticks or moist gauze pads can be used to moisten oral membranes of the unconscious patient. Swabbing the mouth moistens the tissue and displaces the bacteria that collect when saliva, which has a bacteriostatic action, is curtailed by dehydration. The conscious patient must be provided the means to self-remove oral bacteria by tooth brushing and frequent oral rinsing.
Risk for Infection
Strict sterile technique is used to maintain all intravenous systems. All venipuncture sites are checked every 4 hours for signs of inflammation, phlebitis, or infiltration. Strict surgical asepsis is used for all invasive procedures. Sterile technique is used if urinary catheterization is necessary to obtain urine samples for testing. Urinary catheter care is provided per hospital protocol.
Providing Patient Education
It is important to be aware of the knowledge level and compliance history of patients with previously diagnosed diabetes to formulate an appropriate teaching plan. Learning objectives include a discussion of target glucose levels, definition of hyperglycemia and its causes, harmful effects, symptoms, and how to manage insulin and diet when one is unwell and unable to eat.55 Additional objectives include a definition of DKA and its causes, symptoms, and harmful consequences. The patient and family are also expected to learn the principles of diabetes management. Universal precautions must be emphasized for all family caregivers.34 The patient and family must also learn the warning signs to report to the attention of a health care practitioner. Education of the patient, family, or other support persons is crucial to achieve knowledge-based, independent self-management of blood glucose level and avoidance of diabetes-related complications, which are the ultimate goals of the teaching process.
Collaborative Management
In all aspects of patient care management, health care professionals work as a team with the major collaborative goal of providing the best possible outcome for each patient. Current guidelines related to collaborative management of patients with hyperglycemia crisis are in the Evidence-Based Collaborative Practice Box on Diabetic Ketoacidosis.
Hyperglycemic Hyperosmolar State
Epidemiology and Etiology
HHS is a potentially lethal hyperglycemic complication of type 2 diabetes. The hallmarks of HHS are extremely high levels of plasma glucose with resultant elevation in hyperosmolality causing osmotic diuresis. Ketosis is absent or mild (see Table 24-3). Inability to replace fluids lost through diuresis leads to profound dehydration and changes in level of consciousness. The mortality rate from HHS is 5% to 20%.54 However, because patients with HHS have type 2 diabetes as an underlying disorder, they are older and have associated illnesses, which increase their mortality risk. When the mortality rate for diabetic patients is stratified by age, there is no difference based on the underlying hyperglycemic crisis (HHS or DKA). For HHS patients younger than 75 years, the mortality rate is 10%; for those age 75 to 84 years, it is 19%; and for those older than 85 years, it is 35%.56
The diagnostic criteria for HHS are as follows:54
Most patients with this level of metabolic disruption experience visual changes, mental status changes, and potentially hypovolemic shock.
HHS occurs when the pancreas produces a relatively insufficient amount of insulin for the high levels of glucose that flood the bloodstream. HHS primarily affects older, obese persons with underlying cardiovascular conditions. Infection is the primary reason that type 2 diabetics develop HHS; the most common infections are pneumonia and urinary tract infections. The patient may have type 2 diabetes treated with diet and oral hypoglycemic agents that is destabilized by an infection. Other precipitating causes of HHS include stroke, myocardial infarction, trauma, burns, and the stress of a major illness. Many classes of medications have been associated with the development of HHS, including corticosteroids, phenytoin, thiazide diuretics, beta-blockers, dobutamine, terbutaline, and antipsychotics.54,55
Differences between Hyperglycemic Hyperosmolar State and Diabetic Ketoacidosis
Clinically, HHS is distinguished from DKA by the presence of extremely elevated serum glucose, more profound dehydration, and minimal or absent ketosis (see Table 24-3). Another major difference is that protein and fats are not used to create new supplies of glucose in HHS as they are in DKA; as a result, the ketotic cycle is never started or does not occur until the glucose level is extremely elevated. Patients with type 1 diabetes do not develop HHS, whereas some patients with type 2 diabetes do develop DKA.54,55
Pathophysiology
HHS represents a deficit of insulin and an excess of glucagon (see Figure 24-2). Reduced insulin levels prevent the movement of glucose into the cells, allowing glucose to accumulate in the plasma. The decreased insulin triggers glucagon release from the liver, and hepatic glucose is poured into the circulation. As the number of glucose particles increases in the blood, serum hyperosmolality increases. In an effort to decrease the serum osmolality, fluid is drawn from the intracellular compartment (inside the cells) into the vascular bed. Profound intracellular volume depletion occurs if the patient’s thirst sensation is absent or decreased. HHS may evolve over days or even weeks.54
Hemoconcentration persists despite removal of large amounts of glucose in the urine (glycosuria). The glomerular filtration and elimination of glucose by the kidney tubules is ineffective in reducing the serum glucose level sufficiently to maintain normal glucose levels. The hyperosmolality and reduced blood volume stimulate release of ADH to increase the tubular resorption of water. ADH, however, is powerless to overcome the osmotic pull exerted by the glucose load. Excessive fluid volume is lost at the kidney tubule, with simultaneous loss of potassium, sodium, and phosphate in the urine. This chain of events results in progressively worsening hypovolemia.
Hypovolemia reduces renal perfusion and oliguria develops. Although this process conserves water and preserves the blood volume, it prevents further glucose loss, and hyperosmolality increases. Ketosis is absent or mild in HHS. However, the patient with HHS who has an extremely elevated serum glucose level (>1000 mg/dL) can develop a metabolic acidosis from dehydration, poor tissue perfusion, and lactic acid accumulation.
The SNS reacts to the body’s stress response to try to restore homeostasis. Epinephrine, a potent stimulus for gluconeogenesis, is released, and additional glucose is added to the bloodstream.
Unless the glycemic diuresis cycle is broken by aggressive fluid replacement and insulin administration, intracellular dehydration negatively affects fluid and oxygen transport to the brain cells. Central nervous system dysfunction may result and may lead to coma. Hemoconcentration increases the blood viscosity, which may result in clot formation, thromboemboli, and cerebral, cardiac, and pleural infarcts.
Assessment and Diagnosis
Clinical Manifestations
HHS has a slow, subtle onset and develops over several days. Initially, the symptoms may be nonspecific and may be ignored or attributed to the patient’s concurrent disease processes. History reveals malaise, blurred vision, polyuria, polydipsia (depending on the patient’s thirst sensation), weight loss, and advancing weakness.56 Medical attention may not be obtained for these nonspecific, nonacute symptoms until the patient is unable to take sufficient fluids to offset the fluid losses. Progressive dehydration follows and leads to mental confusion, convulsions, and eventually coma, especially in older patients.
The physical examination may reveal a profound fluid deficit. Signs of severe dehydration include longitudinal wrinkles in the tongue, decreased salivation, and decreased CVP, with increases in HR and rapid respirations (Kussmaul air hunger does not occur). In older patients, assessment of clinical signs of dehydration is challenging. Neurological status is affected as the serum glucose climbs, especially at levels greater than 1500 mg/dL. Without intervention, obtundation and coma occur.
Laboratory Studies
Laboratory findings are used to establish the definitive diagnosis of HHS. Plasma glucose levels are strikingly elevated (>600 mg/dL). Serum osmolality is greater than 320 mOsm/kg. Acidosis is absent (arterial pH >7.3), and the serum bicarbonate concentration is greater than 18 mEq/L. Ketonuria is absent or mild.54 The patient may have an elevated hematocrit and depleted potassium and phosphorus levels.
Point-of-care finger-stick or arterial-line testing of glucose at the bedside is the usual method for frequent monitoring of the serum blood glucose. Insulin replacement is then prescribed according to the blood glucose result. Some electrolytes also can be tested at the bedside (potassium, sodium, ionized calcium), but usually an arterial line is required for frequent blood access. If point-of-care testing is not available, traditional serial laboratory tests keep the clinician apprised of the fluctuating serum electrolyte levels and provide the basis for electrolyte replacement. Intracellular potassium and phosphate levels usually are depleted as a result of dehydration.
Medical Management
The goals of medical management are rapid rehydration, insulin replacement, and correction of electrolyte abnormalities, specifically potassium replacement. The underlying stimulus of HHS must be discovered and treated. The same basic principles used to treat DKA are used for the patient with HHS.
Rapid Rehydration
The primary intervention for HHS is rapid rehydration to restore the intravascular volume. The fluid deficit may be as much as 15 to 20 mL/kg/hour. The average 150-pound adult can lose more than 7 to 10 L of fluid.
The total body deficit of sodium and potassium may be as high as 500 to 700 mEq. Physiological saline solution (0.9%) is infused at 1 L/hr, especially for the patient in hypovolemic shock. Between 6 and 10 L of fluid replacement in the first 10 hours may be required to achieve a BP and CVP within normal range. This may necessitate an initial infusion rate of 250 to 500 mL/hour with infusion volumes adjusted according to the patient’s hydration state and sodium level (see Figure 24-3).54
The serum sodium concentration is the parameter that is monitored to determine whether to change from isotonic (0.9%) to hypotonic (0.45%) saline. For example, patients with sodium levels equal to or less than 140 mEq/L may be given 0.9% normal saline solution, whereas those with levels greater than 140 mEq/L are given 0.45% saline solution (see Figure 24-3). In reality, it is difficult to assess the serum sodium level in the presence of hemoconcentration. Another recommendation is to calculate a corrected sodium value. This involves adding 1.6 mEq to the sodium laboratory value for each 100 mg/dL plasma glucose above normal.54 Sodium input should not exceed the amount required to replace the losses. Careful monitoring of the serum sodium level is recommended to avoid a sodium-water imbalance and hemolysis as hemoconcentration is reduced.
To prevent hypoglycemia, when the serum glucose decreases to 300 mg/dL, change the hydrating solution to D5W with 0.45% NaCl to infuse at 150 to 250 mL/hr.54
Insulin Administration
Volume resuscitation lowers the serum glucose level and improves symptoms even without insulin administration.56 However, insulin replacement is recommended in the treatment of HHS because of clinical reports that acidosis can develop if insulin is withheld.56 Insulin is given to facilitate the cellular use of glucose.
Methods to lower the blood glucose level vary. One method is to administer an intravenous bolus of regular insulin (0.1 unit/kg of body weight) initially, followed by a continuous insulin drip. Regular insulin, infusing at an initial rate calculated as 0.1 unit/kg hourly (e.g., 7 units/hr for a person weighing 70 kg) should lower the plasma glucose concentration by 50 to 75 mg/dL per hour. If the measured glucose level does not decrease by at least 10%, 0.14 insulin unit/hour may be given as a bolus.54 The goal is to reduce the blood glucose by 50 to 75 mg/dL per hour.54
Insulin Resistance
Patients with HHS have underlying type 2 diabetes; many have metabolic syndrome and exhibit signs of insulin resistance.48 In critical illness, the presence of counter-regulatory hormones, also known as stress hormones (cortisol, glucagon, GH, epinephrine), increases glucose production and also induces insulin resistance.56 Patients with HHS may initially require supraphysiological doses of insulin to overcome the hyperglycemia and insulin resistance.56 Hourly serial monitoring of the blood glucose level permits safe glycemic management and avoids the most common complication, which is hypoglycemia caused by overzealous insulin administration.54 After the patient is over the hyperglycemic crisis and insulin has been discontinued, oral agents designed to decrease insulin resistance in type 2 diabetics are prescribed.
Electrolyte Replacement
Increasing the circulating levels of insulin with therapeutic doses of intravenous insulin promotes the rapid return of potassium and phosphorus into the cell. Serial laboratory tests keep the clinician apprised of the serum electrolyte levels and provide the basis for electrolyte replacement. Potassium typically is added to the intravenous infusion (see Figure 24-3). If the serum potassium concentration is lower than 3.3 mEq/L, it is essential to replenish the serum potassium before giving insulin.54 Many hospitals have potassium replacement algorithms that are used to treat hypokalemia. Serum phosphate levels are carefully monitored, and phosphate replaced if the level is lower than 1.0 mg/dL.54
Nursing Management
Nursing management of the patient with HHS incorporates a variety of nursing diagnoses (see the Nursing Diagnosis Priorities Box on Hyperglycemic Hyperosmotic State). Nursing priorities are directed toward (1) administering fluids, insulin, and electrolytes; (2) monitoring response to therapy; (3) surveillance for complications; and (4) providing patient education.
Administering Fluids, Insulin, and Electrolytes
Rigorous fluid replacement and continuous intravenous insulin replacement must be controlled with an electronic volumetric pump. Accurate I&O measurements are maintained to monitor fluid balance. I&O measurements include the total of all fluids administered minus hourly losses, typically urine output and sometimes emesis. Hemodynamic monitoring may include use of an arterial line and measurements of CVP if the patient manifests signs of hypovolemic shock. Arterial line access is very helpful in monitoring serial blood glucose and electrolyte values. The use of a blood conservation system on the arterial line is essential to avoid iatrogenic exsanguination of the patient. Most critical care units have developed protocols or guidelines to ensure that patients in hyperglycemic crisis are managed safely (see Figure 24-3). The major responsibility for delivery of insulin, hourly monitoring of blood glucose, and infusion of appropriate crystalloid solutions lies with the critical care nurse. Many hospitals mandate a double-check procedure for medications such as insulin that have the potential to cause harm if wrongly administered.
Monitoring Response to Therapy
The BP, HR, and CVP are monitored to evaluate the degree of dehydration, the effectiveness of hydration therapy, and the patient’s fluid tolerance. Because patients with HHS have underlying type 2 diabetes and, if older, are likely to have preexisting illnesses such as heart failure and kidney failure, it is important to monitor for symptoms of circulatory overload. Symptoms to anticipate include elevated CVP, tachycardia, bounding pulse, dyspnea, tachypnea, lung crackles, and engorged neck veins. The astute critical care nurse is aware of the clinical manifestations of fluid overload and observes for potential complications when rehydrating the patient with HHS and cardiac, pulmonary, or renal disease.
The serum glucose level should decrease by 50 to 75 mg/dL per hour with insulin administration.54 This decrease is monitored by hourly blood glucose determinations. Based on the glucose result, the critical care nurse can alter the infusion of insulin according to hospital protocol (see Figure 24-3).
Surveillance for Complications
The potential complications of HHS are similar to those described for DKA: hypoglycemia, hypokalemia or hyperkalemia, and infection. The patient with HHS is at risk for other complications specific to associated disease entities. A history of cardiovascular, pulmonary, or kidney disease, whether known or latent, places HHS patients at high risk for complications.
Providing Patient Education
As the patient’s condition improves and the patient demonstrates readiness to learn, education about type 2 diabetes and avoiding a recurrence of HHS becomes a priority. Most teaching occurs after the patient has left the critical care unit. Teaching topics include a description of type 2 diabetes and how it relates to HHS, dietary restrictions, exercise requirements, medication protocols, home testing of blood glucose, signs and symptoms of hyperglycemia and hypoglycemia, foot care, and lifestyle modifications if cardiovascular disease is present.
Collaborative Management
Because HHS is an acute condition superimposed on the chronic health problem of type 2 diabetes, many health professionals provide care and work collaboratively to restore homeostasis for each patient (Evidence-Based Collaborative Practice Box on Hyperglycemic Hyperosmolar State).
Diabetes Insipidus
Diabetes insipidus (DI) is recognized by the vast quantities of very dilute urine not caused by administration of diuretics or a fluid challenge. In the critically ill patient, the extreme diuresis is most likely to be caused by a lack of ADH (vasopressin). Any patient who has head trauma or has undergone neurosurgery has an increased risk of developing DI. Ordinarily, ADH is produced in the hypothalamus and stored in the posterior pituitary gland. ADH is normally released in response to elevations in serum osmolality and secondarily in reaction to hypovolemia or hypotension.57 DI can occur if (1) the hypothalamus produces insufficient ADH, (2) the posterior pituitary fails to release ADH, or (3) the kidney nephron is resistant (unresponsive) to ADH.58
Etiology
DI is divided into three types according to cause: central, nephrogenic, and psychogenic (Box 24-3). Only central DI, also known as neurogenic DI because of its association with the brain, is encountered with any frequency in the critical care unit.
Central Diabetes Insipidus
In central DI, there is an inability to secrete an adequate amount of arginine vasopressin in response to an osmotic or nonosmotic stimuli, resulting in inappropriately dilute urine.59,60 The synthesis of ADH is incomplete in the hypothalamus, or the release of ADH from the pituitary is interrupted. Central DI can be congenital or idiopathic. In critical care, the most likely acute cause of central DI is neurosurgery, traumatic head injury, tumors, increased intracranial pressure, brain death, and infections such as encephalitis or meningitis. Among patients undergoing surgery on the pituitary gland, DI occurs in approximately 12% and is permanent in 3%.61 The degree of hormone replacement required after surgery depends on the quantity of pituitary tissue removed.61 One prospective study reported the incidence of central DI to be 15% among patients with traumatic brain injury.62
Nephrogenic Diabetes Insipidus
Nephrogenic DI is a rare congenital or acquired disorder that occurs when the V2 receptors on the kidney tubule become nonresponsive to the action of ADH. Some drugs cause nephrogenic DI by decreasing the responsiveness of the kidney tubules to ADH. Long-term use of lithium carbonate, prescribed for bipolar disorder, was a frequent culprit in the past.63
Psychogenic Diabetes Insipidus
Psychogenic DI is a rare form of the disease that occurs with compulsive drinking of more than 5 L of water daily. Long-standing psychogenic DI closely mimics nephrogenic DI because the kidney tubules become less responsive to ADH as a result of prolonged conditioning to hypotonic urine. This condition is uncommonly seen in the critical care unit.
Pathophysiology
The purpose of ADH is to maintain normal serum osmolality and circulating blood volume. Normally, ADH binds to the V2 receptors on the kidney collecting tubules, causing insertion of water channels, known as aquaporins, along the luminal surface.57 Even small (1% to 2%) increases in plasma osmolality are sufficient to stimulate ADH release.57 Although there are several types of DI, this discussion focuses on neurogenic (central) DI, the condition encountered in the critical care unit after neurosurgery or head injury56 (Figure 24-4).
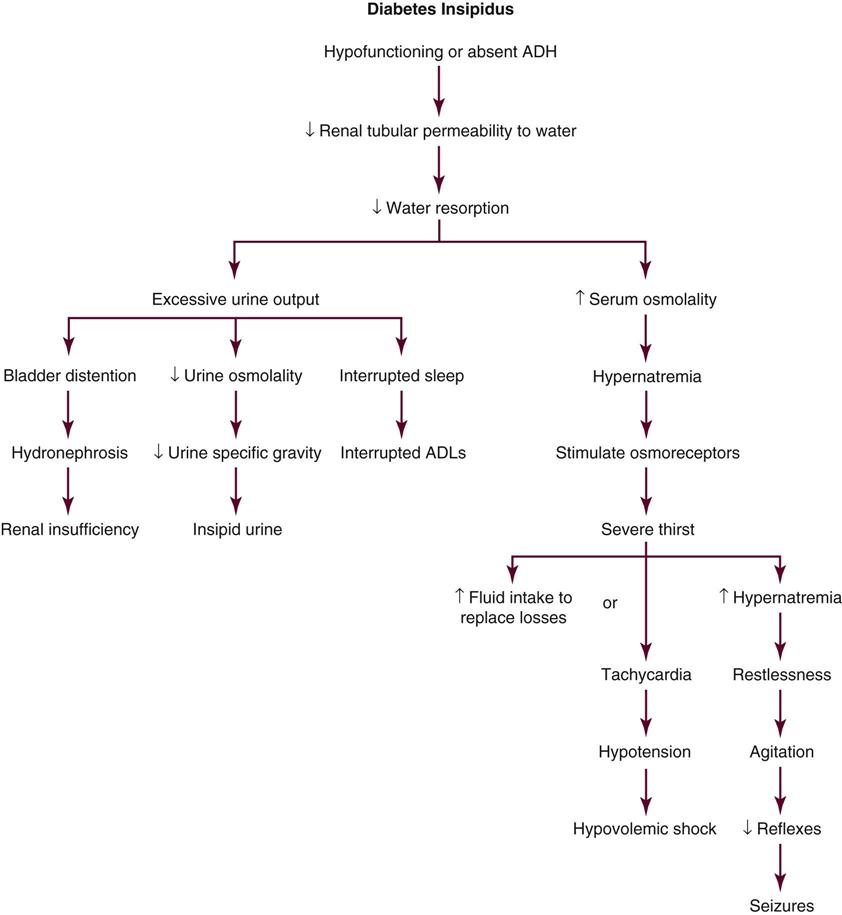
In DI, as free water is eliminated, the urine osmolality and specific gravity decrease (dilute urine). At the same time, in the bloodstream, the serum sodium concentration and serum osmolality rise above 290 mOsm per kilogram of H2O (290 mmol/L).57 Normally at 295 mOsm/kg H2O, the thirst sensors are activated in the hypothalamus, which triggers the synthesis and release of ADH.57 In central DI, however, no ADH is released, or the ADH released is insufficient. Without ADH, the kidney collecting tubules are incapable of concentrating urine and retaining water.
As extracellular dehydration ensues, hypotension and hypovolemic shock occur. If the person is alert, extreme thirst will drive the person to drinking lots of water. This excessive intake of water reduces the serum osmolality to a more normal level and prevents dehydration. In the person with decreased level of consciousness, the polyuria leads to severe hypernatremia, dehydration, decreased cerebral perfusion, seizures, loss of consciousness, and death.
Assessment and Diagnosis
Clinical Manifestations
The clinical diagnosis is made based on the dramatic increase in dilute urine output occurring in the absence of diuretics, a fluid challenge, or hyperglycemia. Central DI is anticipated in conditions in which the underlying disease process is likely to disrupt posterior pituitary function. Central DI that occurs because of increasing intracranial pressure is life-threatening. It is imperative that the underlying condition be recognized and treated. In this situation, medications that treat DI are not sufficient.
Laboratory Studies
The core diagnostic tests used to establish the presence of DI and that evaluate the body’s ability to balance fluid and electrolytes are not specific to the endocrine system. The most common laboratory tests are serum sodium concentration, serum osmolality, and urine osmolality (Table 24-4). The combination of an obvious clinical picture with high volumes of hypotonic urine, in the presence of the following laboratory criteria, is sufficient to diagnose central DI:60
• Serum sodium level >145 mEq/L
• Serum osmolality >295 mOsm/kg H2O (>295 mmol/L)
TABLE 24-4
| VALUE | NORMAL | DI | SIADH |
| Serum ADH | 1-5 pg/mL | Decreased in central DI | Elevated |
| Serum osmolality (mOsm/L) | 275-295* | >295* | <270 |
| Serum sodium (mEq/L) | 135-145 | >145 | <120 |
| Urine osmolality (mOsm/L) | 300-1400 | <300 | Increased |
| Urine specific gravity | 1.005-1.030 | <1.005 | >1.030 |
| Urine output | 1.0-1.5 L/day | 1.0-1.5 L/hr | Below normal |
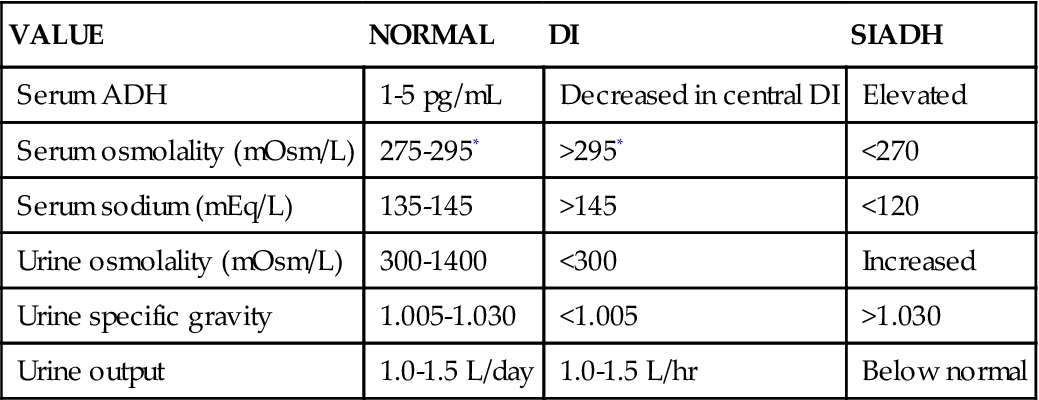
*Some hospitals use 280-300 mOsm/L as the normal reference value.
Serum Sodium
The normal serum sodium concentration is 140 mEq/L (range, 135 to 145 mEq/L). In central DI, the serum sodium level can rise precipitously because of loss of free water. Hypernatremia is always associated with serum hyperosmolality.64
Serum Osmolality Test
Serum osmolality has a narrow normal range, 275 to 295 mOsm/kg. Severe DI can raise serum osmolality to greater than 320 mOsm/kg.57
Urine Osmolality
Urine osmolality is low, less than 300 mOsm/kg H2O (300 mmol/L) in patients with central DI. For greatest accuracy, the urine sample should be collected and tested simultaneously with the blood sample.
Measurement of Antidiuretic Hormone
Measurement of the baseline serum ADH level is an additional diagnostic step. This is not typically performed in critical care if the clinical circumstances (e.g., head injury with raised intracranial pressure) make further testing unnecessary. Normal ADH levels range from 1 to 5 pg/mL. Most hydrated people have a morning fasting serum level lower than 4 pg/mL.65
To test for the underlying cause of DI, exogenous ADH may be administered. An ADH plasma concentration of approximately 1 pg/mL increases urinary concentration and decreases urine flow. Maximum antidiuresis occurs at an ADH concentration of approximately 5 pg/mL.59 ADH administration (1 mcg of desmopressin (DDAVP) given subcutaneously) is used to distinguish between central DI and nephrogenic DI.64 A urine output that is greatly decreased in response to ADH administration diagnoses central DI. A urine output that is unchanged in response to ADH administration suggests nephrogenic DI.
Medical Management
Immediate management of DI requires an aggressive approach. Treatment goals include restoration of circulating fluid volume, pharmacological ADH replacement, and treatment of the underlying condition.
Volume Restoration
Fluid replacement is provided in the initial phase of the treatment to prevent circulatory collapse. Patients who are able to drink are given voluminous amounts of fluid orally to balance output. For those who are unable to take sufficient fluids orally, hypotonic intravenous solutions are infused and carefully monitored to restore the hemodynamic balance.
Medications
Central DI requires immediate pharmacological management. Table 24-5 presents the medications most frequently prescribed to treat central DI and replace ADH.
TABLE 24-5
PHARMACOLOGICAL MANAGEMENT: DIABETES INSIPIDUS (DI)
| DRUG | DOSAGE* | ACTIONS | SPECIAL CONSIDERATIONS |
| Central Diabetes Insipidus | |||
| DDAVP (available IV, as nasal spray, Rhinal tube, Rhinyle drops, Stimate) | Nasal: 10-40 mcg at bedtime or in divided doses Parenteral: 2-4 mcg twice daily |
Central DI Antidiuretic Increases water resorption in nephron Prevents and controls polydipsia, polyuria |
Few side effects Observe for nasal congestion, upper respiratory infection, allergic rhinitis. Monitor intake and output, urine osmolality, serum sodium level. |
| Vasopressin (Pitressin Synthetic, Pressyn) | Intramuscular, intravenous, subcutaneous, intra-arterial Topical: nasal mucosa |
Central DI Antidiuretic Promotes resorption of water at kidney tubule Decreases urine output Increases urine osmolality Diagnostic aid Increases gastrointestinal peristalsis |
Monitor fluid volume often, especially in older patients. Assess cardiac status. May precipitate angina, hypertension, or myocardial infarction if increased dose is given to patient with cardiac history. Parenteral extravasation can cause skin necrosis. |
| Lypressin (Diapid) | Intranasal: 1-2 sprays (7-14 mcg) in each nostril four times daily | Central DI Synthetic ADH Increases resorption of sodium and water in nephron |
Proper instillation is important for absorption and action. Patient sits upright while holding bottle upright for administration. Repeat sprays (>2-3) are ineffective and wasteful; if dose is increased to 2-3 sprays, shorten time between dosing. Cough, chest tightness, shortness of breath |
| Nephrogenic Diabetes Insipidus | |||
| Thiazide diuretics | Varies according to diuretic chosen, patient’s size, and age | Nephrogenic DI Leads to mild fluid depletion Increases resorption of water and sodium in proximal nephron; less fluid travels to distal nephron, excreting less water |
Varies according to diuretic chosen |
| Psychogenic Diabetes Insipidus | |||
| Anti-compulsive disorder drugs, anxiolytics, psychopharmacological agents | Dosage varies | Psychogenic DI | Varies according to medication chosen |
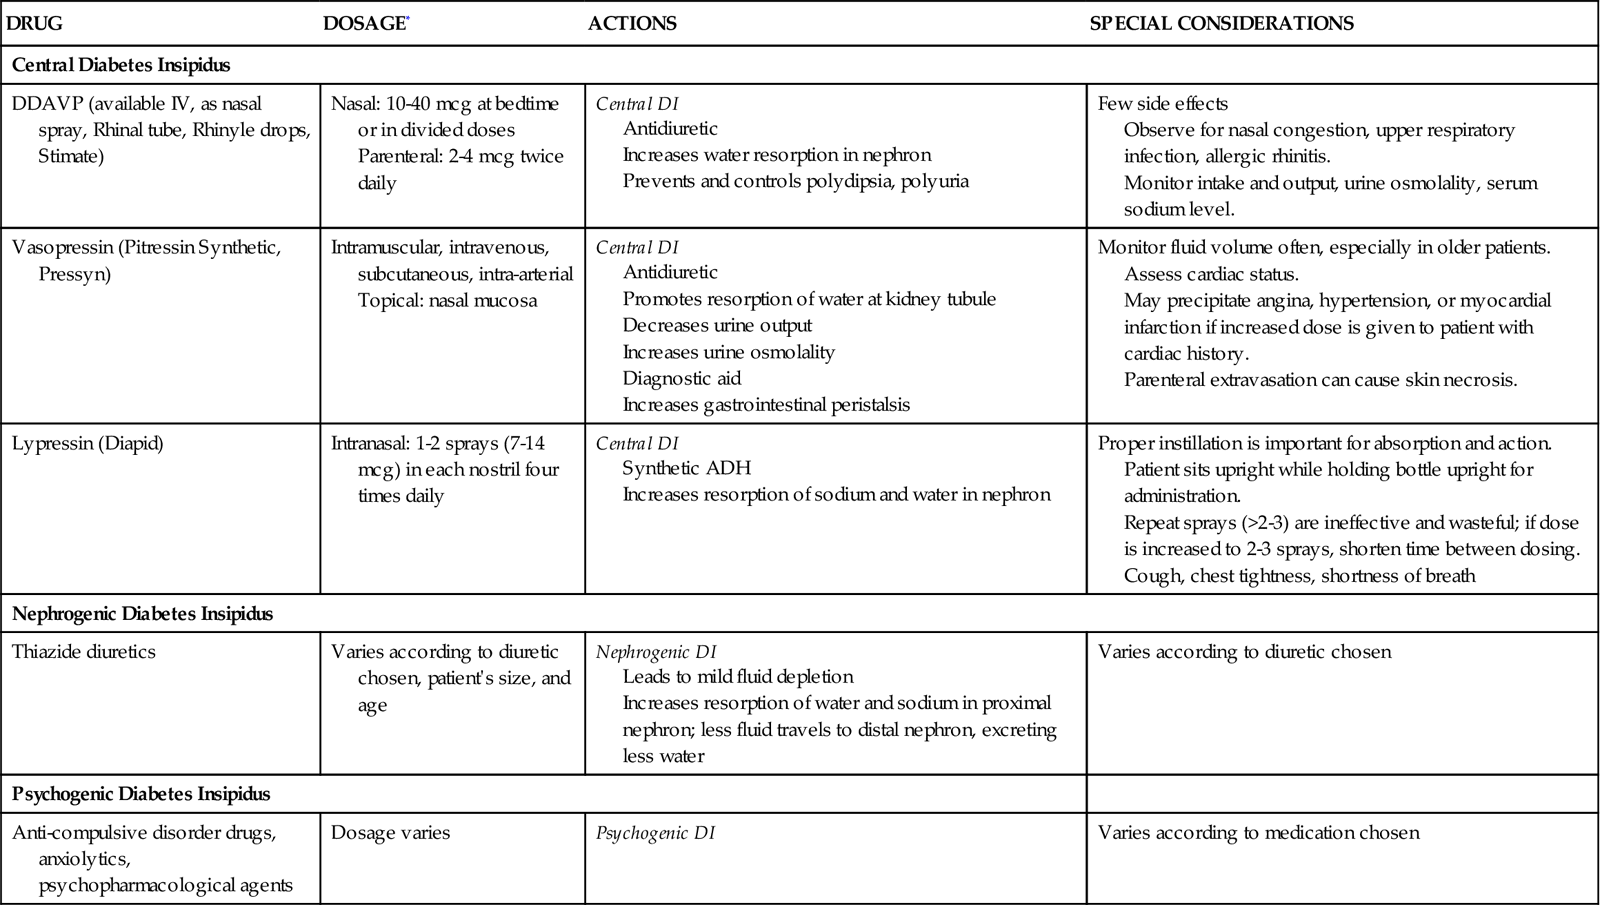
ADH, antidiuretic hormone; DI, diabetes insipidus; DDAVP, desmopressin acetate; IV, intravenous.
*Parenteral indicates intravenous or subcutaneous administration.
Medications Used for Central Diabetes Insipidus
Patients with central DI who are unable to synthesize ADH require replacement with ADH (vasopressin) or an ADH analogue. The most commonly prescribed drug is the synthetic analogue of ADH, desmopressin (DDAVP). It is preferred over vasopressin (Pitressin) because it has a stronger antidiuretic action with little effect on blood pressure. DDAVP can be given intravenously, subcutaneously, or as a nasal spray. A typical DDAVP dose is 1 to 2 mcg given intravenously or subcutaneously every 12 hours.66 Sometimes as little as 0.5 mcg is administered IV. The dosage is subsequently titrated according to the patient’s antidiuretic response to the drug. To avoid a medication error, it is important to be aware that DDAVP is also used to control hemorrhage caused by platelet disorders and that the dose ranges for all of these conditions are different.
Vasopressin (Pitressin), 5 to 10 units given intramuscularly every 3 to 4 hours, produces a reduction in urine output.66 Vasopressin acts on the V1 receptors in vascular smooth muscle and can elevate systemic blood pressure. Water intoxication also can occur if the dosage is higher than the therapeutic level. Because of the risk of hypertension, this is not typically the first drug of choice for treating central DI. Vasopressin is also prescribed for septic shock states as an intravenous infusion and for cardiac arrest as an intravenous push. Dosages for these conditions are very different from that used to treat central DI. Extreme care must be taken to ensure that all drug dosages are accurate for each specific diagnosis.
Medications Used for Nephrogenic Diabetes Insipidus
The mainstay of therapy is to stop any medications that are inducing the ADH resistance. Nephrogenic DI is not a diagnosis frequently encountered in critical care. It is treated with hydrochlorothiazide, 12.5 to 25 mg administered once or twice daily. The dosage is then titrated according to the patient’s antidiuretic response.
Nursing Management
Nursing management of the patient with DI incorporates a variety of nursing diagnoses (Nursing Diagnosis Priorities Box on Diabetes Insipidus). Nursing priorities are directed toward (1) administering fluids and medications, (2) evaluating response to therapy, (3) maintaining surveillance for complications, and (4) providing patient education.
Administrating Fluids and Medications
Rapid intravenous fluid replacement requires the use of a volumetric pump. Initially, a hypotonic intravenous solution is used to replace fluids lost and lower the serum hyperosmolality. ADH replacement is accomplished with extreme caution in the patient with a history of cardiac disease, because ADH may cause hypertension and overhydration. At the first signs of cardiovascular impairment, the drug is discontinued and fluid intake is restricted until urine specific gravity is less than 1.015 and polyuria resumes.
Evaluation of Response to Therapy
Critical assessment and management of fluid status are the most important initial concerns for the patient with DI. Monitoring of HR, BP, CVP, and pulmonary artery pressures (if a pulmonary artery catheter is in place) provides early indications of response to fluid volume replacement. I&O measurement, condition of buccal membranes, skin turgor, daily weight measurements, presence of thirst, and temperature provide a basic assessment list that is vital for the patient who is unable to regulate fluid needs and losses. Placement of a urinary catheter is essential to accurately monitor the urinary output. Simultaneous urine and blood specimens for determination of osmolality and sodium and potassium levels are collected, and the results are relayed to the physician as necessary. The patient who is unable to satisfy sensations of thirst or to complete any task or self-care activity without the need to urinate may be confused and frightened. For patients who are able to verbalize their fears, having a caring nurse who is interested and nonjudgmental helps to reduce the emotional turmoil associated with their condition.
Surveillance for Complications
The most dangerous potential complication is hypertension and vasospasm of cardiac, cerebral, or mesenteric arterial vessels in response to vasopressin replacement. In most cases, DDAVP is selected for ADH replacement to avoid this complication. A less serious complication of DI is constipation due to fluid loss; it is treated with dietary fiber, stool softeners, or both. Conversely, diarrhea, abdominal cramping, and intestinal hyperactivity may accompany vasopressin therapy. Untoward effects can be mitigated by modification of the vasopressin dose.
Patient Education
Educating the patient and the family about the disease process and how it affects thirst, urination, and fluid balance encourages patients to participate in their care. For most critical care patients, central DI is a temporary condition that resolves as the underlying medical condition (e.g., brain injury) improves. Patients who are discharged with DI are taught, along with their families, the signs and symptoms of dehydration and overhydration and procedures for accurate daily weight and urine specific gravity measurements. Printed information pertaining to drug actions, side effects, dosages, and timetable is provided, as well as an outline of factors that must be reported to the physician.
Collaborative Management
Central DI is a life-threatening condition. The collaborative assessment and clinical skills of all health care professionals and use of a clear plan of care are essential to achieve optimal outcomes for each patient.
Syndrome of Inappropriate Secretion of Antidiuretic Hormone
The opposing syndrome to DI is the syndrome of inappropriate secretion of antidiuretic hormone (SIADH), also known as the syndrome of antidiuresis (SIAD).67 The patient with SIADH has an excess of ADH secreted into the bloodstream, more than the amount needed to maintain normal blood volume and serum osmolality. Excessive water is resorbed at the kidney tubule, leading to dilutional hyponatremia.
Etiology
Numerous causes of SIADH are observed in patients who are critically ill (Box 24-4). Central nervous system injury, tumors, and diseases that interfere with the normal functioning of the hypothalamic-pituitary system can cause SIADH.67 A common cause is malignant bronchogenic small cell carcinoma.68 This type of malignant cell is capable of synthesizing and releasing ADH regardless of the body’s needs.57,69 With much less frequency, other cancers that involve the brain, head and neck, gastroenteral, gynecological, and hematological systems are capable of autonomous production of ADH.57 Levels of ADH rise with the use of positive-pressure ventilators that decrease venous return to the thorax, because they stimulate pulmonary baroreceptors to release and increase levels of circulating ADH.
Pathophysiology
ADH is a powerful, complex polypeptide compound. When released into the circulation by the posterior pituitary gland, ADH regulates water and electrolyte balance in the body. In SIADH, profound fluid and electrolyte disturbances result from the unsolicited, continuous release of the hormone into the bloodstream (Figure 24-5). Excessive ADH stimulates the kidney tubules to retain fluid regardless of need. This results in severe overhydration.
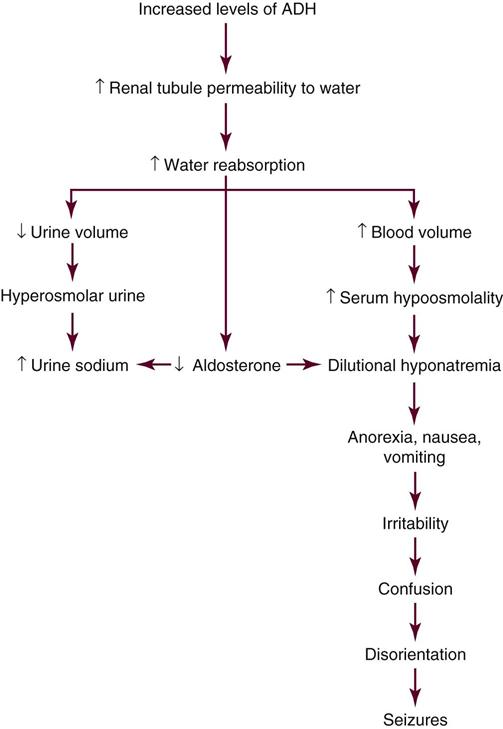
Excessive ADH dramatically alters the sodium balance in the extracellular vascular compartment. The overhydration causes a dilutional hyponatremia and reduces the sodium concentration to critically low levels. In the healthy adult, hyponatremia inhibits the release of ADH; in SIADH, however, the increased levels of circulating ADH are unrelated to the serum sodium concentration. Aldosterone production from the adrenal glands is also suppressed. Serum hypoosmolality leads to a shift of fluid from the extracellular fluid space into the intracellular fluid compartment (inside the cells) in an attempt to equalize osmotic pressure. Because minimal sodium is present in this fluid, edema usually does not result. Without ADH and aldosterone, water is retained, urine output is diminished, and further sodium is excreted in the urine. The urine has an increased osmolality from the decreased water excretion. Urinary concentration is also elevated by excess sodium in the urine. It is believed that, despite the serum hyponatremia, the increased release of ADH promotes sodium loss through the kidneys into the urine.
Assessment and Diagnosis
Clinical Manifestations
The clinical manifestations of SIADH relate to the excess fluids in the extracellular compartment and the proportionate dilution of the circulating sodium. Edema usually is not present, although slight weight gain may occur from the expanded extracellular fluid volume. Early clinical manifestations of dilutional hyponatremia include lethargy, anorexia, nausea, and vomiting. Severe neurological symptoms usually do not develop until the serum sodium concentration drops to less than 120 mEq/L.70 Progressively deteriorating neurological signs of hyponatremia then predominate, and the patient is admitted to the critical care unit. Symptoms of severe hyponatremia include inability to concentrate, mental confusion, apprehension, seizures, decreased level of consciousness, coma, and death.
Laboratory Values
Patients with SIADH present with very concentrated urine output and very dilute serum. Laboratory values confirm this clinical picture. In SIADH, the serum is hypoosmolar (<275 mOsm/kg H2O), with low serum sodium concentration and a urine osmolality greater than would be expected with such hypotonic blood (>100 mOsm/kg has been suggested).67 A serum sodium concentration of less than 125 mEq/L (<120 mEq/L according to some experts) is associated with increasing severity of neurological symptoms.64,70 An elevated urine sodium concentration, greater than 30 to 40 mEq/L, is congruent with the concentrated urine output of SIADH.64,67,70 Use of diuretics negates the reliability of the urine sodium and urine osmolality levels.70 Table 24-5 compares the typical laboratory values associated with SIADH with those of DI.
Medical Management
In the critical care unit, SIADH often occurs as a secondary disease. Ideally, recognition and treatment of the primary disease will reduce the production of ADH. If the patient is receiving any of the medications suspected of causing SIADH, discontinuing the drug may return ADH levels to normal. Some of the drugs that alter ADH levels are listed in Box 24-4. The goals of medical management are to restore fluid and sodium balance.
Fluid Restriction
The medical therapy that is the most effective (along with treatment of the primary disease) is simple reduction of fluid intake.64 This is achieved most successfully in the patient with a moderate increase in body fluid volume and hyponatremia. Although fluid restrictions are calculated on the basis of individual needs and losses, a general criterion is to restrict fluids to 500 mL less than average daily output.57
Sodium Replacement
Patients with severe hyponatremia (<125 mEq/L serum sodium) experience severe neurological symptoms, even seizures. How rapidly the sodium should be corrected and which sodium concentration to use remain controversial.71 One recommended regimen is an intravenous rate that provides sufficient sodium to raise serum sodium levels by up to 12 mEq/day for the first 24 hours (no more than 0.5 mEq each hour), with a total rise of 18 mEq/L in the initial 48 hours.64 Another option is to add furosemide (Lasix) to increase the diuresis of free water.
If hyponatremia is severe (<120 mEq/L), an infusion of 3% hypertonic saline solution may be used to replenish the serum sodium without adding extra volume. It is imperative to be aware that hypertonic saline solution is dangerous if administered too quickly, and calculation of the quantity of sodium that will be administered is advised. An example of one sodium replacement regimen is an infusion of 3% saline infusion at 35 mL/hr in a 70-kg patient, which will increase the serum sodium level by approximately 0.5 mEq/L per hour (12 mEq/day).64 Suggested end points at which to stop the acute sodium repletion include the following: (1) the patient’s symptoms are abolished; (2) a safe serum sodium level is achieved (usually >120 mEq/L); (3) a total correction of 20 mEq/L is achieved.64
Too-rapid serum sodium correction must be avoided to reduce the risk of osmotic demyelination, previously known as central pontine myelinolysis. The demyelination occurs in the pons and in other areas of the brain’s white matter.57 The lesions may be detected on imaging studies (computed tomography and magnetic resonance imaging), and severe neurological damage or death can result.57 Patients with a baseline serum sodium level lower than 120 mEq/L are most at risk.57 Serum sodium levels must be evaluated at least every 4 hours during the acute phase of sodium replacement.64
Medications
Medications are prescribed only if water restriction is ineffective in correcting the SIADH. Certain drugs decrease the output of ADH from the pituitary gland, and others increase the action of ADH on the V2 kidney tubule receptors so that more water is excreted.
Medications that Increase Kidney Water Excretion
Two classes of drugs are available to treat SIADH. Until recently, the only medication used to treat SIADH was demeclocycline, a derivative of tetracycline.64 The dosage range is from 600 to 1200 mg per day, and several days of therapy are necessary to achieve maximal effects.64 It is advisable to wait several days before changing the initial dose regimen.64
The arginine vasopressin receptor antagonists are a newer class of drugs, not yet in widespread use. Conivaptan (Vaprisol), at a dosage of 20 to 40 mg/day given IV, is approved for management of hypervolemic hyponatremia, such as SIADH. It is available in oral and IV forms and is approved for use only in hospitalized patients. Conivaptan is a nonselective vasopressin receptor antagonist, which means that it blocks V1 receptors in the vasculature and V2 receptors in the kidney.67 The patient must be observed carefully to avoid hypotension (caused by V1 receptor blockade), and hypovolemia is an absolute contraindication. New V2 receptor antagonist medications collectively known as ‘vaptans’ are becoming available for treatment of chronic hyponatremia.72,73 Vaptans block the antidiuretic effect of vasopressin by binding to V2 receptors in the kidney. V2 receptor blockade results in “water diuresis,” otherwise known as aquaresis, which reduces body water content thus raising plasma sodium levels.73
Nursing Management
Nursing management of the patient with SIADH incorporates a variety of nursing diagnoses (Nursing Diagnosis Priorities Box on Syndrome of Inappropriate Secretion of Antidiuretic Hormone). Nursing priorities are directed toward (1) restricting fluids, (2) maintaining surveillance for complications, and (3) providing patient education.
Restricting Fluids
Thorough, astute nursing assessments are required for care of the patient with SIADH while an attempt is made to correct the fluid and sodium imbalance; the systemic effects of hyponatremia occur rapidly and can be lethal. Frequent assessment of the patient’s hydration status is accomplished with serial measurements of urine output, serum sodium levels, and serum osmolality. Accurate measurement of I&O is required to calculate fluid replacement for the patient with SIADH. All fluids are restricted. Intake that equals urine output may be given until the serum sodium level returns to normal. Frequent mouth care (moistening of the buccal membrane) may give comfort during the period of fluid restriction. The patient is weighed daily to gauge fluid retention or loss. Weight gain signifies continual fluid retention, whereas weight loss indicates loss of body fluid.
Constipation is a frequent complication of decreased fluid intake. Cathartics or low-volume hypertonic enemas may be given to stimulate peristalsis. Tap water or hypotonic enemas should never be given, because the water in the enema solution may be absorbed through the bowel and potentiate water intoxication.
Maintaining Surveillance for Complications
The patient’s neurological status, especially level of consciousness, should be evaluated on an hourly basis if the serum sodium level is critically low (<125 mEq/L). Seizure precautions for the patient with SIADH are provided regardless of the degree of hyponatremia. Serum sodium levels may fluctuate rapidly, and neurological impairment may occur with no apparent warning. The patient’s altered neurological response also may be influenced by the acuteness of the primary disease (central nervous system disease) and not solely by the low sodium levels. Seizure precautions include nursing actions to protect the patient from injury (padded side rails, bed in low position when patient is unattended) and to provide an open airway (oral airway, head turned to the side without forcible restraint of the patient, suction apparatus). Oxygen may be required to maintain a saturation level greater than 92% if there is pulmonary congestion or edema that interferes with alveolar gas exchange.
Patient Education
Rapidly occurring changes in the patient’s neurological status may worry visiting family members. Sensitivity to the family’s unspoken fears can be shown by words that express empathy and by providing time for the patient and family to ask questions and express their concerns. The nurse may discuss the course of SIADH, its effect on water balance, and the reasons for fluid restrictions.
Collaborative Management
At this time, there are no published guidelines that discuss acute collaborative care management of the patient with SIADH. This is a complex condition, and effective clinical management requires the skills of many health care professionals working as a team, with goals that are clearly communicated to all team members.