Chapter 23 Echocardiography in intensive care
Echocardiography refers to a group of interrelated ultrasound applications used to examine the heart and great vessels. The reflected and processed sonic waves are displayed on a monitor and the images can be stored on videotape or disk. Echocardiography includes: (1) two-dimensional (2-D) anatomical imaging; (2) M-mode echocardiography, usually obtained with 2-D guidance; and (3) Doppler techniques. Echocardiography is a safe non-invasive technique which is integral to clinical cardiology. More recently, echocardiography has evolved into a powerful diagnostic and management tool in critically ill patients, especially in cardiovascular emergencies of uncertain cause.1,2
Cardiologists, although highly skilled in echocardiography, may not appreciate the complex pathophysiology of critically ill patients in intensive care, and they have time commitments elsewhere. Echocardiography is operator-dependent; optimal image acquisition requires both technical knowledge of the machine’s capabilities as well as a degree of manual dexterity. As a general rule, echocardiography is not an efficient technique for monitoring haemodynamic indices over the medium term (hours–days) in the intensive care unit (ICU). Echocardiography can help determine whether and when continuous haemodynamic monitoring should be commenced.3 Repetitive trend measurements, such as stroke volume, cardiac output and pulmonary artery wedge pressure, are more suited to the pulmonary artery catheter. Moreover, intensive care staff are skilled and experienced in its use. Echocardiography technicians are not present in ICU, especially out of hours; intensivists must be able to act as their own sonographers as well as interpreting and reporting on the echographic images obtained. It is important that intensivists acquire all requisite skills so that echocardiography becomes more widely available.
PRINCIPLES AND TECHNICAL CONSIDERATIONS4
2-D ECHOCARDIOGRAPHY
2-D echocardiography is the cornerstone of cardiac ultrasound as Doppler and M-mode are usually performed with reference to the 2-D image. Each 2-D image is defined by the position of the transducer (acoustic window) and image plane which is determined by the axis of the heart and not the spine (Table 23.1).
Table 23.1 Some standard views in transthoracic and transoesophageal echocardiography
| Acoustic window | Image plane |
|---|---|
| Transthoracic | |
| Parasternal | Long axis |
| Short axis | |
| Apical | Four-chamber |
| Two-chamber | |
| Long axis | |
| Subcostal | Multiple |
| Transoesophageal* | |
| Transgastric | e.g. Short axis |
| Long axis | |
| Deep transgastric | e.g. Long axis/five-chamber |
| Lower transoesophageal | e.g. Four-chamber |
| Two-chamber | |
| Long axis | |
| Upper transoesophageal | e.g. Short axis of aortic valve |
| Long axis of aortic valve | |
| Right ventricular inflow–outflow | |
M-MODE ECHOCARDIOGRAPHY
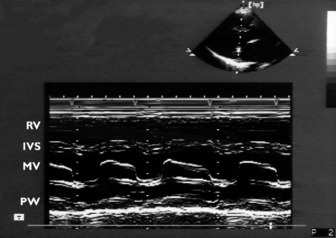
Rapidly repeated transmit and receive cycles allow production of images with good resolution. M-mode echocardiography complements 2-D echocardiography. The beam is not scanned but stays in a fixed position, allowing the display of structures along the beam as a function of time. The rapid sampling rate makes identification of thin moving structures, such as valve leaflets, relatively easy. The cursor is usually directed through a 2-D image, giving a one-dimensional slice or ‘icepick’ view. Distance (depth) is on the vertical and time is on the horizontal axis (Figure 23.1).
DOPPLER ECHOCARDIOGRAPHY4,5

where V = velocity of blood flow, C = speed of sound in soft tissue (1540 m/s), Δf = Doppler (frequency) shift:difference in frequency between received (fr) and transmitted (ft) ultrasound and θ = angle between ultrasound beam and direction of blood flow (Figure 23.2). Echocardiographic machines contain computers that automatically calculate the Doppler shift which is then entered into the Doppler equation. Blood flow velocity (m/s) is calculated and displayed on the monitor.
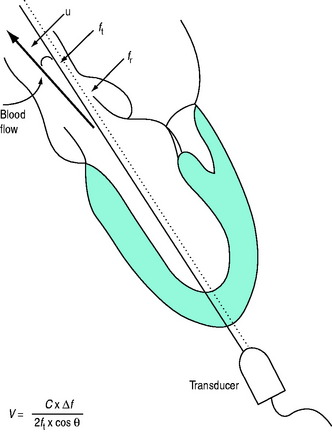
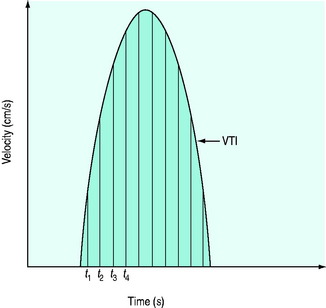
It is very important that the ultrasound beam is parallel or nearly parallel with the direction of blood flow. Ifθ equals 0 then cosign θ equals 1; however, if θ > 20° then the velocity of blood flow will be significantly underestimated. Doppler data are processed and a spectral display plots instantaneous blood velocities over time. Blood flow velocity can be expressed as peak velocity or mean velocity throughout a cardiac cycle (velocity–time integral: VTI) (Figure 23.3).
CONTINUOUS-WAVE DOPPLER
The transducer consists of two crystals: one continuously transmits and the other continuously receives ultrasound waves. It can measure high-velocity blood flow, such as occurs in aortic stenosis. Unlike PW Doppler, CWDoppler measures all the frequency shifts along the beam path and it is not possible to estimate the velocity at a specific site (range ambiguity).
Blood flow velocities measured by either PW or CW Doppler can be converted to pressure gradients using the simplified Bernoulli equation, ΔP = 4V2 (where ΔP is the instantaneous pressure gradient and V is the instantaneous velocity), to provide estimates of pressure.
THREE-DIMENSIONAL
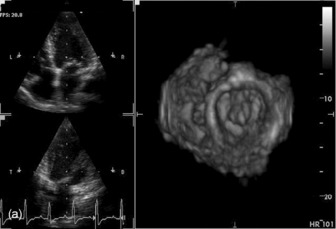
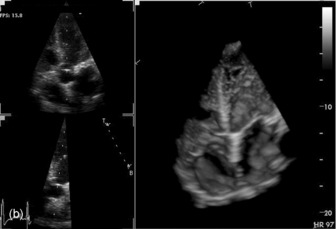
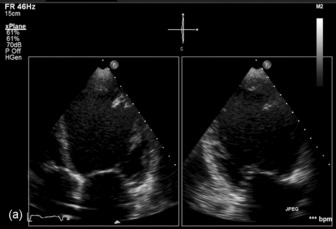
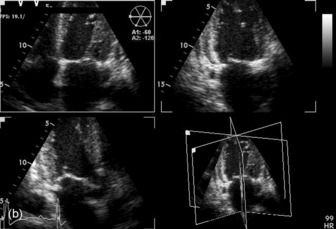
Three-dimensional (3-D) echocardiography is an evolving technique. Current equipment provides ‘real-time’ 3-D images (Figure 23.4a). The acquisition of a complete volume data set typically requires four sequential cardiac cycles. This 3-D data set must then be viewed and analysed. The full 3-D volume can then be ‘cropped’ so that the interior is exposed (Figure 23.4b). The 3-D volume set can be ‘opened’ in any imaging plane, providing both long- and short-axis views of cardiac structures. The 3-D volumetric probe can also be used for simultaneous acquisition of true real-time biplane (Figure 23.5a) and triplane (Figure 23.5b) images.
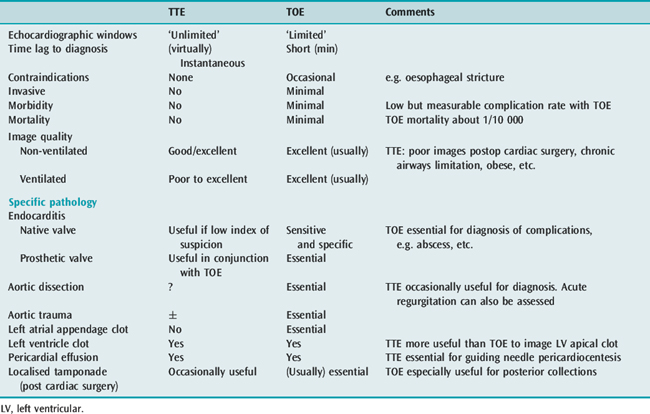
TRANSTHORACIC (TTE) AND TRANSOESOPHAGEAL ECHOCARDIOGRAPHY
TTE and TOE are complementary ultrasound techniques, each with its own strengths and weakness (Table 23.2). For example, a vegetation imaged on the mitral valve of a septic patient will usually require a TOE to evaluate complications of endocarditis.
Table 23.2 Transthoracic echocardiography (TTE) and transoesophageal echocardiography (TOE): advantages and disadvantages
TRANSOESOPHAGEAL ECHOCARDIOGRAPHY6,7
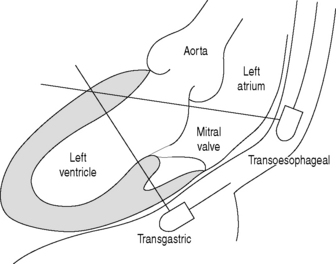
The transducer is mounted at the tip of a flexible gastroscope-like probe which can be manoeuvred to various positions in the oesophagus and stomach close to the heart (Figure 23.6).
The modern multiplane probes allow rotation of the ultrasound scanning plane from 0 to 180°, which provides a mirror-image orientation. Multiple tomographic imaging planes can be obtained without the necessity for further probe manipulation. Compared to TTE, TOE provides additional information in 32–100% of intensive care examinations and unexpected new diagnoses in 38–59%, leading to significant changes in treatment.8 Approximately 20% of patients with unexplained hypotension require surgery on the basis of new TOE findings.9,10
INDICATIONS FOR ECHOCARDIOGRAPHY11,12
The indications for echocardiography broadly fall into three categories:
Some common syndromes in which echocardiography is especially useful are listed in Table 23.3.
Table 23.3 Indications for echocardiography in the intensive care unit according to clinical syndrome
| Clinical syndrome | Findings | Comments |
|---|---|---|
| Hypotension | ||
| Acute myocardial infarct | ||
| No murmur | LV RWMA(s) | Usually severe ↓ LV systolic function |
| RV RWMA | RV ↓ > LV ↓ | |
| Hypovolaemia | ‘Empty’ LV cavity, systolic function largely preserved | |
| Acute MR | Often no murmur with normal LA size | |
| New murmur | Papillary muscle rupture (partial or complete) | ‘Good’ LV function with severe MR |
| VSD | RWMA. High-velocity left-to-right systolic jet | |
| Rarely | Cardiac rupture/tamponade | Acute pericardial tamponade, usually fatal |
| LV pseudoaneurysm | Containment of rupture | |
| Cardiothoracic surgery | Cardiac tamponade | Often localised. There may be no ‘echo-free space’ due to clot compressing the heart. Cardiac filling pressures may be normal |
| (New) RWMA | May be due to graft occlusion, air embolism | |
| Hypovolaemia | ‘Empty’ LV with RWMA | |
| Global LV ↓ | Stunning or long-standing cardiomyopathy | |
| Valvular dysfunction | Often long-standing but may be worsened by surgery, e.g. ischaemia to a papillary muscle of mitral valve | |
| Dynamic LVOT obstruction | LVOT pressure gradient, SAM, MR | Inotropes/IABP/hypovolaemia worsen LVOT obstruction |
| Trauma | Hypovolaemia | ‘Empty’ LV with vigorous contraction |
| Cardiac contusion | RWMA (RV > LV) | |
| Valvular injury | Most common aortic valve (AR) or mitral valve (MR), occasionally tricuspid valve (TR) | |
| VSD/ASD | Occasionally | |
| Cardiac tamponade | More common in penetrating chest injuries | |
| Ruptured thoracic aorta | Widened mediastinum (90%) at isthmus of aorta. TOE required | |
| Sepsis | Often normal LV systolic function with ‘empty’ LV | Possible global/regional LV depression |
| Infective endocarditis – vegetations/abscess/regurgitation | TOE more sensitive than TTE for imaging vegetations/abscess/fistula | |
| ‘Isolated’ hypotension (‘hypotension ?cause’) | Global LV ↓ or RWMA | Cardiomyopathy or stunning |
| Valvular dysfunction | Usually chronic, occasionally acute (e.g. ruptured papillary muscle of mitral valve) | |
| Dynamic LVOT obstruction | ||
| Acute cor pulmonale | Pulmonary embolism – usually dilated right heart with depressed systolic function, sometimes with clot in a proximal pulmonary artery | |
| Sepsis (source?) | Vegetations, regurgitation ± abscess | Infective endocarditis until proven otherwise |
| Normal TOE examination | Infective endocarditis unlikely. If clinically indicated serial TOE | |
| Systemic emboli (source?) | LA/LAA clot | Usually enlarged LA and atrial fibrillation TOE usually required for diagnosis |
| LV clot | Usually associated with RWMA or global LV depression. TTE for apical clot | |
| Aortic atherosclerotic | TOE essential for diagnosis plaques | |
| Vegetations – aortic or abscess | Septic? | |
| Clot – prosthetic aortic or mitral valve | Associated prosthetic valve dysfunction | |
| Patent foramen ovale with paradoxical embolism | RA pressure > LA pressure (e.g. IPPV with high PEEP). TOE (bubble contrast) usually necessary for diagnosis | |
| Tumour (e.g. LA myxoma) | Uncommon | |
| Pulmonary oedema (cause?) | ↓ LV systolic/diastolic function | Isolated LV diastolic dysfunction not uncommon |
| Valvular dysfunction (MR, MS, AR, AS) | If flail leaflet/ruptured papillary muscle suspected then TOE indicated | |
| Intracardiac shunt | ||
| Normal | Suggests non-cardiac cause (e.g. ARDS) | |
| Dyspnoea/hypoxia without pulmonary oedema (dyspnoea cause?) | Pulmonary embolism (dilated right heart chambers ± clot in pulmonary artery) | Infers moderate to large clot burden i.e. submassive/massive PE |
| Cardiac tamponade | Usually other clinical signs of tamponade present | |
| Miscellaneous e.g. chronic cor pulmonale, RVH, constrictive pericarditis, diastolic dysfunction, intracardiac shunt, RV volume overload | ||
| Chest pain of uncertain aetiology (chest pain cause?) | RWMA | Infers presence of coronary artery disease |
| Dissecting aortic aneurysm (intimal flap, true/false lumen) | TOE more sensitive than TTE | |
| PE (dilated right heart chambers ± clot in pulmonary artery) | Moderate to large embolus | |
| Pericarditis | Effusion often too small to diagnose with echocardiography | |
| Aortic stenosis | Clinical signs of stenosis may be absent | |
AR, aortic regurgitation; ARDS, acute respiratory distress syndrome; AS, aortic stenosis; ASD, atrial septal defect; IABP, intra-aortic balloon pump; IPPV, intermittent positive-pressure ventilation; LA, left atrium; LAA, left atrial appendage; LV, left ventricle; LVOT, left ventricular outflow tract; MR, mitral regurgitation; MS, mitral stenosis; PE, pulmonary embolism. PEEP, positive end-expiratory pressure; RA, right atrium; RV, right ventricle; RVH, right ventricular haemorrhage; RWMA, regional wall motion abnormality; SAM, systolic anterior motion; TOE, transoesophageal echocardiography; TR, tricuspid regurgitation; VSD, ventricular septal defect.
As a general rule, unless there is gross haemodynamic instability or some other overriding reason, the echocardiographic examination should be structured around a basic set of 2-D views. This applies to both TTE and TOE. The focus of the TOE examination should be on the most important specific clinical question. The second priority should be other potential pathology in the differential diagnosis. A printed report should be performed after each echocardiographic examination and should be stored and available for future reference.13
VALVULAR HEART DISEASE14,15
Echocardiography is the ‘gold standard’ for evaluating valvular heart disease. 2-D echocardiography provides excellent imaging of all cardiac valves. Various Doppler techniques allow accurate haemodynamic evaluation of the valves.
VALVULAR STENOSIS
Aortic stenosis
Assessment of severity
Visual assessment of aortic valve cusp thickness, calcification, mobility and degree of LV hypertrophy will often indicate the physiological significance of the aortic stenosis. Doppler echocardiographyis essential for assessment of severity: (1) peak aortic velocity; (2) mean transvalvular pressure gradient; (3) aortic valve area; and (4) ratio of LVOT velocity/aortic valve velocity (V1/V2).
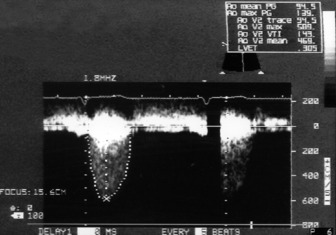
Accurate estimation of maximum aortic jet velocity is best obtained by TTE. However, TOE allows planimetry (tracing) of the aortic valve orifice in the short-axis view which correlates well with catheter-derived aortic valve area.16 TOE planimetry may be useful in critically ill patients when other data are inconsistent or inconclusive.
Mitral stenosis
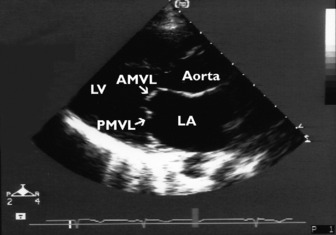
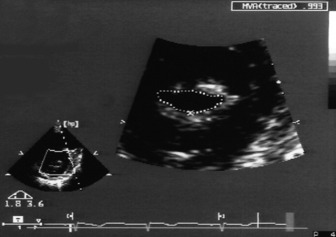
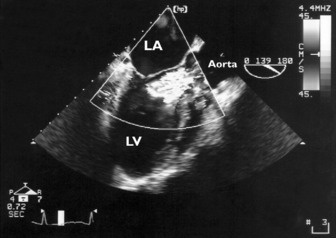
Significant mitral stenosis can occasionally contribute to haemodynamic instability in critically ill patients. Dyspnoea has usually been present for many years, so that mitral stenosis has been diagnosed prior to admission to intensive care. Mitral stenosis secondary to rheumatic heart disease produces typical M-mode (see Figure 23.1) and 2-D images of thickened and fused mitral valve leaflets with diastolic doming, resulting in a ‘hockeystick’ appearance of the anterior leaflet, together with an enlarged LA (Figure 23.8). In the short-axis view the mitral valve appears as a ‘fish mouth’ orifice, the area of which can be estimated (normal 4–6 cm2) (Figure 23.9) using planimetry.
Assessment of severity
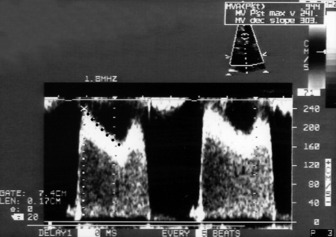
In addition to visualisation and planimetry of the valve, accurate assessment of mitral valve stenosis requires Doppler echocardiography: (1) peak velocity (E) across the mitral valve is increased (normal =1.3 m/s). In severe mitral stenosis, the E velocity is usually > 2 m/s; (2) transvalvular pressure gradient: the mean pressure gradient between the LA and LV is usually > 10 mmHg in severe stenosis; (3) pressure half-time (Pt ½) is the time it takes for the peak pressure gradient to halve. The rate of pressure decline across a stenotic orifice is determined by its cross-sectional area (i.e. the smaller the orifice, the slower the rate of decline). Pressure half-time > 220 ms indicates severe mitral stenosis (mitral valve area = 1 cm2)17 (Figure 23.10). Pulmonary artery pressure should also be estimated (see below).
VALVULAR REGURGITATION
Evaluation of valvular regurgitation requires: (1) assessment of the valve morphology; (2) estimation of severity of regurgitation; and (3) effects of volume overload on relevant cardiac chambers. Mild valvular regurgitation of the mitral, tricuspid and pulmonary valves is common (70–90%) and such findings have no clinical significance. Trivial aortic regurgitation is found in only about 5% of examinations.
Aortic regurgitation
Assessment of severity18
CFD imaging allows some grading of severity of regurgitation by comparing the width of the regurgitant jet to the LVOT area (Figure 23.11). If the jet occupies more than 60% of the LVOT area, then severe aortic regurgitation is probably present.
Assessment of severity18
Severity of mitral regurgitation is assessed by CFD imaging of the regurgitant jet. The severity of mitral regurgitation is directly proportional to the size of the regurgitant jet within the LA (Figure 23.12). Mitral valve colour flow jet reaching the posterior wall of the LA suggests severe mitral regurgitation, as does systolic flow reversal in the pulmonary veins. Colour flow mapping of the narrowest cross-sectional area of a regurgitant jet (vena contracta) can estimate the severity of the mitral regurgitation19 and this can be done in < 1 min.20 Combining 2-D imaging with spectral Doppler imaging can be used to quantify valvular regurgitation by measuring regurgitant volume (volume of blood that leaks through an incompetent valve) and regurgitant fraction (fraction or percentage of stroke volume that regurgitates).
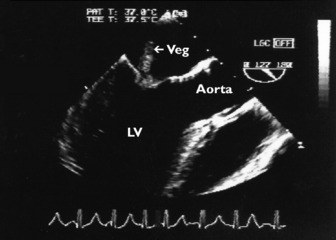
INFECTIVE ENDOCARDITIS
Infective endocarditis should be suspected in any critically ill patient with sepsis and no obvious source of infection. The echocardiographic hallmark of endocarditis is the presence of vegetation(s) which appear as an echogenic chaotically moving mass attached to a heart valve (Figure 23.13). The Duke criteria21–23 integrate clinical, microbiological and echocardiographic information in suspected infective endocarditis. Echocardiographic findings consistent with vegetation or new endocardial infection (abscess, prosthetic valve dehiscence, etc.) are major diagnostic criteria. In some situations, clot, tumour or marantic vegetation may mimic endocarditis. In a patient with endocarditis, echocardiography will: (1) image the vegetation and assess its size; (2) diagnose complications such as paravalvular abscess and fistula; (3) examine underlying valve morphology (e.g. bicuspid aortic valve); (4) diagnose and assess severity of associated valvular regurgitation; (5) assess cardiac function; and (6) image other heart valves. Large vegetations (> 10 mm) increase the risk of embolic events.24 Despite advances in imaging, TTE is still insensitive compared to TOE25 for detection of native valve vegetations and fails to demonstrate about 50% of them. TOE accuracy is much better, with a sensitivity and specificity of about 90%. In one study the negative predictive value was 86%.26 TTE may be adequate to exclude vegetations in patients when clinical suspicion for endocarditis is low27 provided that image quality is adequate.
About 25% of patients with Staphylococcus aureus septicaemia have infective endocarditis, even in the absence of obvious clinical signs.28 TOE is essential for the diagnosis and detection of associated complications.
VENTRICULAR FUNCTION AND HAEMODYNAMIC ASSESSMENT
LEFT VENTRICLE
2-D and M-mode echocardiography allow accurate measurements of LV dimensions and wall thickness.
Ejection fraction
where EDV = LV end-diastolic volume and ESV = LV end-systolic volume.
Real-time 3-D echocardiography is more accurate than 2-D techniques for the quantification of LV volumes.29
Regional left ventricular function30
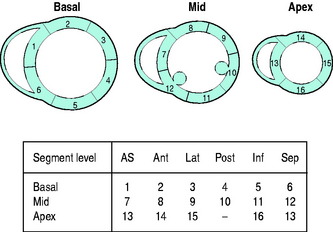
Assessment of LV regional wall motion analysis is based on grading the contractility of individual segments: 1 = normal or hyperkinesis; 2 = hypokinesis; 3 = akinesis; 4 = dyskinesis (paradoxical systolic motion); 5 = aneurysmal. The American Society of Echocardiography divides the LV into 16 segments (six at the base, six at the mid ventricular level and four at the apex) (Figure 23.15).
Real-time 3D echocardiographic imaging is more sensitive than 2-D techniques for the detection of regional LV wall motion abnormalities.29
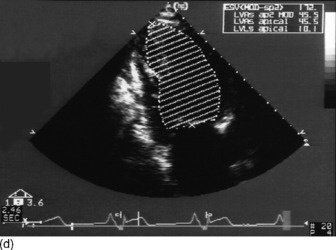
Stroke volume and cardiac output
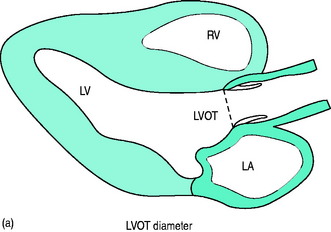
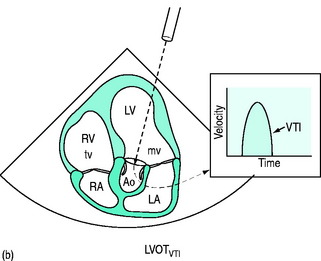
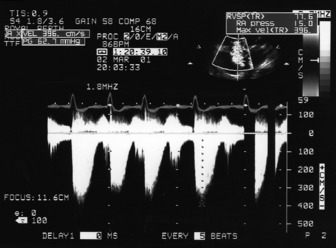
Doppler-derived blood flow velocities can be used to quantify cardiac output. The technique is based on the principle that the VTI of blood flow multiplied by the cross-sectional area (CSA) of its orifice yields an estimate of stroke volume (SV = CSA × VTI) (Figure 23.16a, b). The LVOT is the most commonly used site for stroke volume and cardiac output estimation. In general, correlations between echocardiographic and thermodilution-derived cardiac output have been reasonable, although neither method is a ‘gold standard’.
Real-time 3-D is more accurate than 2-D echocardiography for measurement of LV volumes. Studies comparing 3-D echocardiographic LV volumes with magnetic resonance imaging (MRI) confirm the accuracy of 3-D echocardiography.29
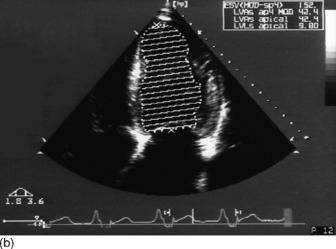
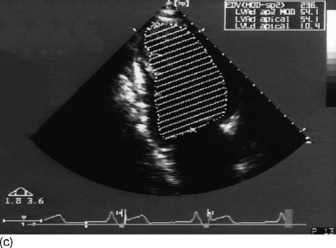
Preload (left ventricular end-diastolic volume)
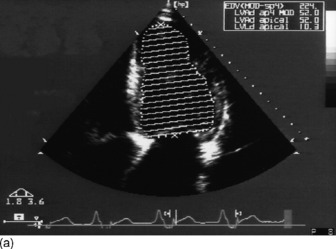
Modified Simpson’s rule technique is the most accurate echocardiographic method for measuring LVEDV/preload in clinical practice (Figure 23.14a, c).
Diastolic function31
The non-invasive assessment of LV diastolic dysfunction has seen major advances in recent years. Diastolic dysfunction is a disorder of LV filling, where the LV is unable to fill to a normal LVEDV without an abnormal increase in end-diastolic pressure. All patients with LV systolic dysfunction have some degree of LV diastolic dysfunction. Some patients with congestive cardiac failure have normal or near-normal LV systolic function with isolated diastolic heart failure. Gandhi et al.,32 using echocardiography, demonstrated that pulmonary oedema in patients with marked systemic hypertension is commonly due to isolated diastolic dysfunction. Mitral and pulmonary inflow patterns are Doppler techniques routinely used to diagnose diastolic dysfunction and assess severity.
E/E1 ratio
Early diastolic blood flow from LA to LV results in an E-wave. Doppler tissue imaging recordings from the lateral (or medial) mitral annulus during early diastole result in an E1. E1 is a good index of LV relaxation. The E/E1 ratio correlates well with LV filling pressures. An E/E1 ratio > 15 is associated with LA pressures > 15 mmHg, whereas an E/E1 < 8 is highly specific for normal LA pressure.31
RIGHT VENTRICLE (RV)
Evaluation of right-sided heart function is important in critically ill patients.
Wall thickness
RV hypertrophy (due to pressure overload) leads to increased thickness of the RV free wall.
Pulmonary artery pressure
This is an important and routine part of assessing RV function. Some tricuspid regurgitation is present in > 90% of the adult population. The simplified Bernoulli equation is used: RV systolic pressure is obtained by adding right atrial pressure (RAP) to the transtricuspid gradient derived from the peak tricuspid regurgitation velocity (Vtr) measured by Doppler (Figure 23.17). In the absence of pulmonary stenosis, systolic RV pressure = systolic PA pressure.
 ) (i.e. 4 × (3.9)2 = 62). Therefore RVSP = 15 + 62 = 77 mmHg. In the absence of pulmonary stenosis, RVSP = SPAP.
CARDIOMYOPATHIES
HYPERTROPHIC CARDIOMYOPATHY
RESTRICTIVE CARDIOMYOPATHY
Primary restrictive cardiomyopathy is characterised by impaired LV filling secondary to idiopathic myocardial stiffening. Echocardiographic findings usually include marked biatrial enlargement with normal LV cavity size and wall thickness and normal or slightly reduced systolic function. A characteristic restrictive mitral inflow pattern is present.
PERICARDIAL DISEASE
PERICARDIAL EFFUSION AND TAMPONADE
Echocardiography is the accepted gold standard for both the diagnosis of pericardial effusion and its haemodynamic significance. Pericardial fluid or blood can be recognised on 2-D as an ‘echo-free’ space around the heart (Figure 23.18). Whenever a pericardial effusion is imaged, the possibility of tamponade should be considered. When the effusion within the pericardial sac is large enough, intrapericardial pressure exceeds RV diastolic pressure and cardiac tamponade occurs, causing impaired cardiac filling and low cardiac output. 2-D echocardiographic features of cardiac tamponade may include:
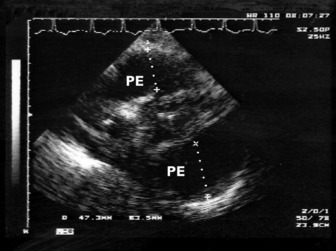
Figure 23.18 Massive (5 cm) pericardial effusion (PE) in a patient with tamponade (transthoracic echocardiography subcostal).
Echocardiography may also be used to guide pericardiocentesis by locating the optimal site for puncture and monitoring the residual effusion after drainage.36 As 2-D echocardiography is a tomographic imaging technique, the needle tip is often difficult to visualise.
CARDIAC TAMPONADE OCCURRING AFTER CARDIAC SURGERY
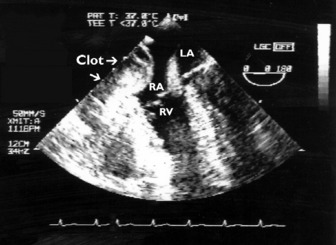
The tamponade may be localised with differential compression of the right- or left-sided chambers and the clot is usually ‘echo-dense’ with little or no ‘echo-free’ space around the heart (Figure 23.19). Localised tamponade (e.g. of the RA or LA) is not uncommon in such patients. Not surprisingly, standard echocardiographic criteria, such as intermittent chamber collapse, are unreliable in detecting tamponade after cardiac surgery. The presence of 1 cm of pericardial separation (fluid/clot) in a patient with unexplained clinical deterioration (hypotension, decreased cardiac output) appears to be sensitive indetecting tamponade.37 In the absence of tamponade, other causes of hypotension, such as unsuspected hypovolaemia, ventricular dysfunction or LVOT obstruction, may be diagnosed by echocardiography. Indeed, unnecessary reoperation may be prevented in some instances.
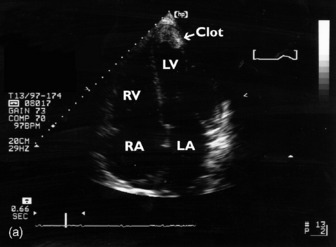
INTRACARDIAC THROMBUS
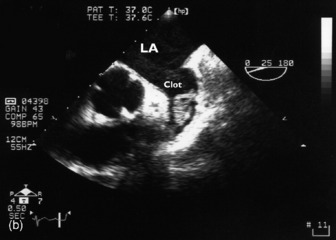
Thrombi can occur in any cardiac chamber but are most common in the LV (often at the apex) and the LA (usually in the LA appendage). Low-flow states manifest as spontaneous echocardiographic contrast or echocardiographic ‘smoke’ and are precursors of clot formation and thromboemboli. LV clot (Figure 23.20), when it occurs after myocardial infarction, is associated with the regional wall motion abnormality. Clot may also occur in patients with dilated cardiomyopathy and severe global depression of LV systolic function. TTE is more sensitive than TOE for detection of LV apical clot. LA clot is much more common than RA clot and usually occurs in the setting of atrial fibrillation or mitral stenosis. TOE provides vastly superior images compared to TTE as LA clot is usually located in or near the LA appendage, which is poorly visualised with TTE. Conventional managementfor patients with AF = 48 h requires therapeutic anticoagulation for 3 weeks before planned cardioversion. Another approach necessitates LA clot exclusion by TOE. If there is no LA clot, then cardioversion may proceed immediately, otherwise cardioversion is delayed. This TOE-based strategy has been shown to be associated with low embolic rates and a shorter time to cardioversion compared to conventional strategy, but no difference in outcome.38
AORTIC DISEASE
AORTIC DISSECTION39
TOE is very useful for diagnosing aortic dissection. The sensitivity and specificity of TOE in diagnosis of aortic dissection are equivalent to that of computed tomography (CT) or MRI.40 2-D echocardiography will reveal the intimal flap (Figure 23.21) which is the hallmark of aortic dissection. CFD is useful in differentiating true from false lumen: (1) the false lumen is usually larger with slower flow; (2) the intimal flap pulsates in systole towards the false lumen because of the higher pressure in the true lumen. The entry point of the tear and the presence and extent of aortic regurgitation can also be evaluated.
INTRAMURAL HAEMATOMA (IMH)41
IMH represents a variant of aortic dissection with virtually identical clinical presentation. Indeed, it may be an early finding in patients who develop classical aortic dissection or rupture. IMH cannot be diagnosed by angiography as there is no intimal flap. 2-D echocardiography identifies IMH as a (> 0.7 cm) circular or crescentric thickening of the aortic wall or an echolucent zone in the aortic wall. There may be a thrombus-like echo pattern of the aortic wall.
TRAUMATIC AORTIC RUPTURE
TOE is both sensitive and specific for the diagnosis of aortic trauma.42 The echocardiographic signs of aortic injury may include an intimal flap, aortic wall haematoma, aortic occlusion and fusiform aneurysm. Echocardiographic assessment for aortic injury requires an experienced operator.
PULMONARY EMBOLISM
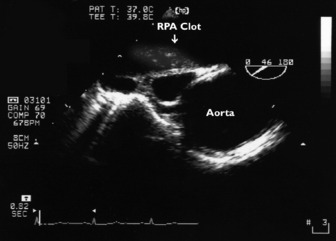
CT pulmonary angiogram is probably the preferred method for diagnosing pulmonary embolism. Nevertheless, echocardiography is useful to exclude massive or submassive pulmonary embolism in patients with unexplained hypotension. Pulmonary embolism causes acute obstruction of the pulmonary vasculature and haemodynamic compromise. Massive or submassive pulmonary embolism invariably causes acute cor pulmonale. The RV is acutely overloaded, causing distension and ‘rounding’ of the RV (RV to LV ratio > 0.6 in four-chamber view).43 The RV hypokinesis is characteristic with sparing of the apex (McConnell’s sign).44 The interventricular septum bulges into the LV cavity, resulting in LV diastolic dysfunction. The LV cavity is usually small and appears ‘undervolumed’. Significant RV hypertrophy is absent. Pulmonary hypertension is moderate and its severity can be estimated from the tricuspid regurgitant jet. Clot can also on occasions be directly imaged with TOE in the right heart cavity or proximal pulmonary arteries (Figure 23.22).
CONGENITAL HEART DISEASE
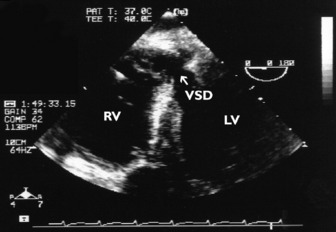
Echocardiography is essential for the evaluation of patients with known or suspected congenital heart disease. However, it is unusual for adult patients to present to intensive care with undiagnosed haemodynamically significant congenital heart disease. The transoesophageal approach is often necessary in critically ill adult patients with suspected congenital heart disease. Congenital heart abnormalities, such as patent foramen ovale, atrial septal defect, ventricular septal defect, patent ductus arteriosis and coarctation of the aorta, can be diagnosed.
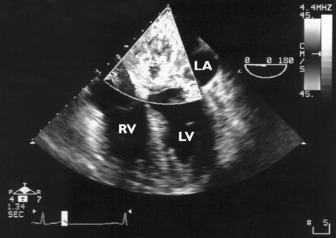
Non-congenital ventricular septal defect (e.g. complicating acute myocardial infarction or trauma) is easily diagnosed using either TTE or TOE (Figure 23.23).
1 Heidenreich PA. Transesophageal echocardiography (TEE) in the critical care patient. Cardiol Clin. 2000;18:789-805.
2 Colreavy F, Donovan KD, Lee KY, et al. Transoesophageal echocardiography in critically ill patients. Crit Care Med. 2002;30:989-996.
3 Hilton AK. Echocardiography is the best cardiovascular “monitor” in septic shock. Crit Care Resusc. 2006;8:247-251.
4 Otto CM. Principles of echocardiographic image acquisition and Doppler analysis. In: Otto CM, editor. Textbook of Clinical Echocardiography. Philadelphia: WB Saunders; 2000:1-29.
5 Quinones MA, Otto CM, Stoddard M, et al. Recommendations for quantification of Doppler echocardiography. A report from the Doppler Quantification Task Force of the Nomenclature and Standards Committee of the American Society of Echocardiography. J Am Soc Echocardiogr. 2002;15:167-184.
6 Shanewise JS, Cheung AT, Aronson S, et al. ASE/SCA guidelines for performing a comprehensive intraoperative multiplane transesophageal echocardiography examination: recommendations of the American Society of Echocardiography Council for Intraoperative Echocardiography and the Society of Cardiovascular Anesthesiologists Task Force for Certification in Perioperative Transesophageal Echocardiography. J Am Soc Echo-cardiogr. 1999;12:884-900.
7 Flachskampf FA, Decoodt P, Fraser AG, et al. Guidelines from the working group: recommendations for performing transoesophageal echocardiography. Eur J Echocardiogr. 2001;2:8-21.
8 Weiss Y, Pollak A, Gilon D. The application of transesophageal echocardiography in critical care medicine. Curr Opin Crit Care. 1997;3:232-237.
9 Heidenreich PA, Stainback RF, Redberg RF, et al. Transesophageal echocardiography predicts mortality in critically ill patients with unexplained hypotension. J Am Coll Cardiol. 1995;26:152-158.
10 Oh JK, Seward JB, Khandheria BK, et al. Transesophageal echocardiography in critically ill patients. Am J Cardiol. 1990;66:1492-1495.
11 Cheitlin MD, Alpert JS, Armstrong WF, et al. ACC/AHA guidelines for the clinical application of echocardiography. Circulation. 1997;95:1686-1744.
12 Cheitlin MD, Armstrong WF, Aurigemma GP, et al. ACC/AHA/ASE 2003 guideline update for the clinical application of echocardiography: summary article. A report of the American College of Cardiology/American Heart Association Task Force on Practice Guidelines (ACC/AHA/ASE Committee to Update the 1997 Guidelines on the Clinical Application of Echocardiography). J Am Coll Cardiol. 2003;42:954-970.
13 Gardin JM, Adams DB, Douglas PS, et al. Recommendations for a standardized report for adult transthoracic echocardiography. A report from the American Society of Echocardiography’s Nomenclature and Standards Committee and Task Force for a Standardized Echocardiography report. J Am Soc Echocardiogr. 2002;15:275-290.
14 Bonow RO, Carabello B, de Leon AC, et al. ACC/AHA practice guidelines: guidelines for the management of patients with valvular heart disease. Circulation. 1998;98:1949-1984.
15 Oh JK, Seward JB, Tajik AJ. Valvular heart disease. In: Oh JK, Seward JB, Tajik AJ, editors. The Echo Manual. Philadelphia: Lippincott Williams & Wilkins; 1999:103-132.
16 Shively BK. Transesophageal echocardiographic (TEE) evaluation of the aortic valve, left ventricular outflow tract, and pulmonic valve. Cardiol Clin. 2000;18:711-729.
17 Hatle L, Angelsen B, Tromsdal A. Noninvasive assessment of atrioventricular pressure half-time by Doppler ultrasound. Circulation. 1979;60:1096-1104.
18 Zoghbi WA, Enriquez-Sarano M, Foster E, et al. Recommendations for evaluation of the severity of native valvular regurgitation with two-dimensionaland Doppler echocardiography. A report from the American Society of Echocardiography’s Nomenclature and Standards Committee and the Task Force on Valvular Regurgitation, developed in conjunction with The American College of Cardiology Echocardiography Committee, The Cardiac Imaging Committee Council on Clinical Cardiology, The American Heart Association, and The European Society of Cardiology Working Group on Echocardiography. J Am Soc Echocardiogr. 2003;16:777-802.
19 Hall SA, Brickner E, Willett DL, et al. Assessment of mitral regurgitation severity by Doppler color flow mapping of the vena contracta. Circulation. 1997;95:636-642.
20 Thomas JD. How leaky is that mitral valve? Simplified Doppler methods to measure regurgitant orifice area. Circulation. 1997;95:548-550.
21 Durack DT, Lukes AS, Bright DK. New criteria for diagnosis of infective endocarditis: utilization of specific echocardiographic findings. Duke Endocarditis Service. Am J Med. 1994;96:200-209.
22 Bayer AS, Ward JI, Ginzton LE, et al. Evaluation of new clinical criteria for the diagnosis of infective endocarditis. Am J Med. 1994;96:211-219.
23 Li JS, Sexton DJ, Mick N, et al. Proposed modifications to the Duke criteria for the diagnosis of infective endocarditis: utilisation of specific echocardiographic findings. Duke Endocarditis Service. Clin Infect Dis. 2000;30:633-638.
24 Tischler MD, Vaitkus PT. The ability of vegetation size on echocardiography to predict clinical complications: a meta-analysis. J Am Soc Echocardiogr. 1997;10:562-568.
25 Reynolds HR, Jagen MA, Tunick PA, et al. Sensitivity of transthoracic versus transesophageal echocardiography for the detection of native valve vegetations in the modern era. J Am Soc Echocardiogr. 2003;16:67-70.
26 Sochowski RA, Chan KL. Implication of negative results on a monoplane transesophageal echocardiograhpic study in patients with suspected infective endocarditis. J Am Coll Cardiol. 1993;21:216-221.
27 Lindner JR, Case A, Dent JM, et al. Diagnostic value of echocardiography in suspected endocarditis. An evaluation based on pretest probability of disease. Circulation. 1996;93:730-736.
28 Fowler VG, Li J, Corey R, et al. Role of echocardiography in evaluation of patients with Staphylococcus aureus bacteremia: experience in 103 patients. J Am Coll Cardiol. 1997;30:1072-1078.
29 Corsi C, Lang RM, Veronesi F, et al. Volumetric quantification of global and regional left ventricular function from real-time three-dimensional echocardiographic images. Circulation. 2005;112:1161-1170.
30 Cerqueira MD, Weissman NJ, Dilsizian V, et al. Standardized myocardial segmentation and nomenclature for tomographic imaging of the heart. A statement for healthcare professionals from the Cardiac Imaging Committee of the Council on Clinical Cardiology of the American Heart Association. American Heart Association Writing Group on Myocardial Segmentation and Registration for Cardiac Imaging. Circulation. 2002;105:539-542.
31 Khouri SJ, Maly GT, Suh DD, et al. A practical approach to the echocardiographic evaluation of diastolic function. J Am Soc Echocardiogr. 2004;17:290-297.
32 Gandhi SK, Powers JC, Nomeir A-M, et al. The pathogenesis of acute pulmonary edema associated with hypertension. N Engl J Med. 2001;344:17-22.
33 Goldstein JA. Right heart ischemia: pathophysiology, natural history, and clinical management. Progr Cardiovasc Dis. 1998;40:324-341.
34 Weiss RL, Brier JA, O’Connor W, et al. The usefulness of transesophageal echocardiography in diagnosing cardiac contusions. Chest. 1996;109:73-77.
35 Madu EC, Brown R, Geraci SA. Dynamic left ventricular outflow tract obstruction in critically ill patients: role of transesophageal echocardiography in therapeutic decision making. Cardiology. 1997;88:292-295.
36 Tsang TS, Barnes ME, Hayes SN, et al. Clinical and echocardiographic characteristics of significant pericardial effusions following cardiothoracic surgery and outcomes of echo-guided pericardiocentesis for management. Mayo Clinic experience 1979–1998. Chest. 1999;116:322-331.
37 Bommer WJ, Follette D, Pollock M, et al. Tamponade in patients undergoing cardiac surgery: a clinical echocardiographic diagnosis. Am Heart J. 1995;130:1216-1223.
38 Klein AL, Grimm RA, Murray RD. Use of transesophageal echocardiography to guide cardioversion in patients with atrial fibrillation. N Engl J Med. 2001;344:1411-1420.
39 Flachskampf FA, Daniel WG. Aortic dissection. Cardiol Clin. 2000;18:807-817.
40 Armstrong WF, Back DS, Carey LM, et al. Clinical and echocardiographic findings in patients with suspected acute aortic dissection. Am Heart J. 1998;136:1051-1060.
41 Mohr-Kahaly S, Erbel R, Kearney P, et al. Aortic intramural hemorrhage visualized by transesophageal echocardiography: findings and prognostic implications. J Am Coll Cardiol. 1994;23:658-664.
42 Smith MD, Cassidy JM, Souther S, et al. Transesophageal echocardiography in the diagnosis of traumatic rupture of the aorta. N Engl J Med. 1995;332:356-362.
43 Jardin F, Dubourg O, Bourdarias J-P. Echocardiographic pattern of acute cor pulmonale. Chest. 1997;111:209-217.
44 McConnell MV, Solomon SD, Rayan ME, et al. Regional right ventricular dysfunction detected by echocardiography in acute pulmonary embolism. Am J Cardiol. 1996;78:469-473.