[level-membership-for-critical-care-medicine-category]28
Echocardiography: Beyond the basics
(CONSULTANT-LEVEL EXAMINATION)
Overview
Echocardiography is one of the most powerful diagnostic and monitoring tools available to the modern intensivist. Although its potential was first recognized more than 20 years ago,1 only recently has it become a mainstream imaging application in the intensive care unit (ICU). However, the widespread application of advanced echocardiographic techniques in the ICU remains disappointingly limited to isolated experts across the world, and the huge potential for collaborative research between cardiologists and intensivists in this field remains largely unrecognized. The reasons for this are largely historical; cardiology and intensive care have developed in parallel, with little overlap between the two specialties. With the paradigm shift in cardiologic interventions (percutaneous coronary, valve, and electrophysiologic procedures), there has been an understandable change in focus away from the more traditional specialties based upon cardiac physiology toward the newer interventional subspecialties. The development of complex and sophisticated imaging techniques (cardiac magnetic resonance and computed tomography) has presented further competition to echocardiography as a subspecialty within cardiology. Controversies regarding practice, training, accreditation, and “ownership” have until recently increased the potential conflict between cardiologists and intensivists regarding the use of echocardiography in the ICU (Table 28-1). Nonetheless, increasing availability of ultrasound machines, together with concerns regarding the safety of the pulmonary artery catheter, have resulted in intensivists adopting echocardiography as part of their repertoire of diagnostic and monitoring techniques. This chapter illustrates some neglected physiologic echocardiographic techniques as well as some of the potential areas where newer techniques might prove to be of use in the ICU.
TABLE 28-1
Basic and Advanced Echocardiographic Techniques in the ICU
| Technique | Routine ICU Use Recommended? | Comments |
| Focused basic echocardiography | Yes | Easy, binary decision-making to exclude/diagnose treatable causes of periarrest and arrest states |
| Ejection fraction | No | Normal values unknown in ICU Too many dynamic variables Does not measure contractility |
| Long-axis function | Yes | Easy to acquire (even with suboptimal views) Reproducible Sensitive to ischemia |
| Physiologic Doppler | Yes | Assessment of standard echodynamics Evaluation of t-IVT |
| Strain/strain rate | No | Research tool Not validated in critically ill adults Image resolution an issue |
| 3D/4D | Yes: for specific indications | Delineation of paraprosthetic regurgitation Assessment of mechanism of MR (percutaneous repair) Right ventricular function/dyssynchrony (research) |
Left ventricular (LV) function
The mechanism of LV function in systole and diastole is complex, with differing orientation of fibers at different muscle layers, and comprises minor and long-axis contraction, rotational contraction, as well as differential basal and apical rotational vectors. Of the older techniques, assessment of LV contractility generally either depends upon linear measures of changes in LV internal dimensions (fractional shortening) or differences between systolic and diastolic areas/volumes in the minor axis (ejection fraction), rather than thickening of the myocardium per se. Normal values of fractional shortening and ejection fraction are not known for the critically ill and remain highly variable depending upon ICU interventions in addition to the inherent contractility of the myocardium. The true value of other, less widely used techniques (long-axis function and total isovolumic time) has not yet been realized in the ICU setting, and that of emerging techniques (strain and strain rate) remains to be evaluated.
Long-axis function
The subendocardial fibers of the left ventricle run longitudinally, resulting in the characteristic movement of the mitral annulus toward the apex of the heart in systole, followed by retraction in diastole. Regional myocardial ischemia (induced by positive inotropic agents) may result in changes in regional wall motion scores associated with a fall in cardiac output at peak stress.2 Regional dyssynchrony may also develop, demonstrated by the appearance/worsening of postejection shortening, prolongation of the total isovolumic time (t-IVT), and associated broadening of the QRS duration. This response is in contrast to the normal shortening of the QRS duration and t-IVT in response to inotropic agents. Thus there is potential to diagnose subclinical myocardial ischemia/type I/II myocardial infarction by using this simple technique (Figure 28-1). Further, because t-IVT is a major determinant of maximal cardiac output during pharmacologic stress, it may be possible to titrate, on an individual patient basis, the response to positive inotropic agents, to minimize electromechanical dyssynchrony and avoid limiting cardiac output (Figure 28-2).
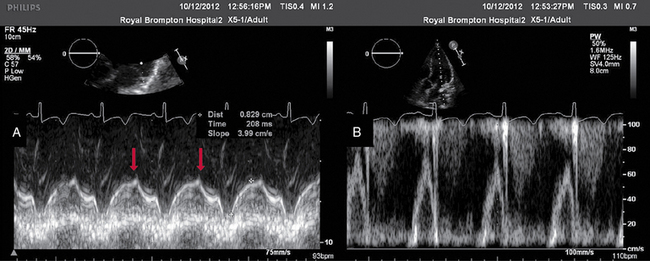
Figure 28-1 TTE in a young patient with type II myocardial infarction. A, MAPSE of the lateral wall, with postejection shortening (red arrow). B, PW Doppler of the mitral valve showing abnormal filling with summation (resulting from tachycardia) and a dominant A wave. MAPSE, Mitral annular plane systolic excursion; PW, pulsed wave; TTE, transthoracic echocardiogram.
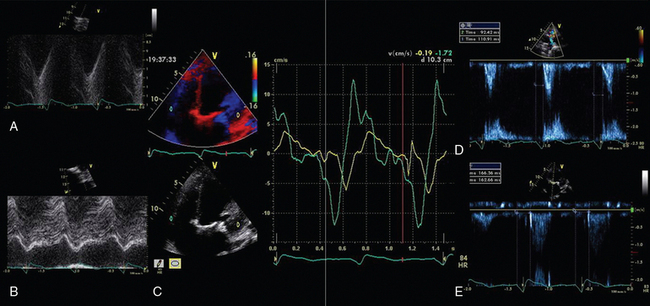
Figure 28-2 Interventricular dyssynchrony demonstrated by M-mode, TDI, and PW Doppler; A and B, M-mode traces of the right (TAPSE) and left (MAPSE) ventricle, depicting prolonged and late movement of the LV when compared with the RV free wall, as well as reduced excursion. C, PW TDI of the right (green) and left (yellow) ventricle taken from the illustrated regions (miniature images to the left; namely the LV and the RV free wall, respectively). LV TDI velocities are reduced and delayed. D, PW Doppler taken from the pulmonary valve showing a preejection period of 98 msec. E, PW Doppler from the aortic valve, showing a preejection period of 164 msec. Thus echo demonstrates a significant delay in LV contraction compared with the RV, resulting in a delay in ejection. LV, Left ventricle; MAPSE, mitral annular plane systolic excursion; PW, pulsed wave; RV, right ventricle; TAPSE, tricuspid annular plane systolic excursion; TDI, tissue Doppler imaging.
Total isovolumic time (t-IVT)
Factors increasing this measure of global LV electromechanical dyssynchrony include ischemia, conduction system disturbances, and loading conditions. Although there is not extensive literature regarding resynchronization therapy (atrioventricular [AV] and/or ventriculoventricular [VV]) in the ICU, the effects of dyssynchrony are well-recognized (including reduced LV contractility [dP/dT], pulse pressure, ejection fraction and cardiac output, diastolic filling time, and increased duration of mitral regurgitation and t-IVT). Even simple manipulations of heart rate and AV delay can result in significant improvement in cardiac filling (Figure 28-3). Global LV electromechanical dyssynchrony measured by t-IVT is common (22% patients in cardiothoracic ICUs) and is associated with increased mortality (7.5% vs. 25%, P =.2, Tavazzi et al, unpublished data). Emerging case series suggest that resynchronization therapy may be of use in selected critical care patients; however, case selection remains essential.3

Figure 28-3 Transmitral PW Doppler in a patient showing the effect of pacing optimisation. A, Native conduction (note the broad QRS duration on the ECG) and single E wave filling. B, DDD pacing with short AV delay, with presence of E and A waves on transmitral Doppler. AV, Atrioventriculr delay; DDD, dual chamber; ECG, electrocardiogram; PW, pulsed-wave.
Strain and strain rate imaging
These techniques have been suggested to improve the ability to detect ischemia and ventricular dysfunction not demonstrable by other more “conventional” echocardiographic techniques. Strain/strain rate are measures of myocardial deformation and describe both the nature and function of cardiac tissue. These techniques differ significantly from traditional methods of LV function assessment, which measure changes in internal LV dimension. Strain/strain rate (Figure 28-4) can be measured using Doppler or two-dimensional (speckle tracking) echocardiography.4
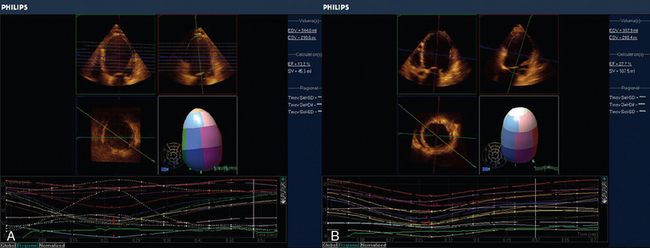
Figure 28-4 3D regional strain in patient with ischemic cardiomyopathy. A, Regional tracking shows severe intraventricular dyssynchrony (SV 41.3, EF 13.2%). B, After resynchronization therapy the same patient has more synchronous contraction. Note, also that the ejection fraction has concomitantly significantly increased (SV 127.5, EF 27.7%). 3D, Three-dimensional; EF, ejection fraction; SV, stroke volume.
Strain rate is measured by obtaining a series of velocity curves (from tissue Doppler imaging [TDI] comprising isovolumic contraction, systolic, diastolic, and atrial components) to demonstrate a velocity gradient along a length of ventricular wall. A regression calculation between adjacent tissue velocity data points along this length is used to generate strain rate, which is integrated to calculate strain. Thus strain rate (SR) reflects dP/dT of adjacent areas of the myocardium (SR = (V1 − V2)/L; where V = velocity and L = length), and is thought to be less load-dependent than strain. Strain (ε) is a unitless measure of lengthening and shortening only (defined as the change in distance between two points divided by the initial distance between those two points, ε = [L1 − L0)/L0]), assumes noncompressibility of tissues and can be calculated for three axes of myocardial motion, resulting in longitudinal, circumferential, and radial strain.4 The techniques have been well-validated with cardiac magnetic resonance scanning and animal models by using sonomicrometry. Because data are derived from TDI, certain caveats regarding their use exist; in particular sensitivity to signal noise and alignment. Speckle tracking uses two-dimensional echocardiography to identify areas of correlation within signature blocks of backscattered echocardiographic tissue, and tracks tissue motion accordingly, allowing simultaneous longitudinal, radial, circumferential, and also torsion analysis. It avoids the angle dependency of Doppler and allows interrogation of multiple movement vectors simultaneously (see Figure 28-4).
Currently, strain rate imaging is regarded as a tool for understanding myocardial mechanics. It is highly sensitive in detecting changes in wall motion, and current clinical applications include potential identification of myocardial viability and detection of subclinical ventricular dysfunction.5 In the ICU, emerging studies (in pediatric patients) have suggested the potential use of speckle tracking to detect ventricular dysfunction in septic shock, which is not appreciated by conventional echocardiography. In these studies, despite no demonstrable difference in fractional shortening and ejection fraction between controls and children with sepsis, significant abnormalities in circumferential and longitudinal strain, strain rate, radial displacement and rotational velocity and displacement have been demonstrated.6 Barriers to the widespread uptake of these tools exist, including requirement for in-depth understanding of the complex methodology underpinning their validity, technical challenges (image acquisition and analysis), and a continued lack of consensus regarding the superiority of any one of the array of potential measurements. These techniques should currently be regarded only as potential research tools in assessment of ventricular function in the critically ill, and, as with any highly derived imaging technique, attention must be paid to the actual versus potential temporal resolution of the technique. Moreover, the primary image quality remains a challenge in ICU patients. If what is emerging in the pediatric population is transferable to the adult ICU population, the potential for these techniques in elucidation myocardial dysfunction in critical care is promising.
Right ventricular (RV) function
The right ventricle is exquisitely sensitive to increases in afterload and reduction in coronary perfusion, and failure may ensue because of either of these factors (or a combination of the two). Both factors can be readily detected using echocardiography (see Chapter 33). In the ICU, RV dysfunction is most commonly secondary to increased afterload resulting from pulmonary disease and/or to left ventricular dysfunction, where again echocardiography is pivotal for diagnosis (see Chapters 28 and 33). A range of conventional echocardiographic techniques are routinely used to assess RV systolic function, including tricuspid annular plane systolic excursion (TAPSE), TDI (see Chapter 33), and the RV myocardial performance index (see Figure 28-2); however, measurements of RV geometry and volumes are complex.7 Three-dimensional (3D) echocardiography has great potential to change the way that RV volume is assessed in the ICU. On the other hand, when using echocardiography much can be learned from a more physiologic approach to the right ventricle by using simple techniques (e.g., right ventricular fractional area change). These may guide therapeutic interventions to improve RV performance in the ICU.
Duration of tricuspid regurgitation
All echocardiographers routinely interrogate the tricuspid regurgitation signal to estimate the severity of pulmonary hypertension, which is calculated by the simplified Bernoulli equation (see Chapter 33). What is less common is to focus on the duration of tricuspid regurgitation. When the regurgitation is prolonged (either because of prolonged systole related to pulmonary hypertension or to conduction system disorder) it may temporally affect cardiac filling (on both the right and occasionally the left side of the heart), thereby limiting cardiac output (Figure 28-5). As with mitral regurgitation of prolonged duration, the cause should be sought, and, if possible, corrected.8 In addition, echocardiographic heart rate optimization should be performed to maximize the time available for diastole, although this must be balanced against the often concomitant requirement for an adequate heart rate in the presence of a fixed stroke volume.
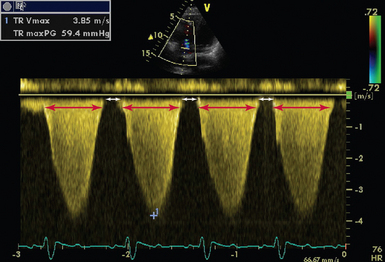
Figure 28-5 CW Doppler in a patient with severe pulmonary hypertension (RAP = 15, PASP = 75 mm Hg). The duration of TR is 596 msec (delineated by red arrows), with a RR interval of 789 msec. This allows only 193 msec for ventricular filling (delineated by white arrows). CW, Continuous wave; PASP, pulmonary artery systolic pressure; RAP, right atrial pressure; TR, tricuspid regurgitation; TRVmax, tricuspid regurgitation maximal velocity; TRmaxPG, tricuspid regurgitation maximum pressure gradient.
Rv restriction
Although the concept of LV restriction is well-recognized that of RV restriction is less so, except within the pediatric cardiology arena. The diagnosis is made using pulsed wave Doppler of the pulmonary valve, demonstrating forward flow in late diastole and the pulmonary valve opening during atrial systole. This occurs when the RV end diastolic pressure exceeds that of the pulmonary arterial diastolic pressure, with the proposed mechanism being that the stiff right ventricle is unfillable (Figure 28-6).9 Positive-pressure ventilation results in an increase in tricuspid E/A ratio and may abolish the pulmonary arterial diastolic wave, making the diagnosis more challenging. Adult ICU literature is scarce; however, the above-mentioned echocardiographic features may be seen in 43% to 50% of patients (Tavazzi, unpublished data).10 Confounding factors include the presence of LV restriction, elevation of pulmonary arterial diastolic pressures, tachycardia, and requirement for high ventilator pressures. However, the importance of the diagnosis is evident when considering the impact of inspiration on this forward flow. The relative contribution of the restrictive antegrade A wave to pulmonary flow (and hence right-sided output) changes as a result of positive-pressure ventilation (inspiration 7 ± 8% vs. expiration 22 ± 10%), suggests that, when diagnosed, mechanical ventilation should be modified to minimize this adverse effect when possible.11
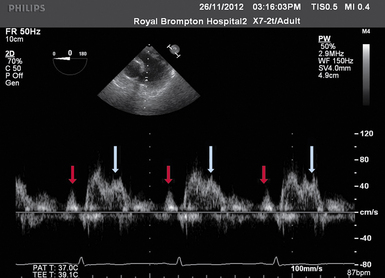
Figure 28-6 TEE image of PW Doppler across the pulmonary valve. Presystolic a wave (red arrow) indicating a restrictive RV filling pattern. The first systolic peak occurs shortly after valve opening (in this case, 65 msec) and this, together with second peak of systolic wave (white arrow), is suggestive of pulmonary hypertension and/or a high pulmonary vascular resistance. PW, Pulsed-wave; RV, right ventricle; TEE, transesophageal echocardiography.
Three-dimensional (3D) and four-dimensional (4D) imaging
Despite the major advances in cardiac imaging (e.g., magnetic resonance), recent technologic advances in echocardiography have transformed image quality, allowing the development of 3D and four-dimensional (4D) (real-time 3D) imaging via transthoracic and, more recently, transesophageal echocardiography. In the ICU, 3D echocardiography may permit simultaneous assessment of all segments of the left or right ventricle for regional wall motion abnormality and/or dyssynchrony, detailed assessment of the mechanism and severity of mitral regurgitation, and delineation of paraprosthetic valvular regurgitation (Figure 28-7), although advanced mitral valve assessment is more relevant to the cardiothoracic rather than general ICU setting.
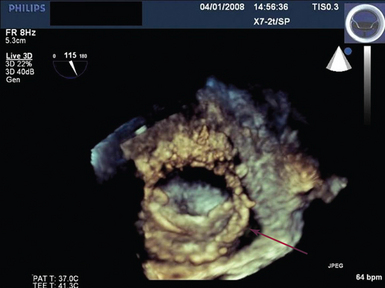
Figure 28-7 Live 3D (4D) TEE view taken from the roof of the left atrium depicting single tilting disc mitral valve prosthesis with paraprosthetic dehiscence (arrow). A miniature of the valve is shown at the top right of the figure. 3D, Three-dimensional; 4D, four-dimensional; TEE, transesophageal echocardiography.
3D echocardiography has been proposed to be superior to two-dimensional (2D) imaging for estimating ejection fraction and diagnosing regional wall motion abnormalities. Its ability to assess intraventricular dyssynchrony of the left ventricle is based upon the regional time-to-minimum systolic volume, which is measured from the onset of the QRS complex, and is inferred from either the maximal difference between two regions or standard deviation of up to 17 regional volumes.12 Assessment of the right ventricle by 3D imaging has been reported to be superior to 2D echocardiography in assessing volumes and contractility. Although 3D echocardiography may underestimate RV volumes (compared with the gold standard of cardiac magnetic resonance imaging), the advantages of a sophisticated bedside imaging technique are clear.13 The potential for 3D/4D echocardiography in assessment of ventricular function in the ICU has not yet been fully explored, but its potential is evident.
Conclusion
The applications of advanced critical care echocardiography are vast, especially when considering cardiac electromechanics.14 With cardiologists returning to the cardiac ICU and intensivists embracing the technique of echocardiography, the potential for future collaborative research in this exciting and dynamic field is clear. The application of older echocardiographic techniques in the ICU should not be neglected, because these techniques still have much to offer.
Pearls and highlights
• Complex critical care echocardiography is not just about complex techniques.
• Use all the echocardiographic tools you have to answer the clinical question, but beware of their applicability in the critical care setting.
• Make echocardiography work for you as a physiologic tool to inspect the heart.
• Remember that normal values in the outpatient setting probably do not apply to your patients.
• Always interpret the echocardiogram within the clinical and pathophysiologic context of the patient.
References
1. Poelaert, JI, Trouerbach, J, De Buyzere, M, et al. Evaluation of transesophageal echocardiography as a diagnostic and therapeutic aid in a critical care setting. Chest. 1995; 107(3):774–779.
2. Duncan, A, Francis, D, Gibson, D, et al. Electromechanical left ventricular resynchronisation by coronary artery bypass surgery. Eur J Cardiothorac Surg. 2004; 26(4):711–719.
3. Milliez, P, Thomas, O, Haggui, A, Schurando, P, et al, Cardiac resynchronisation as a rescue therapy in patients with catecholamine-dependent overt heart failure: results from a short and mid-term study. Eur J Heart Fail. 2008;10(3):291–297.
4. Marwick, TH, Measurement of strain and strain rate by echocardiography: ready for prime time. J Am Coll Cardiol. 2006;47(7):1313–1327.
5. Marciniak, A, Sutherland, GR, Marciniak, M, et al. Prediction of postoperative left ventricular systolic function in patients with chronic mitral regurgitation undergoing valve surgery—the role of deformation imaging. Eur J Cardiothorac Surg. 2011; 40(5):1131–1137.
6. Basu, S, Frank, LH, Fenton, KE, et al. Two-dimensional speckle tracking imaging detects impaired myocardial performance in children with septic shock, not recognized by conventional echocardiography. Pediatr Crit Care Med. 2012; 13(3):259–264.
7. Haddad, F, Hunt SA, Rosentha DN, Murphy, DJ, Right ventricular function in cardiovascular disease, part I: anatomy, physiology, aging, and functional assessment of the right ventricle. Circulation. 2008;117(11):1436–1448.
8. Vonk Noordegraaf, A, Galiè, N. The role of the right ventricle in pulmonary arterial hypertension. Eur Respir Rev. 2011; 20(122):243–253.
9. Cullen, S, Shore, D, Redington, AN, Characterization of right ventricular diastolic performance after complete repair of tetralogy of Fallot: restrictive physiology predicts slow postoperative recovery. Circulation. 1995;91(6):1782–1789.
10. Appleton, CP, Hatle, LK, Popp, RL. Demonstration of restrictive ventricular physiology by Doppler echocardiography. J Am Coll Cardiol. 1988; 11(4):757–768.
11. Haddad, F, Doyle, R, Murphy, DJ, Hunt, SA, Right ventricular function in cardiovascular disease, part II: pathophysiology, clinical importance, and management of right ventricular failure. Circulation. 2008;117(13):1717–1731.
12. Kapetanakis, S, Kearney, MT, Siva, A, et al, Real-time three-dimensional echocardiography: a novel technique to quantify global left ventricular mechanical dyssynchrony. Circulation. 2005;112(7):992–1000.
13. Schattke, S, Wagner, M, Hättasch, R, Single beat 3D echocardiography for the assessment of right ventricular dimension and function after endurance exercise: intraindividual comparison with magnetic resonance imaging. Cardiovasc Ultrasoun. 2012; 10:6.
14. Price, S, Nicol, E, Gibson, DG, Evans, TW, Echocardiography in the critically ill: current and potential roles. Intensive Care Med. 2006;32(1):48–59.
[/level-membership-for-critical-care-medicine-category][not-level-membership-for-critical-care-medicine-category]28
Echocardiography: Beyond the basics
(CONSULTANT-LEVEL EXAMINATION)
Overview
Echocardiography is one of the most powerful diagnostic and monitoring tools available to the modern intensivist. Although its potential was first recognized more than 20 years ago,1 only recently has it become a mainstream imaging application in the intensive care unit (ICU). However, the widespread application of advanced echocardiographic techniques in the ICU remains disappointingly limited to isolated experts across the world, and the huge potential for collaborative research between cardiologists and intensivists in this field remains largely unrecognized. The reasons for this are largely historical; cardiology and intensive care have developed in parallel, with little overlap between the two specialties. With the paradigm shift in cardiologic interventions (percutaneous coronary, valve, and electrophysiologic procedures), there has been an understandable change in focus away from the more traditional specialties based upon cardiac physiology toward the newer interventional subspecialties. The development of complex and sophisticated imaging techniques (cardiac magnetic resonance and computed tomography) has presented further competition to echocardiography as a subspecialty within cardiology. Controversies regarding practice, training, accreditation, and “ownership” have until recently increased the potential conflict between cardiologists and intensivists regarding the use of echocardiography in the ICU (Table 28-1). Nonetheless, increasing availability of ultrasound machines, together with concerns regarding the safety of the pulmonary artery catheter, have resulted in intensivists adopting echocardiography as part of their repertoire of diagnostic and monitoring techniques. This chapter illustrates some neglected physiologic echocardiographic techniques as well as some of the potential areas where newer techniques might prove to be of use in the ICU.
TABLE 28-1
Basic and Advanced Echocardiographic Techniques in the ICU
| Technique | Routine ICU Use Recommended? | Comments |
| Focused basic echocardiography | Yes | Easy, binary decision-making to exclude/diagnose treatable causes of periarrest and arrest states |
| Ejection fraction | No | Normal values unknown in ICU Too many dynamic variables Does not measure contractility |
| Long-axis function | Yes | Easy to acquire (even with suboptimal views) Reproducible Sensitive to ischemia |
| Physiologic Doppler | Yes | Assessment of standard echodynamics Evaluation of t-IVT |
| Strain/strain rate | No | Research tool Not validated in critically ill adults Image resolution an issue |
| 3D/4D | Yes: for specific indications | Delineation of paraprosthetic regurgitation Assessment of mechanism of MR (percutaneous repair) Right ventricular function/dyssynchrony (research) |
Left ventricular (LV) function
The mechanism of LV function in systole and diastole is complex, with differing orientation of fibers at different muscle layers, and comprises minor and long-axis contraction, rotational contraction, as well as differential basal and apical rotational vectors. Of the older techniques, assessment of LV contractility generally either depends upon linear measures of changes in LV internal dimensions (fractional shortening) or differences between systolic and diastolic areas/volumes in the minor axis (ejection fraction), rather than thickening of the myocardium per se. Normal values of fractional shortening and ejection fraction are not known for the critically ill and remain highly variable depending upon ICU interventions in addition to the inherent contractility of the myocardium. The true value of other, less widely used techniques (long-axis function and total isovolumic time) has not yet been realized in the ICU setting, and that of emerging techniques (strain and strain rate) remains to be evaluated.
Long-axis function
The subendocardial fibers of the left ventricle run longitudinally, resulting in the characteristic movement of the mitral annulus toward the apex of the heart in systole, followed by retraction in diastole. Regional myocardial ischemia (induced by positive inotropic agents) may result in changes in regional wall motion scores associated with a fall in cardiac output at peak stress.2 Regional dyssynchrony may also develop, demonstrated by the appearance/worsening of postejection shortening, prolongation of the total isovolumic time (t-IVT), and associated broadening of the QRS duration. This response is in contrast to the normal shortening of the QRS duration and t-IVT in response to inotropic agents. Thus there is potential to diagnose subclinical myocardial ischemia/type I/II myocardial infarction by using this simple technique (Figure 28-1). Further, because t-IVT is a major determinant of maximal cardiac output during pharmacologic stress, it may be possible to titrate, on an individual patient basis, the response to positive inotropic agents, to minimize electromechanical dyssynchrony and avoid limiting cardiac output (Figure 28-2).
Figure 28-1 TTE in a young patient with type II myocardial infarction. A, MAPSE of the lateral wall, with postejection shortening (red arrow). B, PW Doppler of the mitral valve showing abnormal filling with summation (resulting from tachycardia) and a dominant A wave. MAPSE, Mitral annular plane systolic excursion; PW, pulsed wave; TTE, transthoracic echocardiogram.
Figure 28-2 Interventricular dyssynchrony demonstrated by M-mode, TDI, and PW Doppler; A and B, M-mode traces of the right (TAPSE) and left (MAPSE) ventricle, depicting prolonged and late movement of the LV when compared with the RV free wall, as well as reduced excursion. C, PW TDI of the right (green) and left (yellow) ventricle taken from the illustrated regions (miniature images to the left; namely the LV and the RV free wall, respectively). LV TDI velocities are reduced and delayed. D, PW Doppler taken from the pulmonary valve showing a preejection period of 98 msec. E, PW Doppler from the aortic valve, showing a preejection period of 164 msec. Thus echo demonstrates a significant delay in LV contraction compared with the RV, resulting in a delay in ejection. LV, Left ventricle; MAPSE, mitral annular plane systolic excursion; PW, pulsed wave; RV, right ventricle; TAPSE, tricuspid annular plane systolic excursion; TDI, tissue Doppler imaging.
Total isovolumic time (t-IVT)
Factors increasing this measure of global LV electromechanical dyssynchrony include ischemia, conduction system disturbances, and loading conditions. Although there is not extensive literature regarding resynchronization therapy (atrioventricular [AV] and/or ventriculoventricular [VV]) in the ICU, the effects of dyssynchrony are well-recognized (including reduced LV contractility [dP/dT], pulse pressure, ejection fraction and cardiac output, diastolic filling time, and increased duration of mitral regurgitation and t-IVT). Even simple manipulations of heart rate and AV delay can result in significant improvement in cardiac filling (Figure 28-3). Global LV electromechanical dyssynchrony measured by t-IVT is common (22% patients in cardiothoracic ICUs) and is associated with increased mortality (7.5% vs. 25%, P
[/not-level-membership-for-critical-care-medicine-category]
