Chapter 5
Echocardiography
1. How does echocardiography work?
Appropriateness criteria for obtaining an echocardiogram are given in Box 5-1.
Box 5-1 APPROPRIATENESS CRITERIA FOR ECHOCARDIOGRAPHY
Appropriate indications include, but are not limited to:
 Symptoms possibly related to cardiac etiology, such as dyspnea, shortness of breath, lightheadedness, syncope, cerebrovascular events
 Initial evaluation of left-sided ventricular function after acute myocardial infarction
 Evaluation of cardiac murmur in suspected valve disease
 Sustained ventricular tachycardia or supraventricular tachycardia
 Evaluation of suspected pulmonary artery hypertension
 Evaluation of acute chest pain with nondiagnostic laboratory markers and electrocardiogram
 Evaluation of known native or prosthetic valve disease in a patient with change of clinical status


 Evaluation of suspected aortic pathology, including dissection
 Guidance during percutaneous cardiac procedures, including ablation and mitral valvuloplasty
 To determine the mechanism of regurgitation and suitability of valve repair
 Diagnose or manage endocarditis in patients with moderate to high probability of endocarditis


Modified from Douglas PS, Khandheria B, Stainback RF, et al: ACCF/ASE/ACEP/ASNC/SCAI/SCCT/SCMR 2007 appropriateness criteria for transthoracic and transesophageal echocardiography. J Am Coll Cardiol 50:187-204, 2007.
2. What is the difference between echocardiography and Doppler?
 Pulsed Doppler (Fig. 5-1, A), which can localize the site of flow acceleration but is prone to aliasing
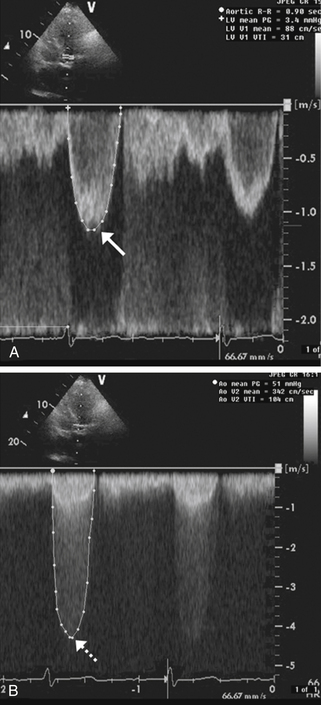
Figure 5-1 Doppler assessment used in patients with aortic stenosis. A shows pulsed Doppler in the left ventricular outflow tract in a patient with aortic stenosis. The peak velocity of the spectral tracing (arrow) is 1.2 msec, indicating normal flow velocity proximal to the aortic valve. B shows continuous Doppler across the aortic valve revealing a peak velocity of 4.5 msec (dashed arrow). Therefore, the blood-flow velocity nearly quadrupled across the stenotic aortic valve, consistent with severe aortic stenosis.
 Continuous-wave Doppler (Fig. 5-1, B), which cannot localize the level of flow acceleration but can identify very high velocities without aliasing
 Color Doppler (Fig. 5-2), which uses different colors (usually red and blue) to identify flow toward and away from the transducer, respectively, and identify flow acceleration qualitatively by showing a mix of color to represent high velocity or aliased flow
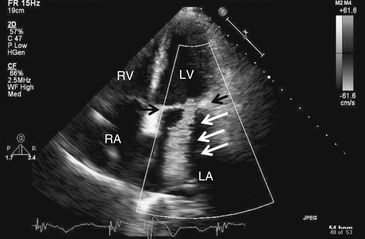
Figure 5-2 Mitral regurgitation. Apical four-chamber view with color Doppler revealing severe mitral regurgitation (white arrows). Black arrows point to the mitral valve. Note that in actuality, the regurgitant jet is displayed in color, corresponding to the flow of blood. LA, Left atrium; LV, left ventricle; RA, right atrium; RV, right ventricle.
Doppler is particularly useful for assessing the hemodynamic significance of cardiac structural disease, such as the severity of aortic stenosis (see Fig. 5-1), degree of mitral regurgitation (see Fig. 5-2), flow velocity across a ventricular septal defect, or severity of pulmonary hypertension. The great majority of echocardiograms are ordered as echocardiography with Doppler to answer cardiac morphologic and hemodynamic questions in one study (e.g., a mitral stenosis murmur); 2-D echo to identify the restricted, thickened, and calcified mitral valve (Fig. 5-3); and Doppler to analyze its severity based on transvalvular flow velocities and gradients.
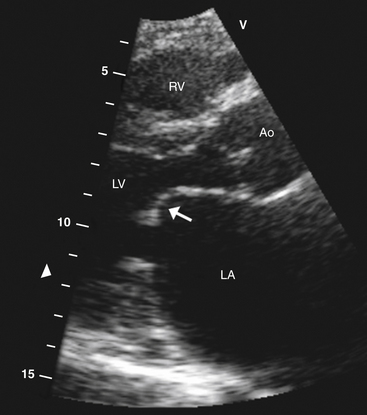
Figure 5-3 Parasternal long-axis view showing typical hockey stick appearance of the mitral valve (arrow) in rheumatic mitral stenosis. Ao, Aortic valve; LA, left atrium; LV, left ventricle; RV, right ventricle.
3. How is systolic function assessed using echocardiography?

 The Simpson method (method of discs) in which the LV endocardial border of multiple “slices” of the left ventricle is traced in systole and diastole, and the end-diastolic and end-systolic volumes are computed from these tracings, is one of the most common methods of calculating LVEF.
 The Teicholz method, in which the shortening fraction:

is multiplied by 1.7, can also be used to estimate LVEF (although this method is inaccurate in patients with regional wall motion abnormalities).
 Visual estimation of LVEF by expert echocardiography readers is also commonly used.


4. What is an echocardiographic diastolic assessment? What information can it provide?
 LV relaxation is usually best determined using tissue Doppler imaging, which assesses early diastolic filling velocity (Ea) of the LV myocardium. Normal hearts have Ea of 10 cm/sec or greater; impaired relaxation is present when Ea is less than 10 cm/sec.

5. How can echocardiography with Doppler be used to answer cardiac hemodynamic questions?
 Stroke volume and cardiac output can be obtained with measurements of the LV outflow tract and time-velocity integral (TVI) of blood through the LV outflow tract.


6. How is echocardiography used to evaluate valvular disease?
 Two-dimensional echocardiography can provide accurate visualization of valve structure to assess morphologic abnormalities (calcification, prolapse, flail, rheumatic disease, endocarditis). Figure 5-3 demonstrates the restricted movement of the mitral valve in a patient with mitral stenosis.


7. How can echocardiography help diagnose and manage patients with suspected pericardial disease?
 Echocardiography can diagnose pericardial effusions (Fig. 5-4) because fluid in the pericardial space readily transmits ultrasound (appears black on echo).
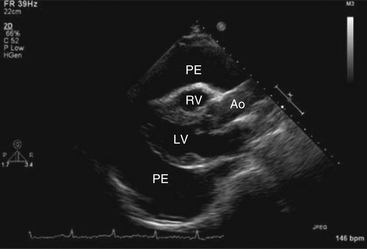
Figure 5-4 Parasternal long-axis view showing a large pericardial effusion (PE) surrounding the heart. Ao, Aorta; LV, left ventricle; RV, right ventricle. (From Kabbani SS, LeWinter M: Cardiac constriction and restriction. In Crawford MH, DiMarco JP, editors: Cardiology, St Louis, 2001, Mosby.)


 Diastolic indentation or collapse of the right ventricle (RV)
 Compression of the right atrium (RA) for more than one-third of the cardiac cycle
 Lack of inferior vena cava (IVC) collapsibility with deep inspiration
 25% or greater variation in mitral or aortic Doppler flows
 50% or greater variation of tricuspid or pulmonic valves flows with inspiration


8. What is the role of echocardiography in patients with ischemic stroke?
 Depressed LV ejection fraction, generally less than 40%
 Left ventricular or left atrial clot (Fig. 5-5)
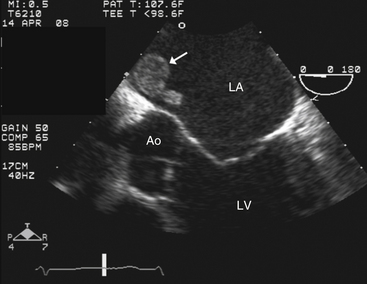
Figure 5-5 Transesophageal echocardiography showing a left atrial thrombus (arrow). Ao, Aortic valve; LA, left atrium; LV, left ventricle.
 Intracardiac mass such as tumor or endocarditis
 Mitral stenosis (especially with a history of atrial fibrillation)
 Prosthetic valve in the mitral or aortic position
 Significant atherosclerotic disease in the aortic root, ascending aorta, or aortic arch

Note: A normal transthoracic echocardiogram in a patient without atrial fibrillation generally excludes a cardiac embolic source of clot and generally obviates the need for transesophageal echocardiography (TEE).
9. What are the echocardiographic findings in hypertrophic cardiomyopathy (HCM)?
 Septal, concentric, or apical hypertrophy (walls greater than 1.5 cm in diameter)
 The presence of systolic anterior motion (SAM) of the mitral valve in some cases of obstructive hypertrophic cardiomyopathy (Fig. 5-6)
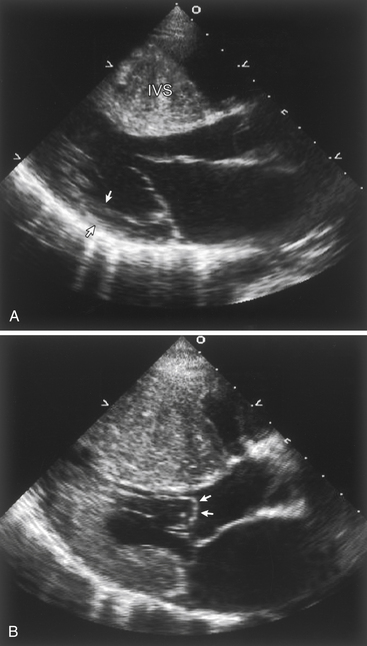
Figure 5-6 Echocardiographic findings in hypertrophic cardiomyopathy. A, Parasternal long axis image during diastole demonstrating massive thickening of the interventricular septum (IVS) when compared to the thickness of the posterior wall (arrows). B, During systole, echocardiography demonstrates systolic anterior motion (SAM) of the mitral valve, with the leaflets actually bowing in to the left ventricular outflow tract (arrows).

10. What are the common indications for transesophageal echocardiography?
 Significant clinical suspicion of endocarditis in patients with suboptimal transthoracic windows
 Significant clinical suspicion of endocarditis in patients with prosthetic heart valve
 Suspected aortic dissection (Fig. 5-7)
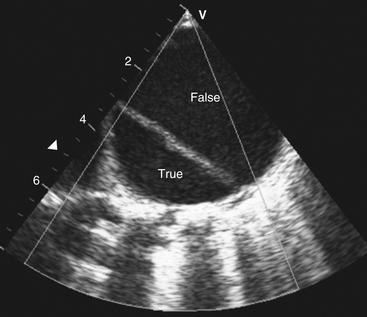
Figure 5-7 Transesophageal echocardiography revealing dissection of the descending thoracic aorta. The true aortic lumen (True) is seen separated from the false lumen (False) by the dissection.

 Embolic stroke with nondiagnostic transthoracic echo
 Endocarditis with suspected valvular complications (abscess, fistula, pseudoaneurysm)
 Evaluation of the mitral valve in cases of possible surgical mitral valve
 Intracardiac shunt in which the location is not well seen on transthoracic echocardiography
 Assessment of the left atria and left atrial appendage for the presence of thrombus (clot) (see Fig. 5-5) prior to planned cardioversion
11. What is contrast echocardiography?
Because synthetic microbubbles are smaller than saline bubbles, they cross the pulmonary capillaries and are used to image left heart structures. Most commonly, synthetic microbubbles are used to achieve better endocardial border definition in patients with suboptimal echocardiographic windows. Contrast echocardiography is also used to better visualize structures such as possible LV clots or other masses.
Both synthetic and saline contrast agents can be used to augment Doppler signals, for example, in patients with pulmonary hypertension in whom a tricuspid regurgitation jet is needed to estimate pulmonary artery pressure.
12. What is stress echocardiography?


Bibliography, Suggested Readings, and Websites
1. Abraham, T.P., Dimaano, V.L., Liang, H.Y. Role of tissue Doppler and strain echocardiography in current clinical practice. Circulation. 2007;116:2597–2609.
2. Armstrong, W.F., Zoghbi, W.A. Stress echocardiography: current methodology and clinical applications. J Am Coll Cardiol. 2005;45:1739–1747.
3. Douglas, P.S., Khandheria, B., Stainback, R.F., et al. ACCF/ASE/ACEP/ASNC/SCAI/SCCT/SCMR 2007 appropriateness criteria for transthoracic and transesophageal echocardiography. J Am Coll Cardiol. 2007;50:187–204.
4. Evangelista, A., Gonzalez-Alujas, M.T. Echocardiography in infective endocarditis. Heart. 2004;90:614–617.
5. Grayburn, P.A. How to measure severity of mitral regurgitation: valvular heart disease. Heart. 2008;94:376–383.
6. Kirkpatrick, J.N., Vannan, M.A., Narula, J., et al. Echocardiography in heart failure: applications, utility, and new horizons. J Am Coll Cardiol. 2007;50:381–396.
7. Lang, R.M., Mor-Avi, V., Sugeng, L., et al. Three-dimensional echocardiography: the benefits of the additional dimension. J Am Coll Cardiol. 2006;48:2053–2069.
8. Lester, S.J., Tajik, A.J., Nishimura, R.A., et al. Unlocking the mysteries of diastolic function: deciphering the Rosetta Stone 10 years later. J Am Coll Cardiol. 2008;51:679–689.
9. Otto, C.M. Valvular aortic stenosis: disease severity and timing of intervention. J Am Coll Cardiol. 2006;47:2141–2151.
10. Peterson, G.E., Brickner, M.E., Reimold, S.C. Transesophageal echocardiography: clinical indications and applications. Circulation. 2003;107:2398–2402.
11. Stewart, M.J. Contrast echocardiography. Heart. 2003;89:342–348.