Echocardiography

Approach to Echocardiography
Cardiac Anatomy
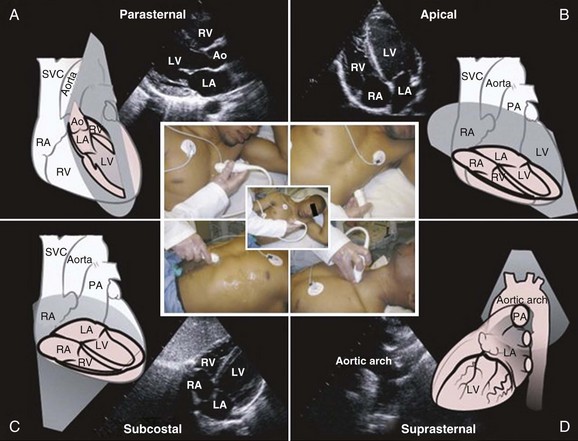
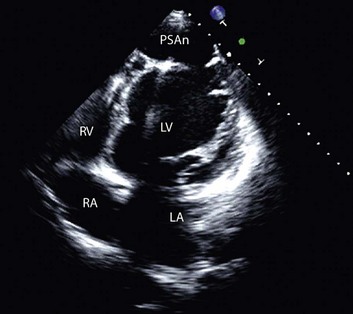
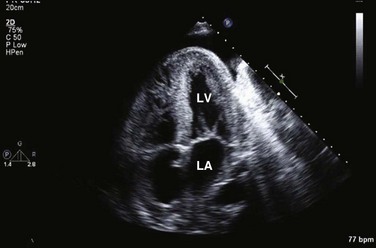
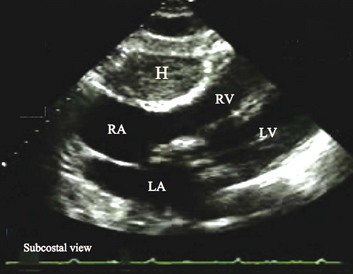
Transthoracic echocardiography provides an excellent noninvasive means of assessing cardiac anatomy. Briefly, there are parasternal views, taken from approximately 2 cm leftward from the sternum and the fourth to fifth rib interspace, apical views, taken from the LV apex; subcostal views, taken from the epigastrium, and suprasternal views, taken from the sternal notch. Multiple images from different projections are needed to provide a complete view of the heart, manipulating the probe to provide long- and short-axis images of each structure interrogated.1–3 The position of the echocardiographic transducer and the subsequent views produced are summarized in Figure 8.1.
Basic Echocardiographic Principles
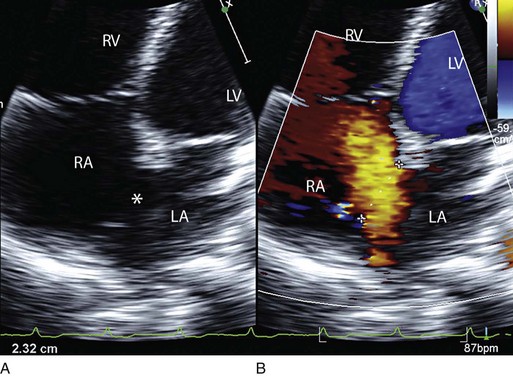
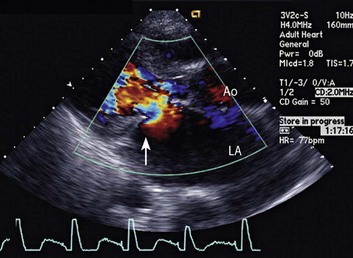
Doppler echocardiography uses ultrasound to determine blood flow velocity and direction within the heart. Two principal types of spectral Doppler techniques are used, termed continuous wave (CW) and pulsed wave (PW). CW uses two separate transducer crystals, one continuously transmitting and one continuously receiving the ultrasound signal. The high sampling rate of CW allows it to measure high velocities, but the source of any specific velocity measurement along the interrogated path cannot be differentiated (range ambiguity). On the other hand, PW uses one crystal, which alternates between sending and receiving an ultrasound pulse. The principal advantage of PW is that signals arise only from the area of interrogation, called the sample volume (range resolution); however, because the same crystal is used for sending and receiving the signal, a new pulse of ultrasound cannot be transmitted until the previous returning signal has been detected. This “pulsed” process results in too low a sampling rate to quantitate high velocities. PW and CW are thus complementary, with PW localizing the source of a signal and CW allowing for the unambiguous measurement of high velocities.4 Color flow imaging is a form of PW in which information is coded with colors and superimposed on a 2D ultrasound image. Black and white identifies anatomic structures and color identifies blood flow velocities. Color Doppler has great utility in the evaluation of valvular regurgitant lesions and intracardiac shunts. An example of color Doppler identification of an atrial septal defect (ASD) with left-to-right shunting is shown in Figure 8.2. Pulsed Doppler can also evaluate the velocity of moving myocardium, which produces a signal of low velocity but high amplitude, named tissue Doppler imaging (TDI). Systolic and diastolic velocities within the myocardium and at the corners of mitral annulus can be recorded. Mitral annular velocities as measured by TDI are commonly used to evaluate diastolic function.5
Additional Echocardiographic Modalities
Transesophageal Echocardiography
When transthoracic echocardiography (TTE) image quality is suboptimal in certain patients in critical care—obesity, lung disease, uncooperative patient, ventilated patient, or when bandages or drainage tubes obscure the standard echo windows—transesophageal echocardiography (TEE) can be of great use.6,7 TEE involves insertion into the esophagus of an endoscope-like probe with an ultrasound transducer on its tip. Image resolution is improved with TEE because the ultrasound beam is unimpeded by bone and air, and because proximity to the heart enables use of high-frequency (7 MHz) probes. TEE can easily be performed at the bedside. Active esophageal disease is the major contraindication. A topical oral anesthetic spray is administered as well as an agent for conscious sedation. The TEE can be done with a nasogastric tube in place, but the nasogastric tube should be removed if there are any difficulties with passing the probe or in acquiring the images. Patients require blood pressure, respiratory, O2 saturation, and heart rate monitoring during the procedure. A comprehensive transesophageal examination typically takes about 20 minutes for imaging, and then requires a period of recovery time.
Contrast Echocardiography
Saline Contrast
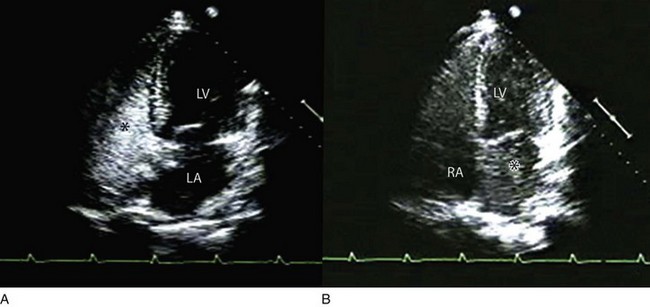
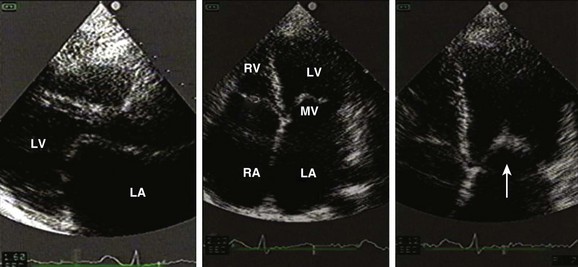
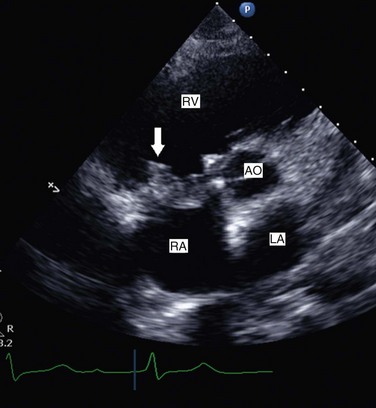
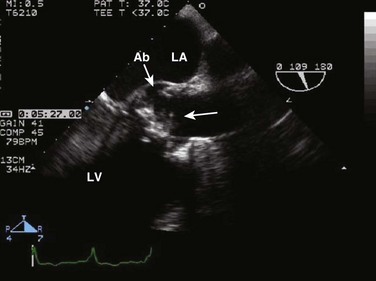
Echocardiographic contrast agents are substances that enhance the reflected ultrasound signal. Simple agitated saline contrast can be used to detect intracardiac shunts, commonly at the atrial level. To detect an intracardiac shunt, a contrast study can be done with agitated saline. In this technique, a 10-mL syringe containing 8 mL of normal saline is connected to a second 10-mL syringe containing 1 cm3 of air via a three-way stopcock. Brisk exchange of the saline between the syringes creates microbubbles, which are then rapidly injected as an intravenous bolus, resulting in opacification of the right chambers of the heart. Saline contrast bubbles are too large to pass through the pulmonary capillaries but may appear in the left atrium and left ventricle as a result of passage across an intracardiac (ASD or patent foramen ovale [PFO]) or intrapulmonary communication; occasionally, a cough or Valsalva maneuver may transiently increase right-sided heart pressures and facilitate right-to-left crossover of bubbles.8 Pulmonary arteriovenous malformations (AVMs) will demonstrate appearance of very small saline contrast in the left atrium; however, these bubbles are typically smaller than those that transit across an intracardiac shunt, and usually appear late after injection (after >7-10 beats) and persist after the right side of heart empties of contrast saline, representing the typical transit time of the contrast saline through the pulmonary bed and the AVM into the pulmonary veins. An example of saline contrast echocardiography with a right-to-left interatrial shunt is shown in Figure 8.3.
Contrast for Left Ventricular Opacification
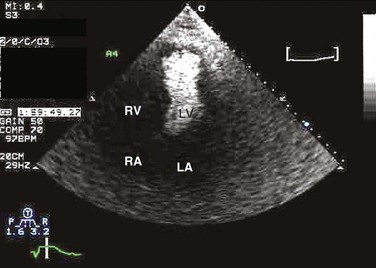
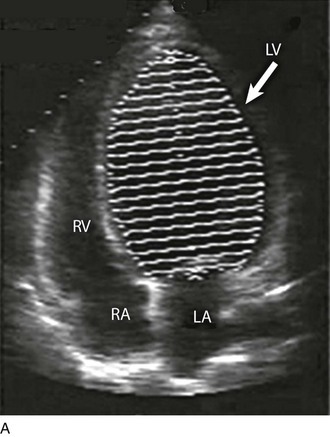
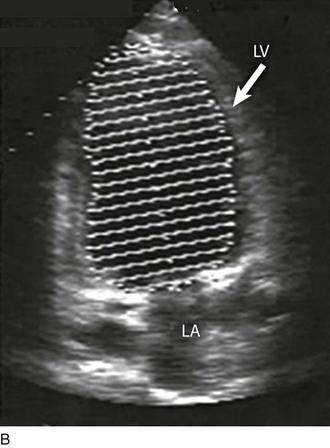
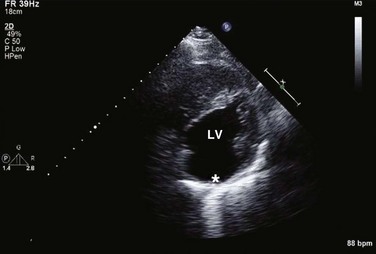
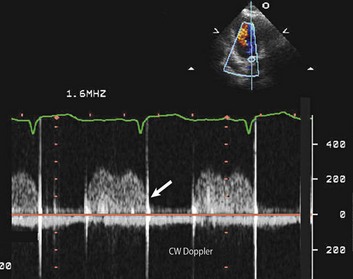
Commercially available contrast agents, specifically formulated to pass through the pulmonary capillary bed, can be used to opacify intracardiac chambers in order to enhance endocardial border definition. When activated, contrast agents yield perfluorocarbon microbubbles encapsulated in either a lipid or albumin shell, which exhibit lower acoustic impedance than blood and enhance the intrinsic backscatter of blood.9 The most important clinical use of contrast agents in critical care is for left ventricular opacification (LVO), to be used when standard TTE images are suboptimal, which occurs in 25% or more of cases in the critical care setting.10 These agents are useful in improving image quality in technically difficult echocardiograms and can provide significant additional diagnostic information, especially on LV function, the presence of LV apical thrombus, and detection of LV wall motion abnormalities.11 Importantly, contrast for LVO has also been shown to reduce the need for other, more involved imaging modalities in the critical care population, such as TEE.12–14 An example of contrast used for LVO in a patient with technically difficult echo windows is shown in Figure 8.4. In patients in whom contrast for LVO is used, the enhanced Doppler signals with the use of contrast can also be utilized for detection and measurement of faint tricuspid regurgitation (TR) signals for the estimation of pulmonary artery (PA) pressure, especially important in the critical care scenario.10
Handheld Echocardiography
Handheld ultrasound devices are small, highly portable devices that can now be held in the palm of a hand. They can provide reasonable 2D and color Doppler images, have been shown to correlate reasonably well with full echocardiographic platforms, and detect clinically relevant findings.15 Early concerns that unskilled users would obtain and subsequently misinterpret poor quality data have largely been ameliorated, and several reasonable studies suggest that noncardiology trained intensivists can successfully perform and correctly interpret a goal-directed transthoracic echocardiogram with a handheld device.16,17 “Goal-directed” 2D imaging is typically limited to the assessment of biventricular size and function, and presence or absence of pericardial effusion. As handheld devices are technically adequate to evaluate major cardiac disease or trauma, a focused 2D study done by a trained individual with only a handheld device has great potential for rapid triage of patients in the emergency room or the intensive care area.18–23 It is important to emphasize that unclear or ambiguous findings on handheld examination should be followed by a full study on a full echocardiographic platform to obtain accurate diagnosis; in addition, full Doppler interrogation for accurate detection of valve stenosis/regurgitation and accurate hemodynamic evaluation in suspected tamponade warrant comprehensive echocardiography on full-platform machines.
Indications for Echocardiography
Although a broad range of critically ill patients are candidates for TTE to assess cardiac pathology and function, specific indications are summarized in Box 8.1. In general, any critical care patient with unexplained hypotension, pulmonary congestion, hemodynamic instability, known cardiac disease, a significant unexplained cardiac murmur, thoracic trauma, or suspected endocarditis are candidates for echocardiography. The most common use of TEE in critical care is inadequate or nondiagnostic TTE. Box 8.2 lists the major indications for use of TEE in critical care.
Assessment of Left Ventricular Function
Systolic Function
Although there are a variety of methods to assess LV systolic function by echocardiography (Doppler calculation of stroke volume, dP/dt using mitral regurgitation [MR] signal, tissue Doppler systolic velocity, and systolic strain and strain rate), the most commonly used and clinically relevant is the calculation or estimation of LV ejection fraction (EF).24,25 As recommended in current guidelines,24 calculation of left ventricular ejection fraction (LVEF) by method of discs (Fig. 8.5) is recommended, although visual estimation of LVEF is reliable when technically adequate images are evaluated by experienced echocardiographers.26 EF (end-diastolic volume − end-systolic volume/end-diastolic volume) is dependent not only on intrinsic contractility but also on LV preload and afterload. Therefore, both factors should be considered when assessing LV systolic function. In general, LV systolic function is hyperdynamic when LVEF is greater than 70%, normal at 55% to 70%, mildly depressed at 45% to 54%, moderately depressed at 30% to 44%, and severely depressed at less than 30% (Table 8.1).24 In the presence of regional dysfunction, EF from multiple views should be integrated to accurately assess LV systolic function. To improve the accuracy of EF calculation by echocardiography, it is essential to avoid foreshortened apical views and to use intravenous contrast material when needed to enhance endocardial border definition (see Fig. 8.4). Aside from measurements of systolic function, 2D echocardiography is of great use in reliably assessing LV dimensions, wall thickness, volumes, and mass.24 Reliable assessments of LV dimensions and EF, particularly when combined with knowledge of filling pressures, can be used to guide and assess the response to therapeutic measures of volume infusion or intravenous administration of inotropic/vasodilator or vasopressor drugs.
Table 8.1
Grading Left Ventricular Systolic Function by Left Ventricular Ejection Fraction
| Systolic Function | Ejection Fraction |
| Hyperdynamic | >70% |
| Normal | 55-70% |
| Mildly depressed | 45-54% |
| Moderately depressed | 30-44% |
| Severely depressed | <30% |
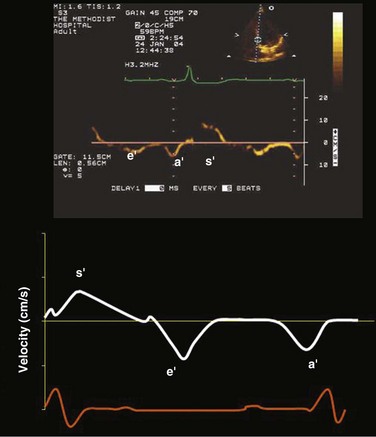
TDI-derived myocardial velocities (Fig. 8.6) have been utilized to assess global LV systolic properties.27 This approach is dependent on TD technology to record mitral annulus and myocardial signals, which can be acquired from any area of the heart. However, because of their dependence on Doppler principles, they are of limited value when proper alignment cannot be achieved between the ultrasound beam and the plane of cardiac motion. TDI measurements of systolic annular velocity have been shown to reflect systolic dysfunction, even in the presence of normal LVEF (such as in hypertrophic cardiomyopathy [HCM] or infiltrative cardiomyopathy [ICM]).27–29 Using speckle tracking imaging, a 2D echocardiographic technique that measures myocardial motion over time, myocardial deformation (strain) and rate of deformation (strain rate) can also be used to assess LV systolic function.30,31 As in TDI, strain and strain rate can detect significant myocardial systolic abnormalities, even in the presence of preserved LVEF.32,33 As with TDI, this is of particular importance in patients with diastolic heart failure, hypertensive heart disease, HCM, and infiltrative disease, when normal EF can coexist with significant and clinically important abnormalities of systolic function.
Diastolic Dysfunction
LV diastolic dysfunction in the intensive care unit (ICU) may be present as a result of cardiac as well as systemic disorders that can affect cardiac function: coronary and hypertensive heart disease, diabetes mellitus, amyloidosis, and HCM. A careful assessment of LV diastolic function by echocardiography can contribute essential information for the management of these patients.34–36 In general, LV diastolic function refers to LV relaxation (measured as the rate of decay of LV systolic pressure during the isovolumic relaxation period) and LV chamber stiffness. In turn, chamber stiffness is calculated using measurements of LV volume and pressure during the diastolic filling period. However, prediction of LV filling pressures integrates the effects of the preceding hemodynamic variables as well as other factors such as RV filling, pericardial constraint, and LA function on LV diastolic function.
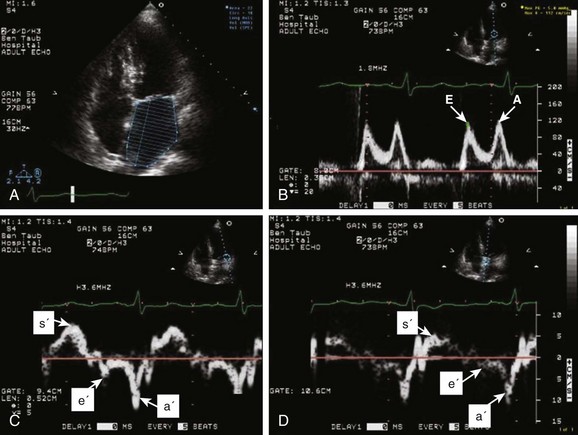
The recommended clinical approach for the assessment of LV diastolic function (European Association of Echocardiography [ASE] guideline algorithms) begins with the 2D examination to determine LV dimensions and volumes and the presence and extent of LV hypertrophy, using standard ASE criteria (Figs. 8.7 and 8.8).37 Patients with a depressed EF or LV hypertrophy have impaired LV relaxation. Therefore, even in the absence of any corroborating Doppler information, one can still conclude that LV relaxation is impaired in these patients. Furthermore, this information can be combined with the mitral inflow pattern to predict filling pressures. It is also important to measure left atrial (LA) volume using apical four- and two-chamber views because LA volume is related to the extent of diastolic dysfunction when increase in LA volume parallels deterioration of LV diastolic function.38 Mitral inflow is obtained using pulse Doppler, with a 1- to 2-mm sample volume placed at the level of mitral valve tips.39 Early diastolic flow and velocity (E) occur in response to a positive pressure gradient between the LA and the LV, resulting from a rapidly decreasing LV pressure due to LV relaxation and early diastolic suction. In late diastole, LA contraction leads to another positive pressure gradient and late diastolic flow or the A velocity. With normal LV relaxation, early diastolic flow predominates and the E/A ratio is greater than 1. However, when LV relaxation is impaired, LV diastolic pressure is elevated and a reduced E velocity is observed. This leads to a higher LA preload and contraction velocity. Therefore, the E/A ratio decreases in the presence of impaired LV relaxation. Because LA pressure usually increases to maintain forward stroke volume, early diastolic transmitral pressure gradient increases, leading to a higher E velocity and E/A ratio. Because of the simulation to normal mitral inflow, this pattern is referred to as a pseudonormal mitral inflow pattern. In more advanced disease with markedly elevated LA pressure, the E velocity increases even further, resulting in a “restrictive” inflow pattern, in which E/A ratio is 2 or greater. It is possible to unmask the presence of impaired LV relaxation in these cases by performing a Valsalva maneuver. The decrease in venous return during the strain phase of Valsalva results in a decrease in LA pressure and E/A ratio.40–42 TD-derived early diastolic mitral annular velocity (e′) can be recorded by pulsed Doppler at mitral annulus. When combined with E, E/e′ ratio is obtained, which has been shown to be a reasonable correlate of LV filling pressure,41 although multiple diastolic echo-Doppler variables need to be synthesized to result in an accurate assessment of LV diastolic function.43–45
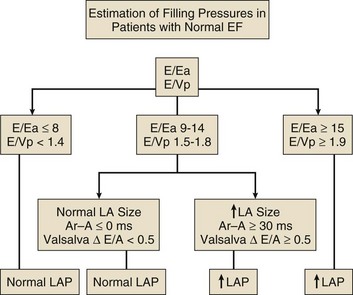
Figure 8.7 Algorithm for estimation of left ventricular filling pressures with normal ejection fraction.
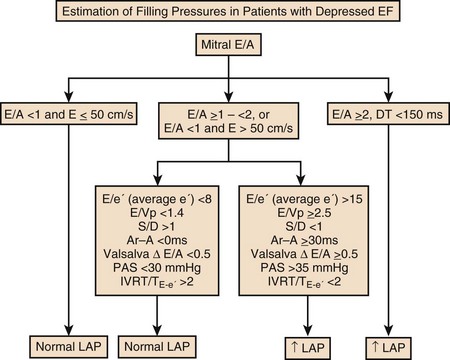
Figure 8.8 Algorithm for estimation of left ventricular filling pressures with depressed ejection fraction.
Pulmonary venous (PV) flow can also be analyzed to predict LV filling pressures. PV flow signals are readily recorded in the majority of patients seen in the outpatient laboratory but can be challenging in the critical care setting. Antegrade forward flow from the pulmonary vein into the left atrium occurs during systole (S) and early and mid-diastole (D). After atrial contraction, retrograde flow (Ar) from the left atrium into the pulmonary vein occurs. At the earlier stages of diastolic dysfunction where LV end-diastolic pressure is increased, the peak velocity and duration of Ar (velocity > 30 cm/second and Ar-A duration ≥ 35 ms) become more prominent.42,46 Subsequently, with the rise in mean LA pressure, antegrade systolic flow decreases, whereas the D velocity increases with a shortening of its deceleration time. Assessment of PA systolic and diastolic pressures (see later) can provide helpful corroborating evidence of the status of LV filling pressures. In the absence of pulmonary parenchymal and vascular disease, and in the presence of significant cardiac valvular disease or cardiomyopathy, one can reasonably infer that PA pressures are increased due to an elevated LA pressure. Figure 8.9 shows an example of a patient with preserved LVEF with elevated LV filling pressures as assessed by integrated diastolic assessment with multiple echo-Doppler variables.
Ischemia/Infarction Including Complications
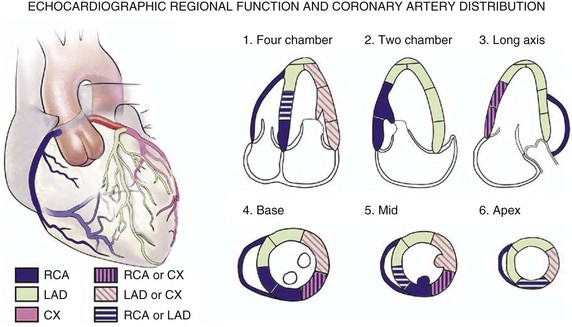
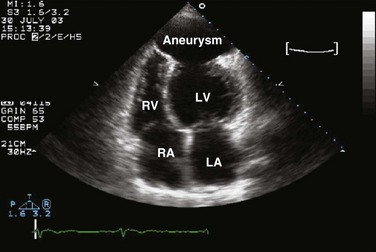
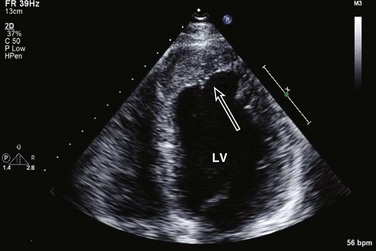
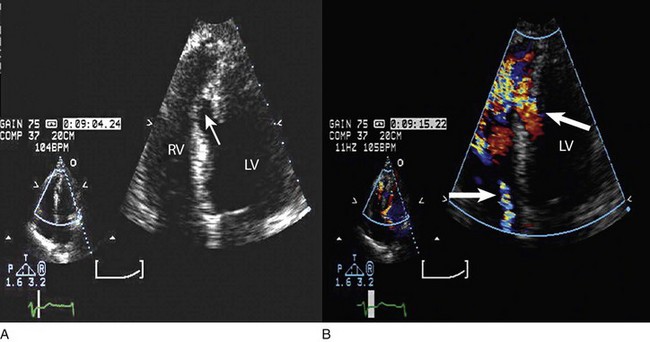
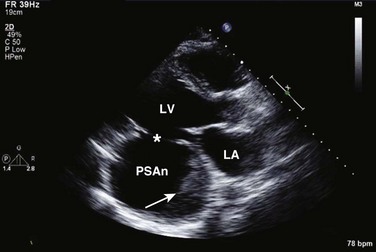
Echocardiography is essential for the assessment of LV regional function in the critical care setting when the diagnosis of ischemia/infarction is entertained. Adequate images, particularly when combined with harmonics and intravenous contrast, can provide comparable information to that obtained by TEE.12,13 Furthermore, serial assessment of regional function is possible after the administration of thrombolytic drugs or percutaneous revascularization. In addition to technically good images, interpretation by an experienced echocardiographer is essential for achieving high accuracy. Regional function is determined by examining endocardial motion as well as local thickening. Abnormal LV regional function is usually determined when the dysfunction is observed in more than one plane, with particular LV segments corresponding to specific coronary artery distributions. An echocardiographic regional map for the identification of wall motion abnormalities and their correlation to coronary anatomy is shown in Figure 8.10. In general, thin (<5 mm in diameter), bright myocardial walls with abnormal motion are indicative of scars [?] (Fig. 8.11). When there is a wall with thin walls that moves opposite to adjacent, normal walls (“bulging”), aneurysm is often the cause (Fig. 8.12); in this case, thrombus in the aneurysm must be excluded to prevent systemic embolism. In addition to epicardial coronary artery disease, myocarditis, dilated cardiomyopathy (DCM), and abnormal conduction patterns (particularly RV pacing and left bundle branch block) can result in regional dysfunction. Therefore, final conclusions regarding cause of wall motion abnormalities should be made only after integration of clinical findings including electrocardiogram (ECG). In the setting of acute myocardial infarction, a number of studies have substantiated the prognostic power of echocardiography, particularly LVEF, LV diastolic function, RV function, and significant valve dysfunction.47 Regional function is most reflective of long-term outcome when imaging is performed after recovery of myocardial stunning (usually a week to 10 days after presentation). However, in the acute setting, echocardiography may be obtained to help establish the diagnosis of an acute ischemic syndrome, determine the extent of myocardium at risk, identify apical clots (Fig. 8.13), and detect the presence of mechanical complications such as ventricular septal defect (VSD) (Fig. 8.14), contained cardiac rupture called pseudoaneurysms (Figs. 8.15 and 8.16), MR, pericardial effusion, and RV infarction, all of which may require urgent intervention.48
Cardiomyopathy
Hypertrophic Cardiomypathy
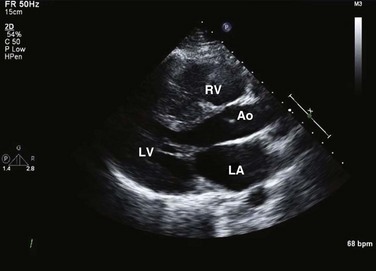
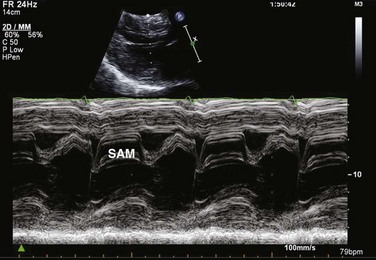
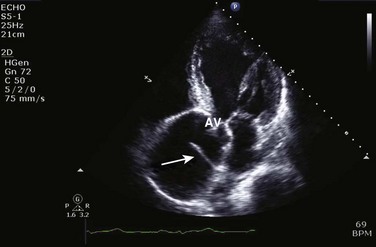
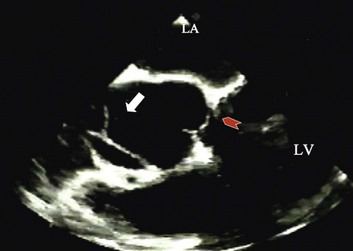
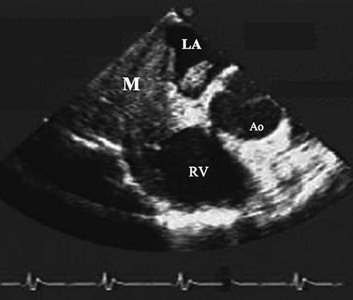
HCM is an inherited disorder that is characterized by unexplained LV hypertrophy in the absence of longstanding hypertension or infiltrative disease.49 At the pathologic level, there is myocyte disarray, with replacement of healthy myocytes with fibrosis. Therefore, on echocardiography, thick LV walls with elevated LV mass are seen. Early in the disease, LV function is usually hyperdynamic, although late in the disease, LVEF can become depressed (“burned-out HCM”). There are various morphologic types of HCM, including septal hypertrophy (Fig. 8.17), concentric (uniform) hypertrophy, apical hypertrophy, and hypertrophy concentrated in LV walls other than the septum. It is important to understand that LV obstruction with resultant dynamic gradients can occur in any of these morphologic types, thus the differentiation between obstructive and nonobstructive HCM. Echocardiography is uniquely positioned to differentiate these morphologic types, determine LV systolic function, assess for left ventricular outflow tract (LVOT) obstruction, identify associated MR, and determine LV filling pressures and PA pressure.50 Obstruction in HCM is most often caused by systolic anterior motion (SAM) of the mitral valve (Fig. 8.18), which physically obstructs the LVOT, resulting in a significant gradient. From the clinical point of view, HCM patients can present to critical care with hypotension, congestive heart failure, arrhythmias, stroke, and cardiac arrest; echocardiography is crucial in differentiating the underlying disease state and functional/morphologic associations with these presentations.
Dilated Cardiomyopathy
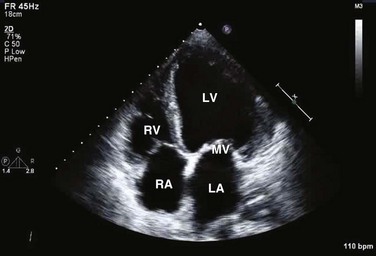
DCM refers to nonischemic global LV systolic dysfunction often associated with RV dysfunction. Although viral myocarditis can cause this same picture, in general, DCM refers to familial inherited cardiomyopathy but can be caused by a variety of conditions including alcohol abuse, chemotherapeutic agents, and endocrine disorders. As genetic methods for diagnosing inherited DCM become more refined, an increasing proportion of idiopathic nonischemic cardiomypathy is found to be inherited.51 From the echocardiographic standpoint, DCM is readily diagnosed by dilated LV with depressed EF and often RV dysfunction; for final diagnosis, exclusion of a sufficient degree of coronary artery disease to explain degree of LV dysfunction is necessary.52 Secondary MR and TR can be seen by color and spectral Doppler interrogation, and LV filling pressure and PA pressure assessments are important in clinical management. An example of a patient with DCM is seen in Figure 8.19.
Infiltrative/Restrictive Cardiomyopathy
ICMs are characterized by the deposition of abnormal substances that cause the ventricular walls to become progressively rigid, thereby impeding ventricular filling.53 This impedance to normal LV filling is termed “restrictive filling;” hence the other name, “restrictive cardiomyopathy.” However, because any cardiomyopathic process can have restrictive filling (ischemic, dilated, hypertrophic), the preferred term is ICM. Some ICMs can cause LV and RV thickening, such as the archetypal ICM cardiac amyloidosis (Fig. 8.20), although others can cause ventricular thinning, such as sarcoidosis. From the echocardiographic point of view, thickened ventricular walls with restrictive LV filling and at time depressed LVEF are seen in amyloidosis;54 the differentiation from HCM and hypertensive heart disease is made by the presence of low ECG voltages in ICM, as normal myocytes are replaced by amyloid. For sarcoidosis, many LV patterns can be seen, but focal LV aneurysms are typical; heart block on ECG is also often seen.
Assessment of Right Ventricular Function
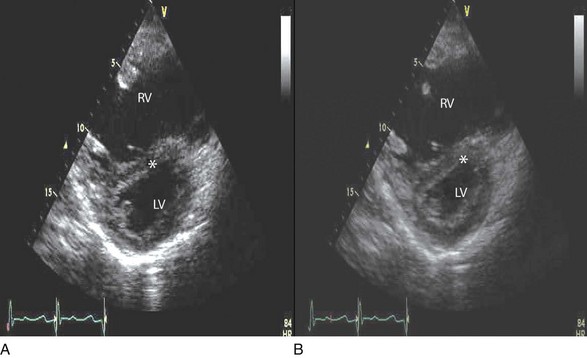
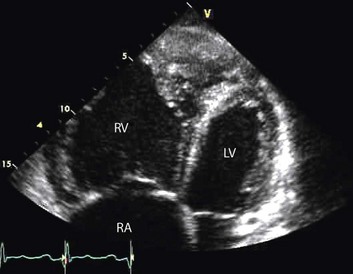
Echocardiographic assessment of RV function is challenging because of its complex shape. However, it is possible to integrate information from multiple views to reach reasonably accurate conclusions on RV size and function. In the parasternal short-axis view, the RV appears crescent-shaped, whereas in the apical four-chamber view it is triangular with its base along the tricuspid valve. Visually, assessment of RV size is usually done by comparing RV and LV transverse dimensions in the parasternal short-axis (Fig. 8.21) and apical views (Fig. 8.22). In general, the RV dimensions are one third of the LV dimensions. As the right ventricle dilates, its free wall bulges and in patients with moderate enlargement, RV dimensions are almost equal to those of the left ventricle. RV size is larger than LV size in patients with severe enlargement, with the right ventricle forming the cardiac apex. It is possible to measure RV end-diastolic and end-systolic dimensions and area in the apical four-chamber view; however, caution should be exercised to avoid tangential and foreshortened views. Normal RV dimension at the tricuspid annular level in the apical four-chamber view is less than 4.1 cm.55 RV wall thickness is normally less than 0.5 cm and is most reliably measured by 2D echocardiography in subcostal views at the level of the tricuspid valve chordae tendinae.55 If needed, contrast enhancement may be used. During TEE, RV size can be assessed in the midesophageal four-chamber view.
RV systolic function is estimated qualitatively in clinical practice as normal or mildly, moderately, or severely depressed function. It is also possible to obtain a quantitative measurement of RV systolic function by measuring RV fractional area change (FAC = end-diastolic area − end-systolic area/end-diastolic area) in the apical four-chamber view. This is a simple method with reasonable reproducibility and accuracy, and its normal value ranges to greater than 35%.55 RV Tei index (TR duration − duration of systolic flow through the RV outflow tract/duration of systolic flow through the RV outflow tract) can be calculated as well, but it provides a combined assessment of RV systolic and diastolic function and is prone to various measurement errors.56 The tricuspid annulus motion can provide useful information in patients with suboptimal visualization of RV free wall; normal tricuspid annular plane systolic excursion (TAPSE) is greater than 1.6 cm.55 Additional information may be obtained by TD-derived tricuspid annulus systolic velocity.57,58 Strain and strain rate59 measurements have been applied in a number of diseases that affect the right ventricle, such as congenital heart disease, pulmonary embolism, and idiopathic pulmonary hypertension, and can indicate RV systolic abnormalities even in the presence of normal visual RV function, TAPSE, or FAC. Their routine clinical application, however, awaits additional improvements in the technique to enhance its reproducibility and to show the incremental information provided over 2D imaging and myocardial velocities.
Conditions of RV volume overload (e.g., ASD, severe TR or pulmonary regurgitation) result in diastolic flattening of the interventricular septum, which becomes rounded in systole, but RV pressure overload (primary pulmonary hypertension, acute or chronic thromboembolic disease, cor pulmonale) results in systolic and diastolic flattening of the interventricular septum (“D-shaped ventricle” in systole and diastole; see Fig. 8.21).60 Acute RV dilatation can reduce LV filling through an increase in intrapericardial pressure, which in turn reduces LV transmural filling pressure.61 An acute decline in RV function is usually accompanied by RV dilatation and decrease in RV systolic function in the presence of normal wall thickness. In the setting of an acute coronary syndrome, this may happen as a result of RV ischemia or infarction. The presence of normal/reduced PA pressures along with regional dysfunction can help identify these patients. Patients with chronic RV pressure overload (for example, idiopathic pulmonary hypertension) often exhibit a dilated right ventricle with reduced contractility and increased wall thickness (see Fig. 8.22) in the presence of increased PA pressures and vascular resistance.62
Determining Valvular Function and Dysfunction
Evaluation of Mitral, Tricuspid, and Aortic Regurgitation
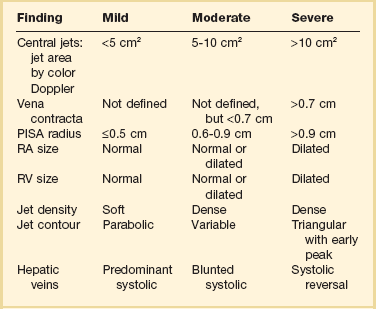
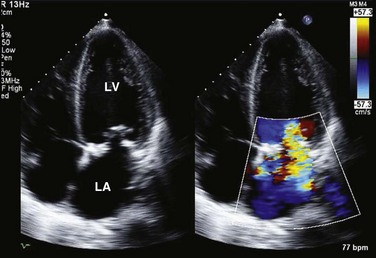
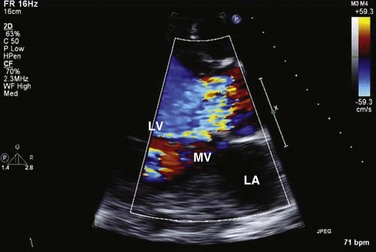
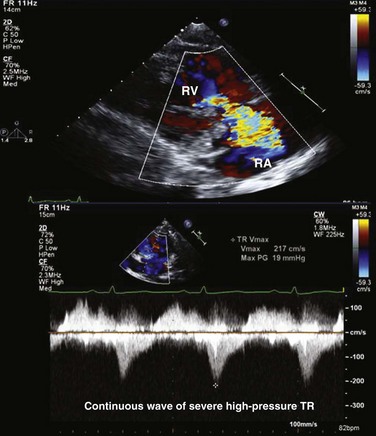
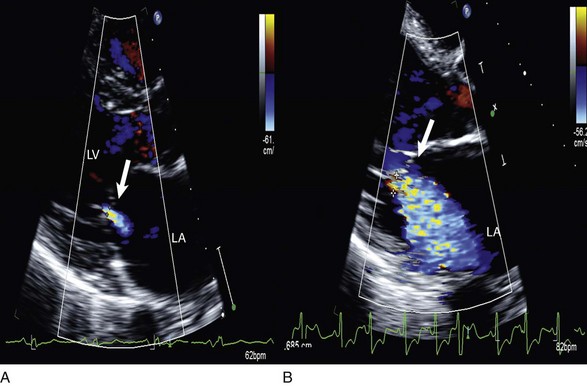
Similar principles apply to the assessment of mitral (MR), tricuspid (TR), and aortic (AR) regurgitation. Pulsed, CW, and color Doppler are useful, when combined, in identifying and accurately grading AR (Table 8.2), MR (Table 8.3), and TR (Table 8.4).63 Echocardiographic assessment of regurgitant valves includes the 2D and comprehensive Doppler imaging in multiple views to identify the direction and size of regurgitant jets. Color Doppler has reasonable accuracy in assessing the severity of MR, TR, or AR when jets are central, although the severity of eccentric jets can be underestimated. In addition, several technical and physiologic factors can affect the size of the jet, irrespective of regurgitant volume, including color gain, pulse repetition frequency, filter settings, and atrial (or aortic)/ventricular pressures. Therefore, it is important to record blood pressures at the time of echocardiography. For MR and TR, the ratio of the jet area to LA or RA area has been used in clinical and research studies to assess these lesions; it is important that the Nyquist limit for color Doppler be greater than 55 cm/second for accurate assessment. For AR, the width of the jet at its origin is related to that of the LVOT to arrive at the ratio that expresses the severity of AR. It is also possible to measure the cross-sectional area of the regurgitant jet by planimetry and relate that to the corresponding area of the LVOT in the short-axis views. Figure 8.23 shows an image of severe MR, Figure 8.24 demonstrates significant posteriorly directed AR, and Figure 8.25 shows severe TR.
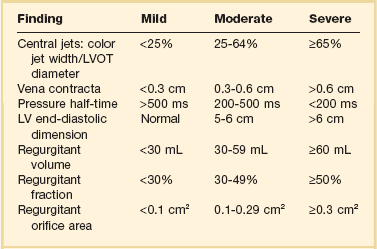
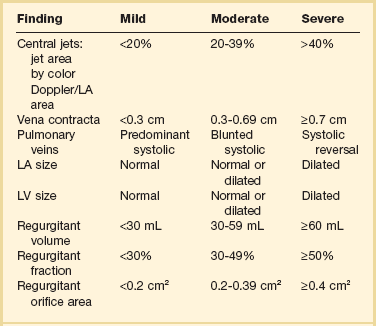
Table 8.4
Echocardiographic Assessment of Tricuspid Regurgitation Severity
PISA, proximal isovelocity surface area; RA, right atrium; RV, right ventricle.
The “vena contracta” of the regurgitant jet, defined as the narrowest area of the jet that occurs at the orifice,64 can be readily imaged and measured. As the regurgitant volume increases, vena contracta width increases (Fig. 8.26). The flow convergence method (proximal isovelocity surface area, or PISA, method) is a quantitative approach that can measure the regurgitant volume and the effective regurgitant orifice (ERO) area. Color flow mapping enables the visualization of the concentric hemispheres of flow as they approach the ERO (Fig. 8.27). The ERO area is calculated as:
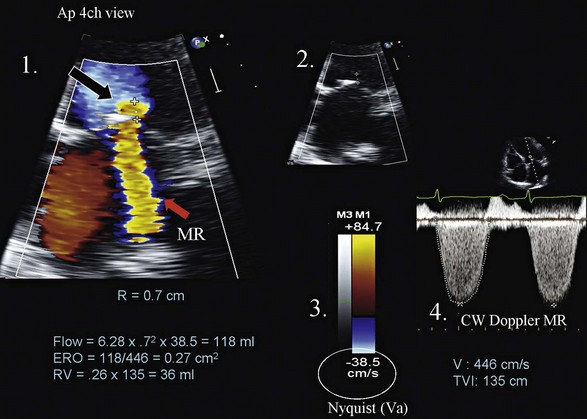

where Va is the aliasing velocity, r is the maximal radius of the PISA, and Vpeak is the peak velocity of the regurgitant signal by CW Doppler65 (Fig. 8.27). This method is most reliable when jets are centrally located and the regurgitant orifice is adequately visualized.
The CW signal can provide useful information, as the brightness of these signals—in comparison with antegrade flow—increases with increasing severity of regurgitation. For patients with MR or TR who have severe lesions and a rapid rise in LA or RA pressure resulting in a large regurgitant “V” wave, early systolic peaking is seen (see Fig. 8.25, lower panel). For AR, the deceleration time (pressure half-time = 0.29 × deceleration time) of the AR spectral Doppler signal is related to the rate at which aortic and LV pressures equilibrate in diastole, such that patients with hemodynamically significant lesions exhibit a rapid rise in LV diastolic pressure, leading to steep deceleration of AR velocity signal. In general, severe AR correlates with pressure half-time less than 250 ms, and mild AR with pressure half-time greater than 500 ms.63 The pressure half-time is most reliable in cases with acute AR and may be prolonged in patients with chronic severe AR due to a concomitant increase in LV compliance (Fig. 8.28). For MR and TR, peak early diastolic filling velocity by PW (peak E-velocity) is increased in the setting of significant regurgitation because of the increased transvalvular flow generated by the regurgitant volume; in severe MR, a peak E velocity greater than 1.2 m/second is usually present. In addition, pulmonary and hepatic venous flow will show systolic reversal of flow in severe MR or TR, respectively, corresponding to the large regurgitant “V” wave in atrial pressure. In hemodynamically significant AR, diastolic flow reversal is noticed in the descending aorta. Normally, no (or only a minimal amount) flow reversal is seen in the descending aorta in early diastole. In patients with severe AR, holodiastolic flow reversal is observed.
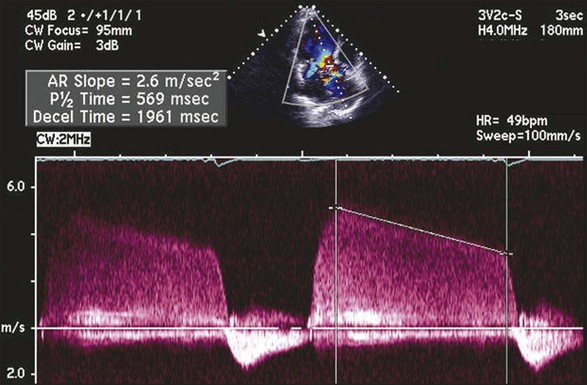
 time) of the continuous wave spectral Doppler of aortic regurgitation.
In arriving at final conclusions, it is important to integrate all the findings obtained by 2D and Doppler.63 For example, patients with chronic severe regurgitant lesions usually have dilatation of their cardiac chambers (for MR, LA and LV; for TR, right atrial [RA] and RV; for AR: LV) along with a large regurgitant volume. If the quality of the transthoracic images precludes the assessment of valvular disease, or the severity of MR or AR, it is reasonable to proceed to TEE. All of the preceding methods can be applied for the quantification of regurgitant lesions imaged by TEE. However, with respect to MR assessment by TEE, given the proximity of the TEE probe to the left atrium, MR jet area can be larger than that acquired by transthoracic imaging. In addition, TEE can provide unique information that is essential for successful mitral valve repair.
Evaluation of Aortic Stenosis
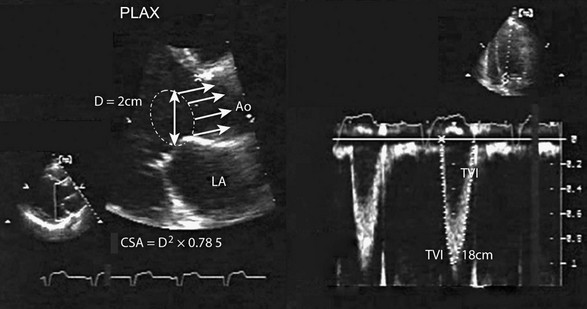
Patients with aortic stenosis (AS) have abnormally thickened or calcified valve leaflets along with reduced leaflet excursion, as seen by 2D echocardiography (Fig. 8.29).66 In patients older than 70 years of age, the most common cause is degeneration of a trileaflet valve, although in patients younger than 70 years old, the most common cause is bicuspid aortic valve. In addition to morphologic changes of the aortic valve, 2D imaging is needed to determine LV dimensions, wall thickness, and EF. Such data are essential to assess the impact of AS on LV function, which is needed as part of the routine evaluation of patients with this disease. AS severity is assessed most reliably by the mean transvalvular systolic pressure gradient across the aortic valve and by the valve area, both of which are measured by Doppler echocardiography. Using the modified Bernoulli equation (ΔP = 4v2), the peak and mean gradients across the aortic valve can be calculated from the CW Doppler signal. An excellent correlation was observed between invasive and Doppler measurements of mean gradient when both measurements were simultaneously obtained.67 However, several technical requirements are needed, including parallel alignment of the ultrasound beam with aortic flow and the use of multiple imaging windows (apical, right parasternal, subcostal, and suprasternal). Patients with a mild degree of AS may develop increased velocity and gradient when the transvalvular flow rate is increased, whether because of AR or the development of a hyperdynamic state; however, in this case the valve area will reflect the mild severity. Likewise, patients with severe AS may have lower than expected gradients with significantly depressed EF (Fig. 8.30), severe MR, severe RV dysfunction, severe TR, or intravascular volume depletion; again, in such cases, AV area is very useful to put the gradients in context of the stroke volume.
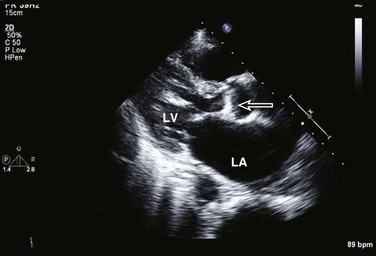
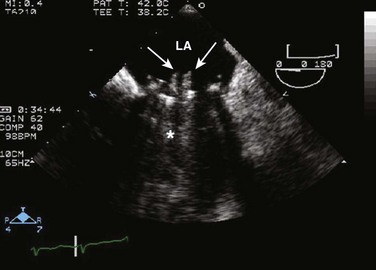
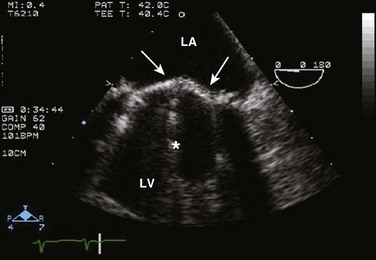
Figure 8.29 Two-dimensional image of calcific aortic stenosis (arrow). LA, left atrium; LV, left ventricle.
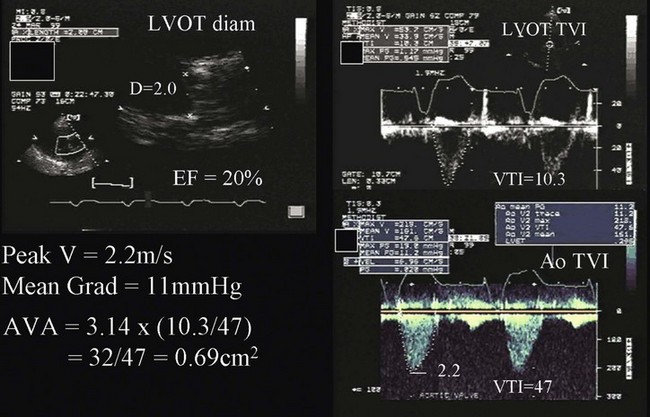
Aortic valve area is calculated using the continuity equation. The underlying principle is that the amount of blood flow through the LVOT and aortic valve will be the same because they are in continuity.68 Aortic valve area (in cm2) is given by systolic flow through LVOT/time velocity integral (TVI) of AS signal by CW (LVOT diameter2 × 0.785 × LVOT TVI/aortic TVI) (see Fig. 8.30). The main source of error in this calculation is in the measurement of the LVOT diameter. However, when there is doubt, and in the absence of other significant valvular lesions, it is possible to use systolic flow through the RV outflow tract or diastolic mitral inflow in the numerator. Alternatively, LV stroke volume measured by 2D echocardiography (difference between end-diastolic and end-systolic volumes) may be used, provided adequate 2D images are present.
Some patients with severely depressed EF have only mildly or modestly elevated transvalvular gradients across the aortic valve, yet significant AS when the valve area is calculated (typically <1 cm2, see Fig. 8.30). It is reasonable to proceed to low dose (up to 20 µg/kg/minute) dobutamine echocardiography in these patients to assess not only LV contractile reserve but also the effect of increased transvalvular flow on the calculated aortic valve area.69 Patients with dobutamine-induced increase in aortic valve area (>1 cm2) are unlikely to have real AS, but their reduced valve area is largely the result of reduced flow rate. On the other hand, when there is an increase in gradient but still a severely reduced aortic valve area, valvular surgery should be considered because LV function and clinical status are likely to improve after valve replacement.
Evaluation of Mitral Stenosis
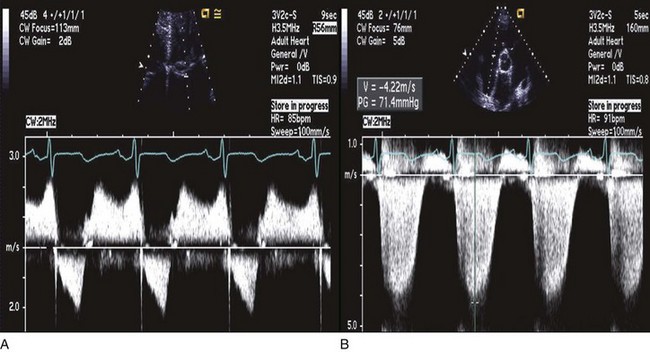
In patients with rheumatic mitral stenosis, 2D imaging shows the presence of valvular thickening and calcification along with abnormal leaflet mobility, such that there is doming of the anterior mitral leaflet along with reduced mobility of the posterior leaflet.66 The anterior leaflet has a classic “hockey-stick” deformity when viewed in the parasternal long-axis and apical views (Figs. 8.31), and variable degrees of calcification, thickening, and subvalvular disease may be present. Direct planimetry of the mitral valve area is feasible in cases in which the mitral valve orifice is well visualized in the parasternal short-axis view. However, this measurement can be inaccurate when there is extensive calcification of valve leaflets, and when the short-axis plane is not positioned correctly at the level of valve tips. Color Doppler shows the PISA hemispheres on the LA side of the mitral valve during diastole (Fig. 8.32). Spectral Doppler can provide reliable transmitral pressure gradients and mitral valve area in most patients with mitral stenosis, as well as the hemodynamic impact on the right side of the heart with development of pulmonary hypertension (see Fig 8.33). The current ultrasound systems have the capability to measure online peak and mean transvalvular gradients, using the modified Bernoulli equation (see earlier). Doppler-derived gradients have been shown to have excellent reproducibility and accuracy when compared to the simultaneously obtained LA-LV pressure gradient by cardiac catheterization. However, the transmitral pressure gradient is dependent on many variables other than the valve area. Therefore, the mean gradient can be increased with high transvalvular flow rate (whether because of a hyperdynamic flow state or MR), or short RR interval, even though mitral stenosis is only of a mild degree.
Mitral valve area is most easily calculated by Doppler, using the pressure half-time method. This method was originally conceived in the cardiac catheterization laboratory.70 The severity of the stenosis is judged based on the time needed for the transmitral pressure gradient to decrease by 50% from its initial value in early diastole. This time increases with the severity of the stenosis, and mitral valve area (in cm2) can be derived as 220/pressure half-time (in ms). Although simple and highly reproducible, its accuracy is limited in patients with abnormal LA or LV compliance, and those with significant AR.71 The continuity equation is an additional method that is applicable in cases without significant AR and MR. In this method, the mitral valve area is calculated by systolic flow through the LVOT/TVI of mitral stenosis jet by CW.
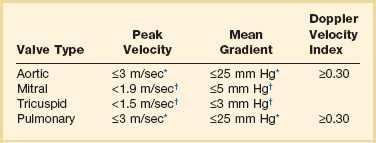
Evaluation of Prosthetic Valves
Echocardiography is the test of choice to assess prosthetic valve function.72–74 From transthoracic windows, it is possible to identify the type of prosthetic valve, whether tissue or mechanical, the latter producing significant prosthetic echo artifact (Figs. 8.34 and 8.35). In some cases, large vegetations (Fig. 8.36) or thrombi may be visualized. However, in many situations of suspected prosthetic valve disease, TEE is needed because TTE images, especially with mechanical valves, can be obscured by echo artifact. Reliable recording of transvalvular gradients is possible by Doppler in almost all cases, provided the ultrasound beam is parallel to the direction of flow. Prosthetic valve gradients should be interpreted with the knowledge of the valve type, size, and position, as values vary depending on these variables (Table 8.5). Furthermore, consideration should be given to stroke volume/ventricular function/heart rate when conclusions are drawn about prosthetic valve function. It is very useful to compare Doppler-derived gradients to previous results (taking into consideration both flow and heart rates) in detecting possible changes in prosthetic valve function over time. For prosthetic aortic valves, the Doppler velocity index is calculated as peak velocity in LVOT/peak velocity across the valve by CW Doppler. Patients with normal function have a ratio that is 0.25 or greater. This ratio is particularly helpful in patients with increased transvalvular flow rate leading to increased mean gradient, as they will also have an increased flow velocity in the LVOT and therefore a normal Doppler velocity index.75 Prosthetic mitral valves are best assessed by mean gradient, taking into account heart rate, as the faster the heart rate, the higher the gradient. In general, a mean prosthetic mitral gradient at a heart rate of 60 to 70 beats per minute should be less than 5 mm Hg in a normally functioning mitral prosthesis (Fig. 8.37). When there is doubt about structural or functional abnormalities of prosthetic valves, TEE should be considered. Complications of prosthetic valve endocarditis such as abscess are readily assessed by TEE (Fig. 8.38). A pannus or thrombus may result in reduced or absent leaflet motion and prosthetic valve stenosis. Depending on the thrombus burden and the clinical status of a given patient, TTE and TEE may be used to guide and follow the response to intravenous thrombolytic therapy. Although the severity and cause of prosthetic valve regurgitation may not be easily determined by TTE because of acoustic shadowing, TEE is extremely useful in evaluating the degree of regurgitation and in identifying the site of origin and direction of perivalvular leaks. Unlike prosthetic mitral valves, adequate visualization and Doppler interrogation of prosthetic aortic valves can be challenging by TEE. Therefore, if doubt remains, one should consider biplane fluoroscopy to assess the mobility of aortic valve discs. Normal Doppler values for prosthetic valves in the aortic, mitral, tricuspid, and pulmonary positions are shown in Table 8.5.
Pericardial Disease
The detection of pericardial effusion generated much of the early interest in ultrasound as a useful cardiac diagnostic tool.76 Today, echocardiography is routinely used to diagnose and manage pericardial disease. Pericardial effusion, tamponade, and, to a lesser extent, pericardial constriction, can be readily and reliably assessed with echocardiography.
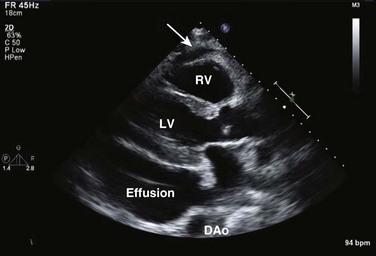
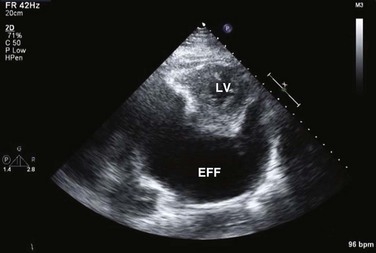
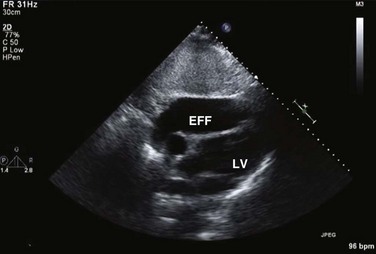
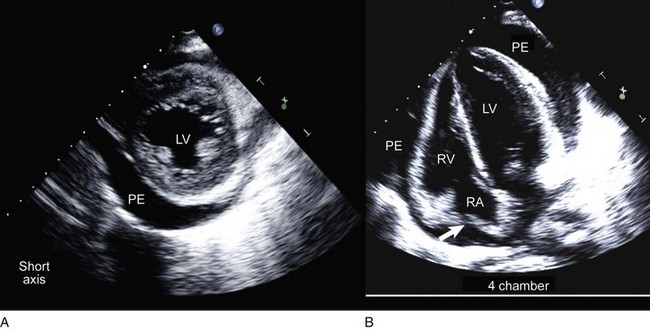
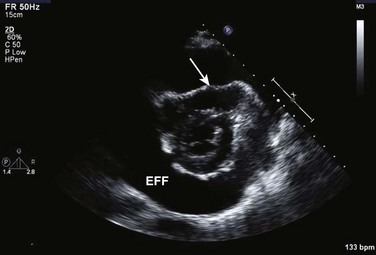
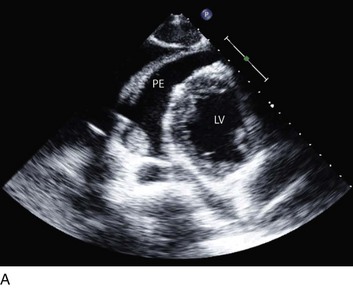
On 2D echocardiography, findings of pericardial effusion include an echo-free space adjacent to the heart as well as absence of pericardial motion (Fig. 8.39). Effusions are termed small, moderate, and large (Fig. 8.40) based on the visually estimated volume of fluid, its location (posterior only or circumferential), and the size of the heart relative to the size of the fluid space. The subcostal view is particularly useful for identifying pericardial effusions (Fig. 8.41). Large effusions may occasionally result in “swinging” of the heart within the pericardial space, a phenomenon that correlates with the electrical alternans noted on the ECG.77 Loculated pericardial effusions can be identified in patients after cardiac surgery and in patients who sustain chest trauma. In these circumstances, the effusion is localized to a single area of the pericardial space. It is important to note that rapid development of a relatively small volume of fluid in a critical location may quickly result in hemodynamic compromise. Relatively small, localized hematoma in patients after cardiac surgery, percutaneous intervention, electrophysiology study, or trauma can create a compressive effect that compromises cardiac hemodynamics (Fig. 8.42).
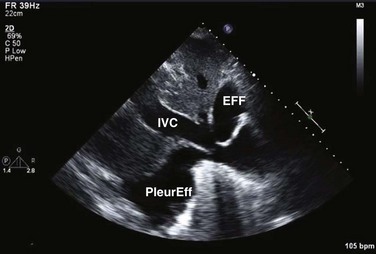
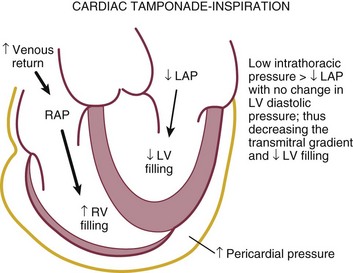
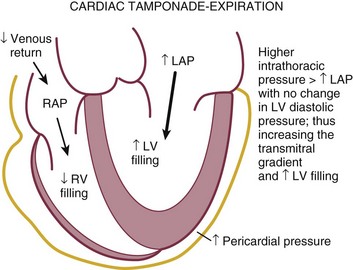
Pericardial tamponade occurs when, in the presence of fluid accumulating in the pericardial space, the pressure in the pericardium exceeds the pressure in the cardiac chambers, resulting in impaired filling and reduction of stroke volume and cardiac output, eventuating tachycardia, hypotension, and jugular venous distention.78 The physiologic consequences depend on the amount of fluid, the rate of accumulation, the distensibility of the pericardium, and the compliance of cardiac chambers.79 Tamponade may result from accumulation of fluid, pus, blood, clots, or gas within the pericardium. There are several echocardiographic features of pericardial tamponade. Pericardial effusion, usually at least moderate in volume, must be present (unless acute as described earlier). As the pressure within the pericardium increases, cardiac chamber collapse will ensue.80 Impairment of filling is sequential: The atria will collapse before the higher pressure ventricles.81 The compressive effect of fluid is seen when the pressure is lowest in the chamber; RA collapse begins in late ventricular diastole (before or at the P wave) and should persist through at least one third of ventricular systole (Fig. 8.43). RA collapse occurs early in the course of tamponade but is a less specific marker than collapse of the right ventricle because the thin-walled right atrium can invert in the absence of tamponade when there is intravascular volume depletion. RV collapse occurs in early diastole.82 This finding will manifest later in the continuum but is more specific for significant hemodynamic compromise.83 RV collapse is best appreciated when the ultrasound beam is perpendicular to the RV outflow tract from subcostal or parasternal views (Fig. 8.44). Timing of the onset and duration of RV collapse can be appreciated with M-mode (Fig. 8.45). Right-sided chamber collapse may be absent when tamponade occurs in the setting of severely elevated right-sided filling pressures (pulmonary hypertension).84 When the effusion is loculated behind the left ventricle in the setting of reduced LV volumes, as might be seen in postoperative patients, diastolic collapse of the LV may be the only indicator of hemodynamic compromise. A dilated inferior vena cava (IVC) that does not change dimension with respiration is also consistent with elevated intrapericardial pressures (Fig. 8.46), although this finding is nonspecific in intubated patients owing to positive intrathoracic pressures.
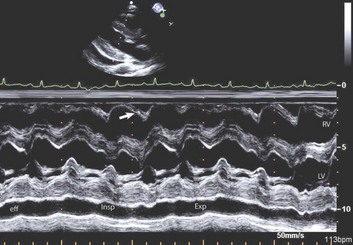
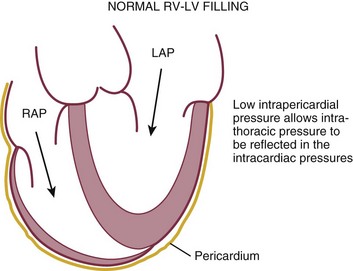
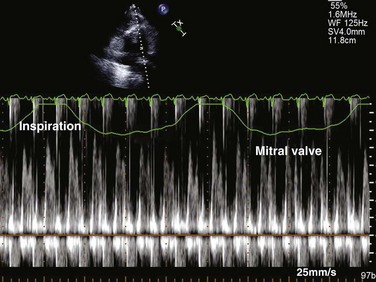
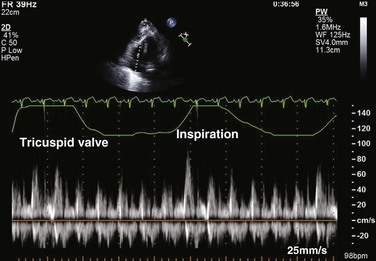
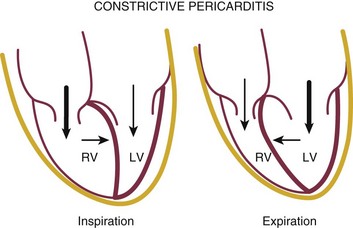
Reciprocal respiratory changes in RV and LV volumes become evident in tamponade, and increased right heart filling occurs at the expense of left heart filling in a process mediated by the pericardium. RV volume increases with inspiration, shifting the septum toward the left ventricle in diastole and toward the right ventricle in systole. RV volume decreases with expiration, normalizing septal motion as LV filling increases (Figs. 8.47 to 8.49). These findings correspond to the clinical finding of pulsus paradoxus. Transvalvular Doppler flow velocities demonstrate respirophasic changes in tamponade as well.85 Initial transmitral velocities are enhanced with expiration and diminished (>25%) with inspiration in tamponade; transtricuspid flow augments with inspiration and diminishes with expiration (Figs. 8.50 and 8.51). Correspondingly, the RV outflow TVI increases with inspiration while the LV outflow TVI decreases. These are useful findings but can be difficult to demonstrate with precision in the acutely ill patient.
Echocardiography has been used to guide the percutaneous drainage of pericardial fluid.86 Subcostal imaging is valuable in demonstrating the amount of inferior fluid in the typical location accessed by the subxiphoid needle approach, as well as determining the optimal site of puncture. Imaging from the cardiac apex in patients with large circumferential effusions can aid in determining needle position and guide advancement, although identifying the needle tip can occasionally be problematic. Once needle position is deemed appropriate and initial aspirate is obtained, an injection of a small amount of agitated saline confirms correct needle position within the pericardium87 (Fig. 8.52).
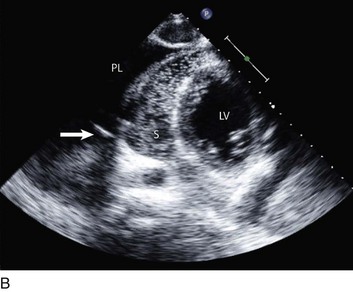
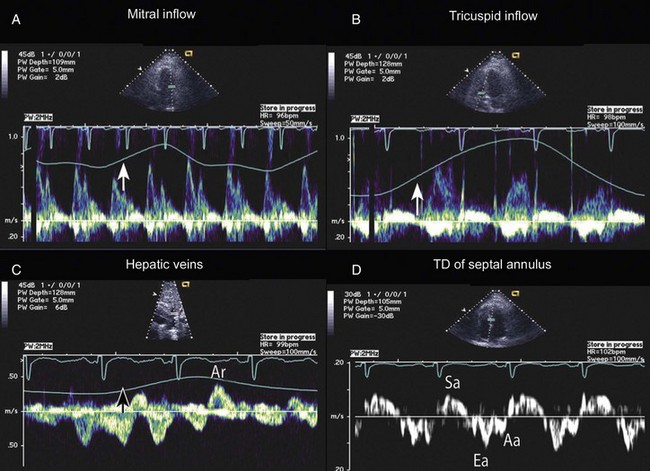
Constrictive physiology is present when the visceral and parietal layers of the pericardium become adherent and fibrotic, resulting in marked impairment of LV filling. Chronic constrictive pericarditis is usually not associated with free pericardial fluid. The echocardiographic findings in constriction include a thickened pericardium (pericardial thickening may not be uniform); normal LV size with LA dilatation; abrupt termination of ventricular filling in early diastole (best seen on M-mode); interventricular septal motion demonstrating a diastolic inward “bounce” in early diastole; and dilatation of the IVC. In addition, there is Doppler flow evidence of ventricular interaction with exaggerated respirophasic changes in transvalvular velocities, and dilated and plethoric IVC, like those seen in tamponade (Figs. 8.47 to 8.49, 8.53). Tissue Doppler imaging (TDI) evaluation of diastolic filling is useful in distinguishing between pericardial constriction and restrictive cardiomyopathy, as there is commonly substantial overlap of spectral Doppler findings in these entities because both share features of limited or restrictive ventricular diastolic filling. Data suggest that the mitral annulus early diastolic velocity (Ea) by TDI is usually higher in patients with constrictive pericarditis (Fig. 8.54) than in those with primary restrictive cardiomyopathy, as the rate of LV relaxation is impaired in patients with restrictive cardiomyopathy.88,89
Aortic Disease
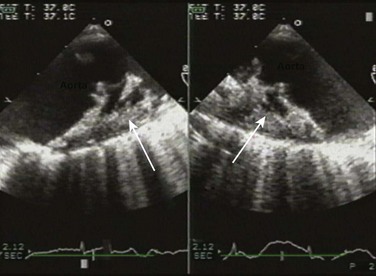
Although TEE is the preferred method for evaluating the aorta, transthoracic imaging can visualize the proximal ascending aorta and can occasionally identify an intimal flap from aortic dissection (Fig. 8.55), either from the parasternal views or from the suprasternal notch. In addition, TTE can evaluate the integrity of the aortic valve and quantify the degree of AR; can recognize any LV wall motion abnormalities (but in this setting TTE cannot distinguish between primary ischemia and ischemia secondary to coronary extension of the dissecting flap); and can identify any associated pericardial effusion. It is important to note that, as seen in aortic aneurysms, patients with dissection very often have significant aortic dilation; thus, lack of aortic dilation may argue against dissection. However, overall, the sensitivity of TTE for the diagnosis of dissection in the aortic arch and descending aorta is low, and TEE (or other modalities such as computed tomography [CT] scanning) is often indicated. The close proximity of the esophagus to the aorta makes TEE the superior modality for the evaluation of aortic dissection, with both sensitivity and specificity of 98%.90–94 The ascending aorta, aortic arch, and descending thoracic aorta can be visualized with excellent resolution. TEE can be performed rapidly and safely at the bedside. Particular attention must be given to ensuring adequate sedation to avoid hypertension, tachycardia, or gagging in patients with suspected dissection. Common features of dissection on TEE imaging include:
• An intimal flap that moves toward the false lumen in systole (Fig. 8.56)
• Color Doppler flow in both the true and the false lumens
• Color flow identification of entry/exit sites
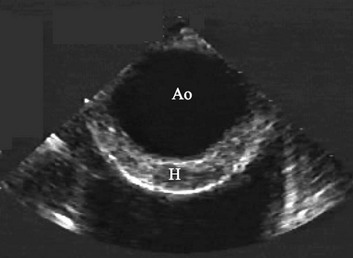
IMH, originally described as bleeding into the outer layers of the aortic media due to rupture of the vaso vasorum without a primary tear, appears as crescentic thickening of the aortic wall greater than 0.7 cm in the absence of a frank dissection flap (Fig. 8.57).95 Considered a variant of overt aortic dissection, IMH is an important diagnosis to make, as data suggest IMH is a lethal condition when it involves the ascending aorta, and 16% of patients with IMH have evidence of evolution to classic aortic dissection on serial imaging.96,97
TEE is also very useful for identifying aortic atherosclerotic plaque (Fig. 8.58) in patients with systemic embolism (particularly stroke), as described in more detail subsequently.
Cardiac Trauma
Blunt cardiac trauma occurs in the presence of evidence of external thoracic impact, such as chest wall contusions, hematomas, and fractured ribs/sternum, which is distinguished from great vessel trauma that can occur in rapid deceleration injuries. Virtually any cardiac structure can be impacted by blunt thoracic trauma and can result in significant risk of morbidity and death. Cardiac contusion is a common result of blunt thoracic trauma and is echocardiographically characterized by mainly RV—but also LV—global or regional dysfunction. Valve disruption with severe valvular regurgitation can occur; the most common valves to be disrupted are the tricuspid and mitral valves, respectively.98 For cases of cardiac contusion, troponin levels can be helpful as negative serial troponins can argue against significant cardiac contusions.99 Penetrating cardiac trauma is most often the result of bullet or knife penetration to the thorax but can occur from a variety of accidents. Echocardiographically, the most common manifestations of penetrating cardiac injuries are pericardial effusion/tamponade, although projectiles can at times be seen on echocardiography of the cardiac chambers. Although echocardiography has a vital role in the diagnosis and management of cardiac trauma, other imaging modalities such as radiography, CT, and magnetic resonance imaging (MRI) play important roles.
TEE is quite useful in the evaluation of the aorta following blunt injury, usually a result of high-speed deceleration accidents.100,101 Traumatic disruption of the aorta usually involves the region of the aortic isthmus, the aortic segment between the left subclavian and the first intercostal arteries. Blunt injuries that can be identified by TEE include the more minor localized hematoma, limited intimal flaps, and mural thrombus (injuries not requiring surgical intervention), and the significant subadventitial rupture or complete transsection (injuries that require urgent surgical intervention). Subadventitial disruption commonly demonstrates a localized “thick medial flap” on TEE in association with significant change in the contour of the isthmus, or complete rupture with pseudoaneurysm formation can be seen.
Intracardiac Shunts
Intracardiac shunts are either congenital (for example, ASD, VSD, PFO) or can be acquired, often in the setting of acute myocardial infarction (infarct-related VSD) or at times in the presence of penetrating cardiac trauma. From the critical care perspective, the important manifestations of cardiac shunts are heart failure and pulmonary hypertension from longstanding congenital lesions (for example, large ASD), stroke from right-to-left shunting in the presence of deep venous thrombosis, and persistent hypoxia resistant to oxygen therapy in the setting of right-to-left shunting. Although the discussion of congenital cardiac shunts is beyond the scope of this chapter,102 any patient with history of cardiac surgery/intervention as a child or young adult should undergo echocardiography in the critical care setting to assess for congenital lesions, as should cyanotic or hypoxic individuals without such a history who are in critical care. Because paradoxic embolism—from the deep venous system into the vena cava, then right atrium and across into the left side of the heart—can cause embolic stroke, patients with stroke in critical care should, in the right clinical setting, be assessed for intracardiac shunt.103 This is performed using color Doppler imaging of the interatrial septum, and if negative, followed by agitated saline contrast injection into the systemic veins, as described earlier. For patients in critical care with persistent hypoxia without obvious cause, right-to-left intracardiac shunting of deoxygenated blood can at times be the cause. In such scenarios, color Doppler interrogation including saline contrast injection under echocardiographic guidance as described previously can be of great utility (see Fig. 8.3).
Hemodynamic Assessment
It is possible to calculate blood flow at several levels in the heart and aorta using Doppler echocardiography.104 Such measurements of flow can be very useful in the ICU setting to derive LV stroke volume, cardiac output, regurgitant volumes of MR and AR, flow across an ASD or VSD, valve areas (by continuity principle), and the response to therapeutic measures such as intravenous administration of inotropic drugs or the effect of an intra-aortic balloon pump on systemic output. Stroke volume in mL (or cm3) is calculated as the product of the cross-sectional area (cm2) of the LVOT and the TVI (cm) by PW Doppler (Fig. 8.59) at this site.105,106 Cardiac output can then be calculated as the product of stroke volume and heart rate. A number of studies have shown good accuracy of Doppler echocardiography when compared against measurements derived by thermodilution, including data obtained from patients in the ICU. Doppler-derived stroke volume can provide important clues in situations of reduced output (be it due to volume depletion or LV systolic dysfunction) as well as cases of high-output states such as sepsis and liver failure.
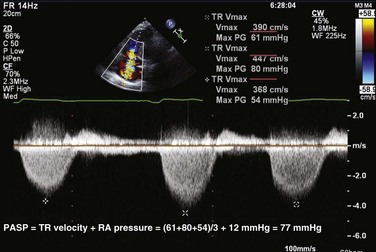
Peak PA systolic pressure is calculated from the peak Doppler velocity (v) of TR by CW (Fig. 8.60). Using the modified Bernoulli equation, the peak systolic gradient (ΔP) in mm Hg between the right ventricle and the right atrium is given by 4v2 (where v is in m/second). An estimate of RA pressure is then added to ΔP to estimate peak RV systolic pressure, and in the absence of pulmonary stenosis, peak PA systolic pressure.107 RA pressure can be estimated from the change in IVC diameter with spontaneous breathing, as recorded from subcostal views. Normal variation or collapse of the IVC with breathing (>50%) implies normal RA pressure (0-5 mm Hg). Partial collapse (<50%) is generally estimated at 5 to 10 mm Hg, whereas no (or only minimal) change in IVC diameter implies an RA pressure of 15 mm Hg or more. When available, RA pressure can be obtained directly from a central venous pressure tracing, which is more accurate. In addition, hepatic venous flow may be used, particularly in patients on mechanical ventilation. Similar to pulmonary venous flow, a high RA pressure is associated with decreased RA filling from the hepatic veins during systole and increased filling during diastole (small S wave, large D wave). This measurement has been shown to have a good correlation with invasively measured RA pressure.108
Stroke and Other Systemic Emboli
From 17% to 25% of all strokes are cardioembolic in origin.109 Echocardiography, particularly TEE, is commonly used to search for potential cardiac sources of arterial emboli, the most common of which are atrial fibrillation (AF) with LA appendage thrombus, primary or metastatic LA tumor (see Fig. 8.61), atheromatous disease of the aorta (see Fig. 8.58), LV apical thrombus (see Fig. 8.13), and PFO with/without atrial septal aneurysm (ASA).110,111 Although color Doppler may occasionally demonstrate a right-to-left shunt at the atrial level, injection of agitated saline in this setting is particularly useful in determining right-to-left bubble crossover (see Fig. 8.3). AF predisposes to thrombus formation in the body of the left atrium and in the LA appendage. Although transthoracic imaging can identify abnormalities that predispose to AF, such as mitral stenosis, TEE is necessary for a thorough assessment of the body of the left atrium and of the LA appendage, which is the most common site of thrombus formation in AF.112,113 A significant association exists between aortic atheroma and stroke.114 TEE reliably identifies aortic debris and can determine location, morphologic characteristics, and mobility of identified lesions (see Fig. 8.58).113–115 The most common disorders associated with stroke identified by echocardiography are listed in Box 8.3.
References
1. Physics and instrumentation. In: Feigenbaum H, Armstrong W, Ryan T, eds. Feingenbaum’s Echocardiography. 6th ed. Philadelphia: Lippincott, Williams & Wilkins; 2005:11–44.
2. Otto, C. Principles of echocardiographic image acquisition and doppler analysis. In: Otto C, ed. Textbook of Clinical Echocardiography. 3rd ed. Philadelphia: Elsevier; 2004:1–29.
3. Christensen, AE, Tobiassen, M, Jensen, TK, et al. Cross sectional echocardiographic examination. In: Weyman AE, ed. Principles and Practice of Echocardiography. 2nd ed. Philadelphia: Lea & Febiger; 1994:75–123.
4. Ultrasound physics. In: Edelman SK, ed. Understanding Ultrasound Physics. 3rd ed. Houston: ESP Inc. ; 2007:16–47.
5. Van de Veire, NR, De Sutter, J, Bax, JJ, Roelandt, JR. Technological advances in tissue Doppler imaging echocardiography. Heart. 2008; 94(8):1065–1074.
6. Guarracino, F, Baldassarri, R. Transoesophageal echocardiography in the OR and ICU. Minerva Anestesiol. 2009; 75(9):518–529.
7. Beaulieu, Y, Marik, P. Bedside ultrasonography in the ICU. Part 1 and Part 2. Part 1: Chest 2005;128:881-895. Part 2: Chest. 2005; 128:1766–1781.
8. Lam, YY, Yu, CM, Zhang, Q, et al. Enhanced detection of patent foramen ovale by systematic transthoracic saline contrast echocardiography. Int J Cardiol. 2011; 152(1):24–27.
9. Kaufmann, BA, Wei, K, Lindner, J. Contrast echocardiography. Curr Probl Cardiol. 2007; 32(2):51–96.
10. Platts, DG, Fraser, JF. Contrast echocardiography in critical care: Echoes of the future? A review of the role of microsphere contrast echocardiography. Crit Care Resuscitation. 2011; 13(1):44–55.
11. Senior, R, Becher, H, Monaghan, M, et al. Contrast echocardiography: Evidence-based recommendations by European Association of Echocardiography. Eur J Echocardiogr. 2009; 10(2):194–212.
12. Reilly, JP, Tunick, P, Timmermans, RJ, et al. Contrast echocardiography clarifies uninterpretable wall motion in intensive care unit patients. J Am Coll Cardiol. 2000; 35:485–490.
13. Yong, Y, Fernandes, V, Wu, D, et al. Diagnostic accuracy and cost-effectiveness of contrast echocardiography on evaluation of cardiac function in technically very difficult patients in the intensive care unit. Am J Cardiol. 2002; 89:711–718.
14. Costa, JM, Tsutsui, JM, Nozawa, E, et al. Contrast echocardiography can save nondiagnostic exams in mechanically ventilated patients. Echocardiography. 2005; 22(5):389–394.
15. Prinz, C, Voigt, JU. Diagnostic accuracy of a hand-held ultrasound scanner in routine patients referred for echocardiography. J Am Soc Echocardiogr. 2011; 24(2):111–116.
16. Melamed, R, Sprenkle, MD, Ulstad, VK, et al. Assessment of left ventricular function by intensivists using hand-held echocardiography. Chest. 2009; 135(6):1416–1420.
17. Vignon, P, Dugard, A, Abraham, J, et al. Focused training for goal-oriented hand-held echocardiography performed by noncardiologist residents in the intensive care unit. Intensive Care Med. 2007; 33(10):1795–1799.
18. Seward, JB, Douglas, PS, Erbel, R, et al. Hand-carried cardiac ultrasound (HCU) device: Recommendations regarding new technology. A report from the echocardiography task force on new technology of the nomenclature and standards committee of the American Society of Echocardiography. J Am Soc Echocardiogr. 2002; 15:369–373.
19. Spevack, DM, Tunick, PA, Kronzon, I. Hand carried echocardiography in the critical care setting. Echocardiography. 2003; 20(5):455–461.
20. de Groot-de Laat, LE, ten Cate, FJ, Vourvouri, EC, et al. Impact of hand-carried cardiac ultrasound on diagnosis and management during cardiac consultation rounds. Eur J Echocardiogr. 2005; 6:196–201.
21. Hellmann, DB, Whiting-O’Keefe, Q, Shapiro, EP, et al. The rate at which residents learn to use hand-held echocardiography at the bedside. Am J Med. 2005; 118:1010–1018.
22. Spurney, CF, Sable, CA, Berger, JT, et al. Use of a hand-carried ultrasound device by critical care physicians for the diagnosis of pericardial effusions, decreased cardiac function, and left ventricular enlargement in pediatric patients. J Am Soc Echocardiogr. 2005; 18:313–319.
23. Manasia, AR, Nagaraj, HM, Kodali, RB, et al. Feasibility and potential clinical utility of goal-directed transthoracic echocardiography performed by noncardiologist intensivists using a small hand-carried device in critically ill patients. J Cardiothorac Vasc Anesth. 2005; 19(2):155–159.
24. Lang, RM, Bierig, M, Devereux, RB, et al. Recommendations for chamber quantification: A report from the American Society of Echocardiography’s Guidelines and Standards Committee and the Chamber Quantification Writing Group, developed in conjunction with the European Association of Echocardiography, a branch of the European Society of Cardiology. J Am Soc Echocardiogr. 2005; 18(12):1440–1463.
25. St John Sutton, MG, Plappert, T, Rahmouni, H. Assessment of left ventricular systolic function by echocardiography. Heart Fail Clin. 2009; 5(2):177–190.
26. Blondheim, DS, Beeri, R, Feinberg, MS, et al. Reliability of visual assessment of global and segmental left ventricular function: A multicenter study by the Israeli Echocardiography Research Group. J Am Soc Echocardiogr. 2010; 23(3):258–264.
27. Abraham, TP, Dimaano, VL, Liang, HY. Role of tissue Doppler and strain echocardiography in current clinical practice. Circulation. 2007; 116(22):2597–2609.
28. Sanderson, JE, Fraser, AG. Systolic dysfunction in heart failure with a normal ejection fraction: Echo-Doppler measurements. Prog Cardiovasc Dis. 2006; 49(3):196–206.
29. Ruan, Q, Nagueh, SF. Usefulness of isovolumic and systolic ejection signals by tissue Doppler for the assessment of left ventricular systolic function in ischemic or idiopathic dilated cardiomyopathy. Am J Cardiol. 2006; 97:872–875.
30. Blessberger, H, Binder, T. Two dimensional speckle tracking echocardiography: Clinical applications. Heart. 2010; 96(24):2032–2040.
31. Nesbitt, GC, Mankad, S, Oh, JK. Strain imaging in echocardiography: Methods and clinical applications. Int J Cardiovasc Imaging. 2009; 25(Suppl 1):9–22.
32. Dokainish, H, Sengupta, R, Pillai, M, et al. Assessment of left ventricular systolic function using echocardiography in patients with preserved ejection fraction and elevated diastolic pressures. Am J Cardiol. 2008; 101:1766–1771.
33. Nguyen, JS, Lakkis, NM, Bobek, J, et al. Systolic and diastolic myocardial mechanics in patients with cardiac disease and preserved ejection fraction: Impact of left ventricular filling pressure. J Am Soc Echocardiogr. 2010; 23(12):1273–1280.
34. Nishimura, RA, Tajik, AJ. Evaluation of diastolic filling of the left ventricle in health and disease Doppler echocardiography is the clinician’s Rosetta Stone. J Am Coll Cardiol. 1997; 30:8–18.
35. Oh, JK. Echocardiography as a noninvasive Swan-Ganz catheter. Circulation. 2005; 111:3192–3194.
36. Oh, JK, Appleton, CP, Hatle, L, et al. The noninvasive assessment of left ventricular diastolic function with two-dimensional and Doppler echocardiography. J Am Soc Echocardiogr. 1997; 10:246–270.
37. Nagueh, SF, Appleton, CP, Gillebert, TC, et al. Recommendations for the evaluation of left ventricular diastolic function by echocardiography. J Am Soc Echocardiogr. 2009; 22:107–133.
38. Abhayaratna, WP, Seward, JB, Appleton, CP, et al. Left atrial size: Physiologic determinants and clinical applications. J Am Coll Cardiol. 2006; 47:2357–2363.
39. Appleton, CP, Jensen, J, Hatle, L, Oh, JK. Doppler evaluation of left and right ventricular diastolic function: A technical guide for obtaining optimal flow velocity recordings. J Am Soc Echocardiogr. 1997; 10:271–291.
40. Khouri, A, Maly, G, Suh, DD, Walsh, T. A practical approach to the echocardiographic evaluation of diastolic function. J Am Soc Echocardiogr. 2004; 17:290–297.
41. Nagueh, SF. Estimation of left ventricular filling pressures by Doppler echocardiography. ACC Curr J Rev. 2001; 11(Jan/Feb):41–45.
42. Ommen, SR. Echocardiographic assessment of diastolic function. Curr Opin Cardiol. 2001; 16:240–245.
43. Dokainish, H, Nguyen, JS, Sengupta, R, et al. Do additional echocardiographic variables increase the accuracy of E/e′ for predicting left ventricular filling pressure in normal ejection fraction? An echocardiographic and invasive hemodynamic study. J Am Soc Echocardiogr. 2010; 23(2):156–161.
44. Dokainish, H, Nguyen, JS, Bobek, J, et al. Assessment of the American Society of Echocardiography-European Association of Echocardiography guidelines for diastolic function in patients with depressed ejection fraction: An echocardiographic and invasive haemodynamic study. Eur J Echocardiogr. 2011; 12(11):857–864.
45. Naqvi, T. Diastolic function assessment incorporating new techniques in Doppler echocardiography. Rev Cardiovasc Med. 2003; 4(2):81–99.
46. Ommen, SR, Nishimura, RA, Appleton, CP, et al. Clinical utility of Doppler echocardiography and tissue Doppler imaging in the estimation of left ventricular filling pressures: A comparative simultaneous Doppler-catheterization study. Circulation. 2000; 102:1788–1794.
47. Mollema, SA, Nucifora, G, Bax, JJ. Prognostic value of echocardiography after acute myocardial infarction. Heart. 2009; 95(21):1732–1745.
48. Sia, YT, O’Meara, E, Ducharme, A. Role of echocardiography in acute myocardial infarction. Curr Heart Fail Rep. 2008; 5(4):189–196.
49. Ho, CY. Hypertrophic cardiomyopathy in 2012. Circulation. 2012; 125(11):1432–1438.
50. Afonso, LC, Bernal, J, Bax, JJ, Abraham, TP. Echocardiography in hypertrophic cardiomyopathy: The role of conventional and emerging technologies. JACC Cardiovasc Imaging. 2008; 1(6):787–800.
51. Hershberger, RE, Siegfried, JD. Update 2011: Clinical and genetic issues in familial dilated cardiomyopathy. J Am Coll Cardiol. 2011; 57(16):1641–1649.
52. Thomas, DE, Wheeler, R, Yousef, ZR, Masani, ND. The role of echocardiography in guiding management in dilated cardiomyopathy. Eur J Echocardiogr. 2009; 10(8):15–21.
53. Seward, JB, Casaclang-Verzosa, G. Infiltrative cardiovascular diseases: Cardiomyopathies that look alike. J Am Coll Cardiol. 2010; 55(17):1769–1779.
54. Mogensen, J, Arbustini, E. Restrictive cardiomyopathy. Curr Opin Cardiol. 2009; 24(3):214–220.
55. Rudski, LG, Lai, WW, Afilalo, J, et al. Guidelines for the echocardiographic assessment of the right heart in adults: A report from the American Society of Echocardiography endorsed by the European Association of Echocardiography, a registered branch of the European Society of Cardiology, and the Canadian Society of Echocardiography. J Am Soc Echocardiogr. 2010; 23(7):685–713.
56. Tei, C, Dujardin, KS, Hodge, DO, et al. Doppler echocardiographic index for assessment of global right ventricular function. J Am Soc Echocardiogr. 1996; 9:838–847.
57. Alam, M, Wardell, J, Andersson, E, et al. Right ventricular function in patients with first inferior myocardial infarction: Assessment by tricuspid annular motion and tricuspid annular velocity. Am Heart J. 2000; 139:710–715.
58. Dokainish, H, Abbey, H, Gin, K, et al. Usefulness of tissue Doppler imaging in the diagnosis and prognosis of acute right ventricular infarction with inferior wall acute left ventricular infarction. Am J Cardiol. 2005; 95(9):1039–1042.
59. La Gerche, A, Jurcut, R, Voigt, JU. Right ventricular function by strain echocardiography. Curr Opin Cardiol. 2010; 25(5):430–436.
60. Ryan, T, Petrovic, O, Dillon, JC, et al. An echocardiographic index for separation of right ventricular volume and pressure overload. J Am Coll Cardiol. 1985; 5:918.
61. Louie, EK, Rick, S, Levitsky, S, et al. Doppler echocardiographic demonstration of the differential effects of right ventricular pressure and volume overload on left ventricular geometry and filling. J Am Coll Cardiol. 1992; 19:84.
62. Hinderliter, AL, Willis, PW, Barst, RJ, et al. Effects of long-term infusion of prostacyclin (epoprostenol) on echocardiographic measures of right ventricular structure and function in idiopathic pulmonary hypertension. Idiopathic Pulmonary Hypertension Study Group. Circulation. 1997; 95:1479–1486.
63. Zoghbi, WA, Enriquez-Sarano, M, Foster, E, et al. Recommendations for evaluation of the severity of native valvular regurgitation with two dimensional and Doppler echocardiography. A report from the American Society of Echocardiography Nomenclature and Standards Committee and the Task Force on valvular regurgitation, developed in conjunction with the ACC Echocardiography Committee, the Cardiac Imaging Committee Council on Clinical Cardiology, the American Heart Association, and the European Society of Cardiology. J Am Soc Echocardiogr. 2003; 16:777–802.
64. Hall, SA, Brickner, ME, Willett, DL, et al. Assessment of mitral regurgitant severity by Doppler color flow mapping of the vena contracta. Circulation. 1997; 95:636–642.
65. Bargiggia, GS, Tronconi, L, Sahn, DJ, et al. A new method for quantification of mitral regurgitation based on color flow Doppler imaging of flow convergence proximal to the regurgitant orifice. Circulation. 1991; 84:1481–1489.
66. Baumgartner, H, Hung, J, Bermejo, J, et al. Echocardiographic assessment of valve stenosis: EAE/ASE recommendations for clinical practice. American Society of Echocardiography; European Association of Echocardiography. J Am Soc Echocardiogr. 2009; 22(1):1–23.
67. Currie, PJ, Seward, JB, Reeder, G, et al. Continuous wave Doppler assessment of severity of calcific aortic stenosis: A simultaneous Doppler-catheter correlative study in 100 adult patients. Circulation. 1985; 71:1162–1169.
68. Otto, CM, Pearlman, AS, Comess, KA, et al. Determination of the stenotic aortic valve area in adults using Doppler echocardiography. J Am Coll Cardiol. 1986; 7:509–517.
69. deFilippi, CR, Willet, DL, Brickner, ME, et al. Usefulness of dobutamine echocardiography in distinguishing severe from nonsevere valvular aortic stenosis in patients with depressed left ventricular systolic function and low transvalvular gradients. Am J Cardiol. 1995; 75:191–194.
70. Hatle, L, Brubakk, A, Tromsdal, A, et al. Noninvasive assessment of pressure drop in mitral stenosis by Doppler ultrasound. Br Heart J. 1978; 40:131–140.
71. Nakatani, S, Masuyama, T, Kodama, K, et al. Value and limitations of Doppler echocardiography in the quantitation of stenotic mitral valve area: Comparison of pressure half-time and continuity equation methods. Circulation. 1988; 77:78–85.
72. Rosenhek, R, Binder, T, Maurer, G, et al. Normal values for Doppler echocardiographic assessment of heart valve prostheses. J Am Soc Echocardiogr. 2003; 16(11):1116–1127.
73. Vanden Brink, RB. Evaluation of prosthetic heart valves by transesophageal echocardiography: Problems, pitfalls, and timing of echocardiography. Semin Cardiothorac Vasc Anesth. 2006; 10(1):89–100.
74. Zoghbi, WA, Chambers, JB, Dumesnil, JG, et al. Recommendations for evaluation of prosthetic valves with echocardiography and doppler ultrasound: A report from the American Society of Echocardiography’s Guidelines and Standards Committee and the Task Force on Prosthetic Valves. J Am Soc Echocardiogr. 2009; 22(9):975–1014.
75. Barbetseas, J, Zoghbi, WA. Evaluation of prosthetic valve function and associated complications. Cardiol Clin. 1998; 16:505–530.
76. Feigenbaum, H, Waldhausen, JA, Hyde, LP. Ultrasound diagnosis of pericardial effusion. JAMA. 1965; 191:711–714.
77. Tsang, T, Oh, JK, Seward, JB, et al. Diagnostic value of echocardiography in cardiac tamponade. Herz. 2000; 25:734–740.
78. Spodick, DH. Acute cardiac tamponade. N Engl J Med. 2003; 349:684–690.
79. Little, WC, Freeman, G. Pericardial disease. Circulation. 2006; 113:1622–1632.
80. Singh, S, Wann, S, Schuchard, GH, et al. Right ventricular and right atrial collapse in patients with cardiac tamponade: A combined echocardiographic and hemodynamic study. Circulation. 1984; 70:966–971.
81. Gillam, LD, Guyer, DE, Gibson, TC, et al. Hemodynamic compression of the right atrium: An echocardiographic sign of cardiac tamponade. Circulation. 1983; 68:294–301.
82. Reydel, B, Spodick, DH. Frequency and significance of chamber collapses during cardiac tamponade. Am Heart J. 1990; 199:1160–1163.
83. Armstrong, WF, Schilt, BF, Helper, DJ, et al. Diastolic collapse of the right ventricle with cardiac tamponade: An echocardiographic study. Circulation. 1982; 65:1491–1496.
84. Joffe, II., Douglas, PS. Cardiac tamponade in association with an atrial septal defect: Echocardiographic and hemodynamic observations. J Am Soc Echocardiogr. 1996; 9:909–914.
85. Appleton, CP, Hatle, LK, Popp, RL. Cardiac tamponade and pericardial effusion: Respiratory variation in transvalvular flow velocities by Doppler echocardiography. J Am Coll Cardiol. 1988; 11:1020–1030.
86. Callahan, JA, Seward, JB, Nishimura, RA, et al. Two-dimensional echocardiographically guided pericardiocentesis: Experience in 117 consecutive patients. Am J Cardiol. 1985; 55:476.
87. Chandraratna, PAN, Reid, CL, Nimalasuriya, A, et al. Application of 2-dimensional contrast studies during pericardiocentesis. Am J Cardiol. 1983; 52:1120.
88. Rajagopalan, N, Garcia, MJ, Rodriguez, L, et al. Comparison of new Doppler echocardiographic methods to differentiate constrictive pericardial disease and restrictive cardiomyopathy. Am J Cardiol. 2001; 87(1):86–94.
89. Ha, JW, Ommen, SR, Tajik, AJ, et al. Differentiation of constrictive pericarditis from restrictive cardiomyopathy using mitral annular velocity by tissue Doppler echocardiography. Am J Cardiol. 2004; 94(3):316–319.
90. Nienaber, CA, Spielman, RP, von Kodolitsch, Y, et al. Diagnosis of thoracic aortic dissection. Magnetic resonance imaging versus transesophageal echocardiography. Circulation. 1992; 85:434–447.
91. Cigarroa, JE, Isselbacher, EM, DeSanctis, RW, et al. Diagnostic imaging in the evaluation of suspected aortic dissection. Old standards and new directions. N Engl J Med. 1993; 328:35–43.
92. Nienaber, CA, von Kodolitsch, Y, Nicolas, V, et al. The diagnosis of thoracic aortic dissection by noninvasive imaging procedures. N Engl J Med. 1993; 328:1–9.
93. Willens, HJ, Kessler, KM. Transesophageal echocardiography in the diagnosis of diseases of the thoracic aorta: Part 1. Aortic dissection, aortic intramural hematoma, and penetrating atherosclerotic ulcer of the aorta. Chest. 1999; 116:1772–1779.
94. Nienaber, CA, Eagle, KA. Aortic dissection: New frontiers in diagnosis and management. Part 1: From etiology to diagnostic strategies. Circulation 2003;108:628. Part 2: Therapeutic management and follow-up. Circulation. 1993; 108:772–778.
95. Song, JK, Kim, HS, Kang, DH, et al. Different clinical features of aortic intramural hematoma versus dissection involving the ascending aorta. J Am Coll Cardiol. 2001; 37:1604–1610.
96. von Kodolitsch, Y, Csosz, SK, Koschyk, DH, et al. Intramural hematoma of the aorta: Predictors of progression to dissection and rupture. Circulation. 2003; 107:1158–1163.
97. Evangelista, A, Mukherjee, D, Mehta, RH, et al. Acute intramural hematoma of the aorta: A mystery in evolution. Circulation. 2005; 111:1063–1070.
98. Co, SJ, Yong-Hing, CJ, Galea-Soler, S, et al. Role of imaging in penetrating and blunt traumatic injury to the heart. Radiographics. 2011; 31(4):E101–115.
99. El-Chami, MF, Nicholson, W, Helmy, T. Blunt cardiac trauma. J Emerg Med. 2008; 35(2):127–133.
100. Vignon, P, Gueret, P, Vedrinne, JM, et al. Role of transesophageal echocardiography in the diagnosis and management of traumatic aortic disruption. Circulation. 1995; 92:2959–2968.
101. Vignon, P, Martaille, JF, Francois, B, et al. Transesophageal echocardiography and therapeutic management of blunt aortic injuries. J Trauma. 2005; 58:1150–1158.
102. Mertens, L, Friedberg, MK. The gold standard for noninvasive imaging in congenital heart disease: Echocardiography. Curr Opin Cardiol. 2009; 24(2):119–124.
103. Soliman, OI, Geleijnse, ML, Meijboom, FJ, et al. The use of contrast echocardiography for the detection of cardiac shunts. Eur J Echocardiogr. 2007; 8(3):S2–12.
104. Valdes-Cruz, LM, Horowitz, S, Mesel, E, et al. A pulsed Doppler echocardiographic method for calculating pulmonary and systemic blood flow. Circulation. 1984; 69:80.
105. Lewis, JF, Lawrence, CK, Nelson, JG, et al. Pulsed Doppler echocardiographic determination of stroke volume and cardiac output: Clinical validation of two new methods using the apical window. Circulation. 1984; 70:425.
106. Huntsman, LL, Stewart, DK, Barnes, SR, et al. Noninvasive Doppler determination of cardiac output in man: Clinical validation. Circulation. 1983; 67:593–602.
107. Quinones, MA, Otto, CM, Stoddard, M, et al. Recommendations for quantification of Doppler echocardiography: A report from the Doppler Quantification Task Force of the Nomenclature and Standards Committee of the American Society of Echocardiography. J Am Soc Echocardiogr. 2002; 15:167–184.
108. Nagueh, SF, Kopelen, HA, Zoghbi, WA. Relation of mean right atrial pressure to echocardiographic and Doppler parameters of right atrial and right ventricular function. Circulation. 1996; 93:1160–1169.
109. Cerebral Embolism Task Force. Cardiogenic brain embolism. The second report of the cerebral embolism task force. Arch Neurol. 1989; 46:727–743.
110. Horton, SC, Bunch, TJ. Patent foramen ovale and stroke. Mayo Clin Proc. 2004; 79:79–88.
111. Mas, JL, Arquizan, C, Lamy, C, et al. Recurrent cerebrovascular events associated with patent foramen ovale, atrial septal aneurysm, or both. N Engl J Med. 2001; 345:1740–1746.
112. Reynolds, H, Tunick, P, Kronzon, I. Role of transesophageal echocardiography in the evaluation of patients with stroke. Curr Opin Cardiol. 2003; 18:340–345.
113. Woods, T. Transesophageal echocardiography and stroke. Curr Atheroscl Rep. 2005; 7:255–262.
114. Vitebskiy, S, Fox, K, Hoit, BD. Routine transesophageal echocardiography for the evaluation of cerebral emboli in elderly patients. Echocardiography. 2005; 22:770–774.
115. Tunick, PA, Kronzon, I. Embolism from the aorta: Atheroemboli and thromboemboli. Curr Treat Options Cardiovasc Med. 2001; 3:181–186.