[level-membership-for-cardiovascular-category]
CHAPTER 6 Echocardiography
DESCRIPTION OF TECHNICAL REQUIREMENTS
Techniques
M Mode
The M (for motion) mode consists of a graphic in which it is possible to analyze the motion of cardiac structures over time. It is necessary for the correct position of a cursor line along the anatomic cardiac structure to be studied and this cursor line has its origin point at the ultrasound transducer itself. Errors in measurements with M mode are possible because some planes might be in an oblique orientation. This can be corrected with the anatomic M mode, an adjustable cursor line (angle up to 180 degrees), available in actual echocardiograph machines. The M mode is used for cardiac dimensions, subtle cardiac motion abnormalities, and assessment other time-related parameters (Fig. 6-1).
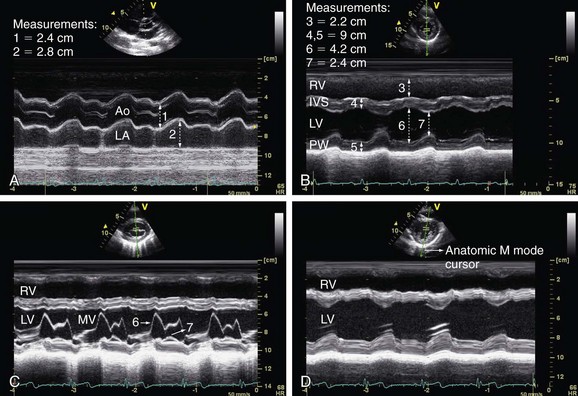
 FIGURE 6-1
Two-Dimensional Mode (2D Mode)
With the 2D mode it is possible to get real images of the heart in motion and it can be used as a reference for the M mode discussed previously. There are four basic thoracic positions used to get 2D images: parasternal, apical, subcostal, and suprasternal. The parasternal and apical are obtained with the patient in the left lateral position; for the subcostal and suprasternal, the patient lies in supine position. All different planes are obtained with simple tilting and twisting of the probe (Fig. 6-2).
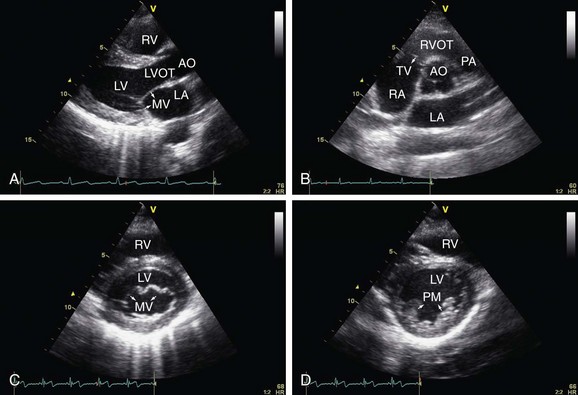
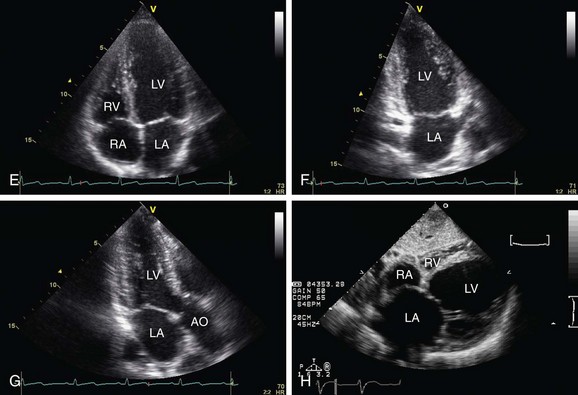
 FIGURE 6-2
Doppler Echocardiography and Color Flow Imaging
Important hemodynamic information can be obtained by using 2D and Doppler techniques but none of them, not even the invasive approach, is perfect, being influenced by several other hemodynamic factors. Flow velocities can be converted to pressure gradients by using the modified Bernoulli equation1:
where v is peak velocity. It is modified because several other elements can be ignored such as the velocity proximal to a fixed orifice and also flow acceleration and viscous friction. The pressure gradient obtained by this equation represents the instantaneous gradient, which is different from the peak-to-peak pressure measurement in the catheterization (cath) lab because those two peaks are not simultaneous. Several pressure measurements can be made using this equation such as: aortic stenosis gradient, right ventricle systolic pressure, pulmonary end-diastolic and mean arterial pressure, left atrial systolic pressure, and left ventricular end-diastolic pressure.
With the use of Doppler, it is also possible to obtain the stroke volume and cardiac output based on the equation that uses the hydraulic orifice formula, which is1:

The flow velocity is given by the sum of all instantaneous velocities of the curve by Doppler tracings, after tracing the area enclosed by the baseline and the Doppler spectrum. The CSA is given by the assumption that the orifice is a perfect circle so the diameter is measured and applied in the equation:

in which “D” means diameter. To calculate the systolic volume, the left ventricular outflow tract (LVOT) area is used in the first equation. And then, to get the cardiac output, the systolic volume is multiplied by the heart rate. Any flow across an orifice in the heart can be calculated using this method. Hence, it is possible to get the right ventricular outflow tract (RVOT) flow and, together with the LVOT flow, to get the ratio between pulmonary and systemic flows—important in some quantification of severity in congenital abnormalities. This method is also useful to obtain the regurgitant volume across a heart valve, such as mitral or aortic regurgitation (Fig. 6-3).
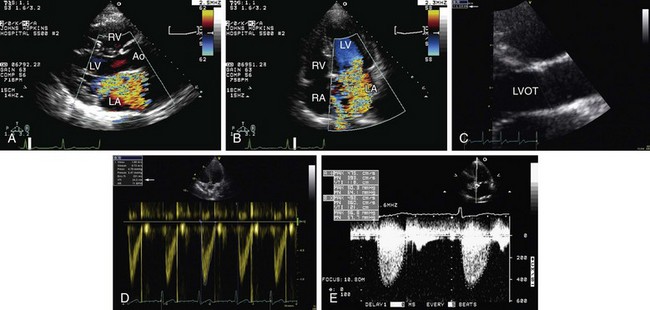
 FIGURE 6-3
Transesophageal Echocardiography (TEE)
The TEE uses a gastroesophageal endoscopy probe modified with a 7 to 10 MHz transducer on the tip. The study technique consists of inserting the probe through the esophagus, making it possible to get high resolution images of the heart. The study is performed in a special room, with emergency-trained personnel, suction and oxygen devices, and all necessary resuscitation equipment. The probe then can be anteflexed and retroflexed, moved from side to side, rotated clockwise and counterclockwise manually and the planes can be moved from 0 to 180 degrees wide with the touch of one button (Fig. 6-4).
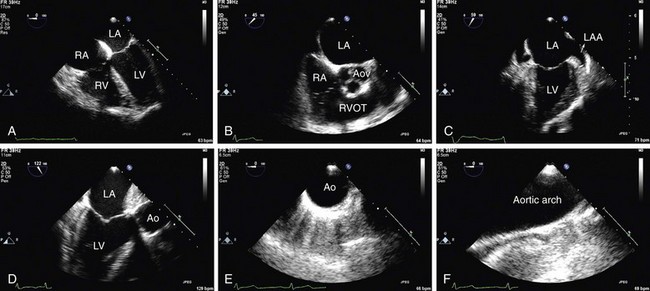
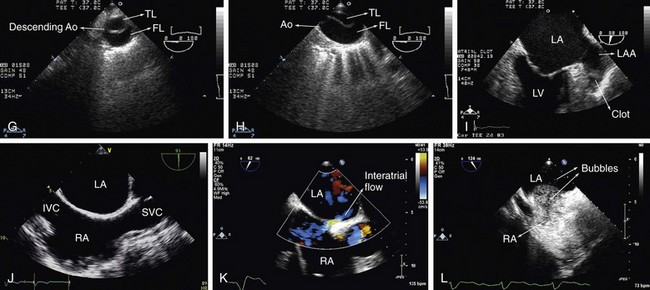
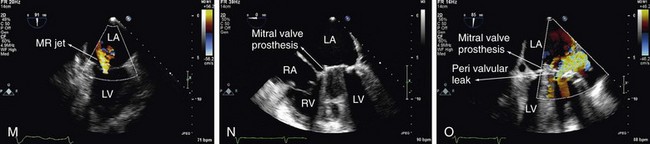
 FIGURE 6-4
Intracardiac Echocardiogaphy (ICE)
Indications
Systolic Function and Quantification of Cardiac Chambers

in which LVEDD means left ventricular end-diastolic diameter and LVESD means left ventricular end-systolic diameter. The Simpson method can be used to obtain LV volumes and then the calculated ejection fraction (EF) by the following formula2:
Regional wall motion analysis is the most important tool for the evaluation and diagnosis of patients with suspected or confirmed coronary heart disease. For this purpose, the LV is divided into 16 segments. First into three levels: basal, mid, and apical. The basal and mid levels have six segments: antero-septum, anterior, lateral, posterior, inferior, infero-septum; and the apex is then divided into four segments being the anterior, lateral, inferior, and septum. There was only 1 change for an additional “apical cap” segment by the Association Writing Group on Myocardial Segmentation for Cardiac Imaging with the total of 17 segments.3 Each segment is scored according to its contractility: 1-normal; 2-hypokinesis; 3-akinesis, 4-dyskinesis, and 5-aneurysmal. Each value of each segment is summed and the total is divided by the number of segments analyzed for the wall motion score index (WMSI), being normal if equal to 1.
Right ventricle (RV). The RV size is best measured from the apical four-chamber view and its thickness from the subcostal view at the peak R on the ECG. RV size is useful to detect volume and/or pressure overload and can be accompanied by RV wall thickness higher than 5 mm, the abnormal value.2
Left atrium (LA). The left atrium size is measured from the parasternal long axis view (PLAX) at end systole. This view can provide some underestimation on the chamber size because the LA can enlarge longitudinally. Because of this aspect of LA diameter, the best method is to calculate its volume from two orthogonal apical views using one of the four methods available (Fig. 6-5).2
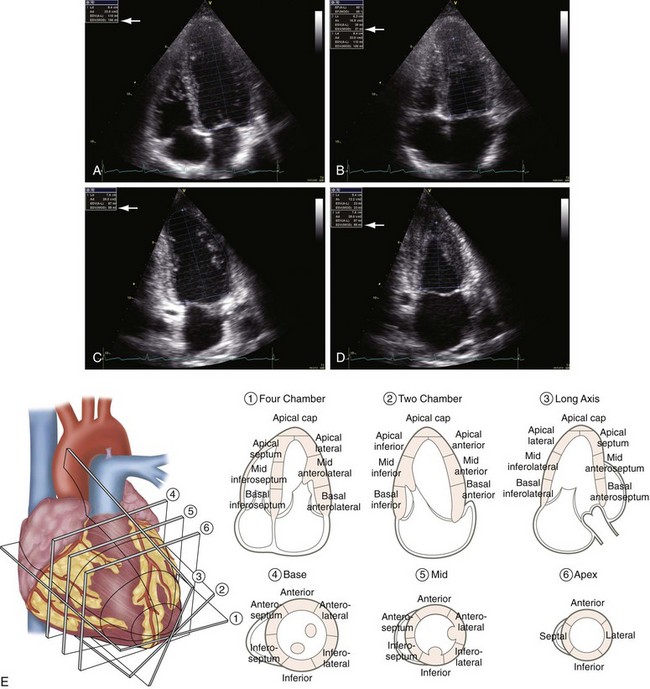
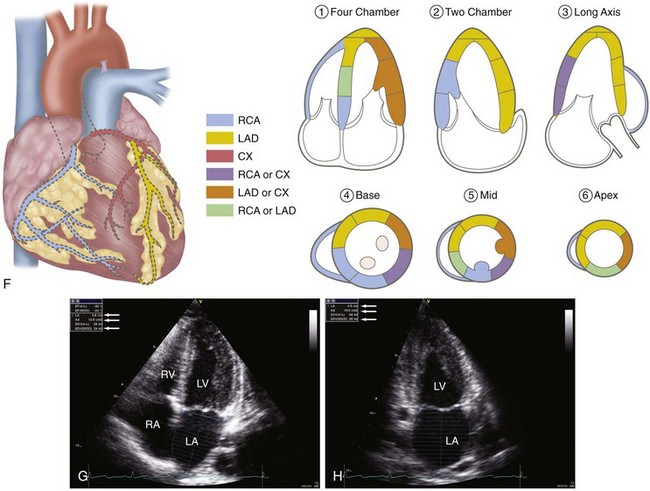
 FIGURE 6-5
Diastolic Function
Mitral inflow velocities. With mitral inflow tracings obtained by the use of pulsed wave Doppler, it is possible to measure peak velocities of early (E wave) and late (A wave) diastolic filling, the time from peak E wave to baseline (deceleration time—DT) and also the isovolumic relaxation time (IVRT), between the aortic valve closure and before mitral valve opening. Usually the DT and IVRT are prolonged in relaxation abnormalities because it takes a longer time for the LV filling pressure, in those cases, to equilibrate the LA pressure. And both are shortened in normal individuals or in situations of a higher filling pressure in the LV (with higher LA pressure).1
Mitral annulus velocities. Typical tracings of mitral annulus velocities obtained by tissue Doppler include three waves: one systolic (S′) and two diastolic: an early diastolic wave (E′) and a late diastolic wave (A′). For the purpose of evaluating diastolic function, the most important among those three waves is the E′. It is lower in patients with abnormal relaxation and does not increase with exercise, which is an opposite effect in normal subjects. In general E′ velocity remains lower and E wave velocity increases with higher filling pressures. It has been used as a ratio between those waves to estimate diastolic dysfunction.1
Pulmonary vein flow velocities. There are four different waves in tracings of pulmonary vein flow: two systolic, one diastolic velocity and one atrial flow reversal. Among those, the atrial flow reversal component is the most important, especially its size and morphology.1
Left atrium. The importance of LA dimension is that with progressing LV diastolic stiffness, the LA volume increases being considered one of the best parameters of chronic diastolic dysfunction and is related to further cardiac events such as atrial fibrillation, heart failure, stroke, and death (Figs. 6-5GH and 6-6).4
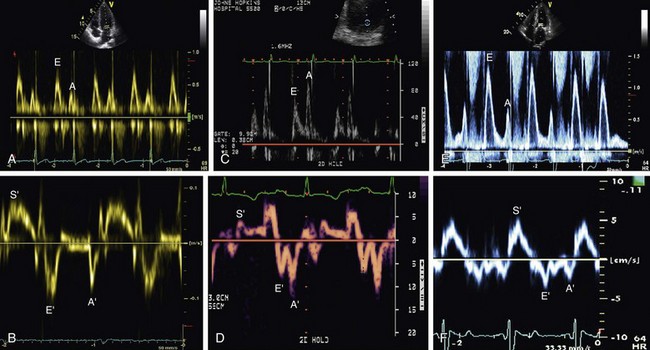
 FIGURE 6-6
Pulmonary Hypertension
It is important to distinguish between acute and chronic pulmonary hypertension. Usually acute pulmonary hypertension is due to pulmonary embolism. Chronic pulmonary hypertension causes are related to cor pulmonale. Important findings in both cases are enlargement of right chambers with the LV being “compressed” by the pressure overloaded RV, and also the RV decreased systolic function. It is possible to find images compatible with thrombi, more related to pulmonary embolism. In some cases, it can be difficult to differentiate the acute and chronic pulmonary hypertension. The presence of increased RV thickness may be found in patients with chronic pulmonary hypertension (Fig. 6-7).
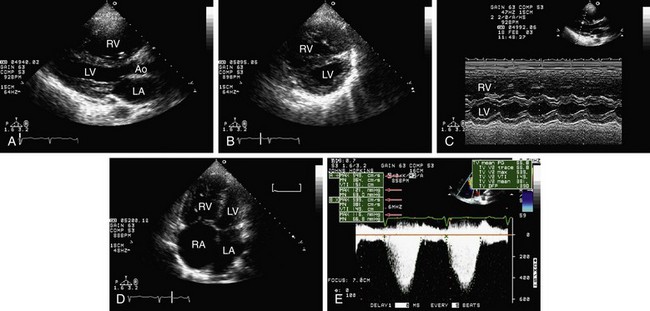
 FIGURE 6-7
Coronary Artery Disease (CAD)
Echocardiography is one of the best noninvasive tools to evaluate patients with suspected CAD or patients submitted to risk stratification because of CAD. It is already known that quantification of global and regional contractility by echocardiography has a close relation to the patient’s short- and long-term prognosis. Evaluation of global LV function by 2D echo was discussed previously. Regional contractility analysis was also addressed previously and what is important to point out in this section is that the higher the wall motion score index, the bigger the infarcted area, which in turn might correlate with a poor prognosis.5 Another important aspect of the regional contractility analysis is that wall motion changes may occur before any ST-T segment elevation in the electrocardiography (ECG) or even before symptoms. Doppler is useful to analyze diastolic function and the initial abnormality is altered myocardial relaxation with prolonged IVRT, DT, lower E, and higher A waves. The restrictive pattern is associated with severe LV systolic dysfunction. Using tissue Doppler parameters is also useful and the E/E′ ratio can be a predictor of survival after acute myocardial infarction (AMI).6
Tako-tsubo cardiomyopathy. This specific kind of myocardial infarction is characterized by usually apical akinesia not associated with coronary obstruction. There is a relation with psychologic and physical stress situations. It is possible to find typical ECG and cardiac marker abnormalities. This group of patients can show unstable hemodynamics, but almost all of them recover fully.7
For the patients who cannot exercise for any number of reasons, the pharmacologic stress test is used and the drugs used are dobutamine, dipyridamole, and adenosine. Stress echocardiography is capable to detect any of the following findings: worsening of wall motion abnormalities (WMA) and/or development of new ones, which are related to stress-induced ischemia. Specifically for pharmacologic test, myocardial viability can be evaluated if there is an improvement in contractility with low-dose dobutamine and worsening with higher doses of the drug, the so called biphasic response. Other findings include: LV dilation and/or decrease in systolic function, which might be related to severe CAD. More detailed information on pharmacologic stress agents can be found in Chapter 26.
The other type of contrast agent, agitated saline, consists of 10 mL of saline which is agitated with a three-way stopcock and two syringes five times before the injection in the venous circulation. The bubbles appear first in the right chamber and then in the left side. The main indication for this technique (also known as a “bubble study”) is to study right-to-left shunts such as through a patent foramen ovale (PFO). If there is flow through the PFO, the contrast appears immediately in the left atrium right after the right one (see Fig. 6-4). Another indication for this technique is to study intrapulmonary shunts, in which the contrast can also be seen in the left atrium immediately after the injection. Normally it is not possible for the bubbles to be seen before at least three consecutive beats. Another useful situation for this saline contrast is to increase the tricuspid regurgitation signal to measure right ventricular systolic pressure because one third of patients may not show a good tricuspid regurgitation Doppler signal (Fig. 6-8).
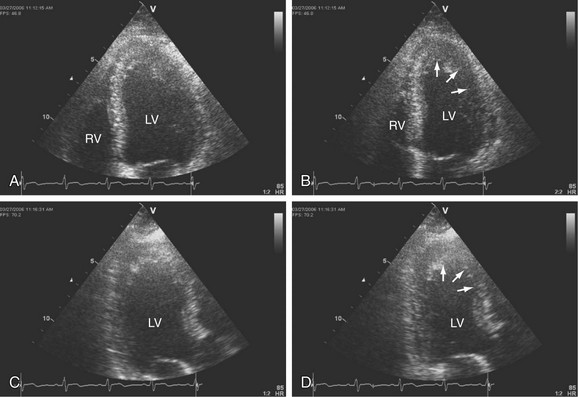
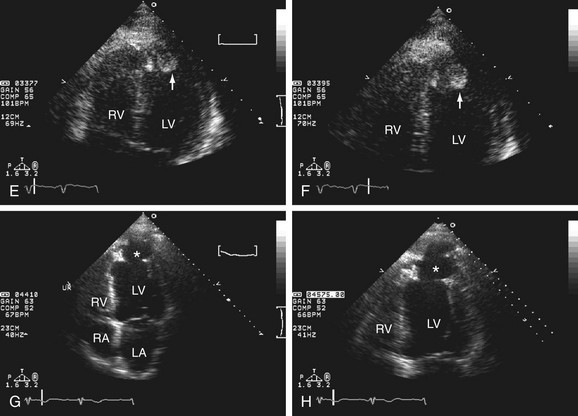
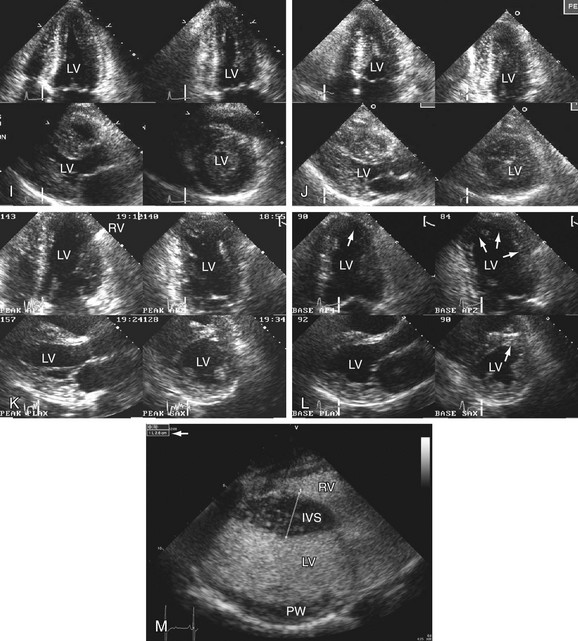
 FIGURE 6-8
Aortic Stenosis (AS)
There are two important causes of AS: degenerative and congenital. By using 2D echocardiography, it is possible to study basic features of the aortic valve that can provide the diagnostic cause. Thus in degenerative aortic disease, calcification predominates as the main characteristic. Not much calcification is seen in the congenital valve with AS, particularly in early stages. Still in the 2D mode, it is possible to study the valve opening and some hemodynamic consequences in the heart such as LV mass and function. Doppler echocardiography is the best option to establish the severity of AS. With the peak aortic flow velocity from continuous wave Doppler, it is possible to calculate: peak and mean transaortic pressure gradient, aortic valve area, and LVOT/aortic time-velocity integral (TVI) ratio.8 It is important to point out that in some patients because of “pressure recovery” the calculated gradients might be higher than those derived from catheter angiography studies. After the blood flow passes through the aortic valve, the kinetic energy can be recovered while in the aorta, making the pressure level in this site higher even if it is away from the valve.
Mitral Stenosis (MS)
The most common cause of MS is rheumatic heart disease. Infrequent causes of MS include degenerative calcification, hypereosinophilia, medication toxicity, and vegetation. 2D echocardiography is extremely useful in MS because it can provide information used to select patients for mitral balloon valvuloplasty in the cath lab. Each morphologic item is given a grade from 0 to 4 and the total sum must be equal or less than 8, which is related to a good result after valvuloplasty procedure (Wilkins-Block score). Doppler echocardiography can reliably measure the pressure gradient across the mitral valve but can sometimes be variable because of its volume relationship. The mitral valve area calculation is a more reliable method for MS evaluation and can be done with one of the three methods: pressure half time (PHT) (Fig. 6-9), the continuity equation, and the proximal iso-velocity surface area (PISA).
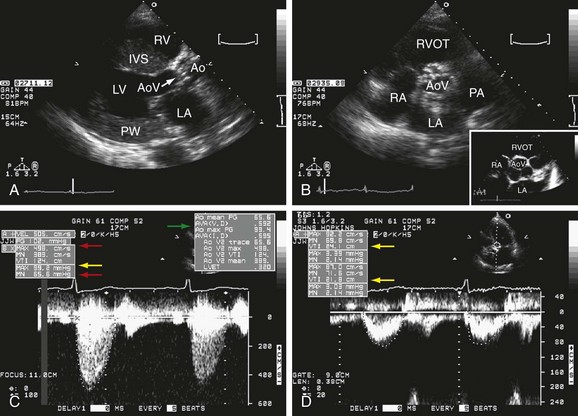
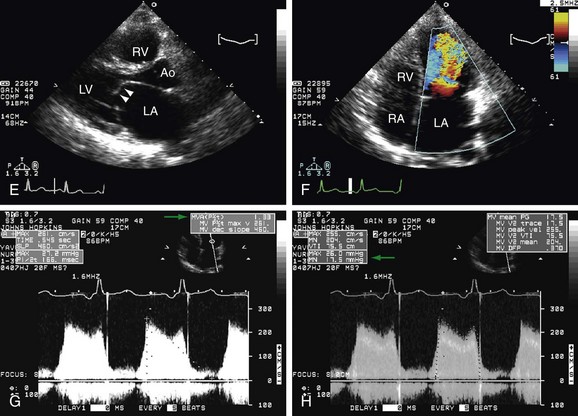
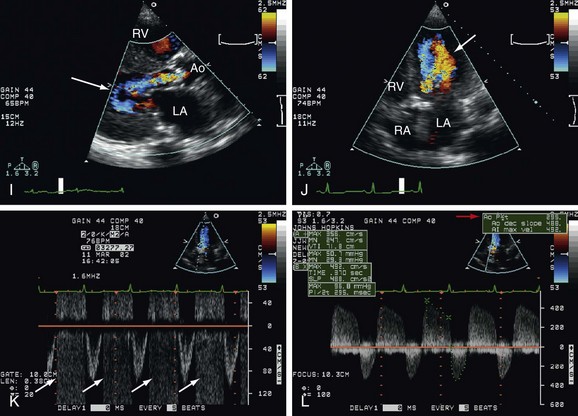
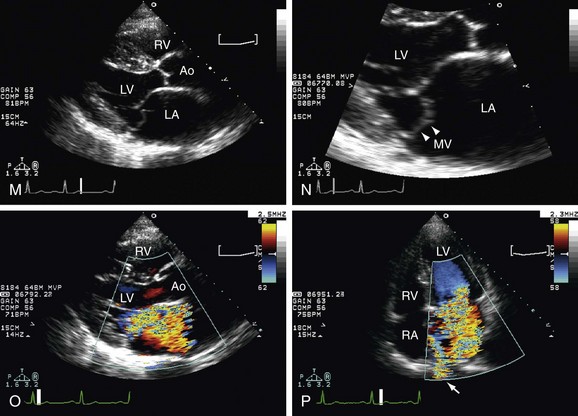
 FIGURE 6-9
Aortic Regurgitation (AR)
There are several causes of AR: congenital, endocarditis, degenerative calcific aortic valve, Marfan syndrome, dilated aortic root, aortic dissection. 2D echocardiography is usually able to visualize those abnormalities. Another important feature of chronic severe AR is LV increased diameter and the “fluttering” of the anterior mitral leaflet because of the proximity with the flow from the AR. With color Doppler it is possible to identify the regurgitant jet in the left ventricle outflow tract and with continuous wave Doppler—to measure the pressure half time (PHT), which is the time from the peak early diastolic gradient until the point it reaches its half level, used for severity quantification.9
Mitral Regurgitation (MR)
As in AR, there are several causes for MR: mitral valve prolapse, endocarditis, flail mitral leaflet, ruptured chordae, mitral annulus calcification, papillary muscle dysfunction or rupture, rheumatic disease. 2D echocardiography is used to study the mitral valve anatomy and to establish the etiology of the regurgitation. It is also important to perform LV chamber measurements to obtain ejection fraction and to study the hemodynamic response to the severity of the MR. With color Doppler it is possible to recognize the turbulent regurgitant flow in the left atrial chamber during systole and have an estimation of severity based of the regurgitant jet area inside the LA. Pulsed wave Doppler can be used to identify the regurgitant jet in the systolic phase, but with the continuous wave Doppler, the regurgitant orifice area and volume can be calculated.9
Prosthetic Heart Valves
There are basically two types of prosthetic heart valves: made from tissue (biologic) and mechanical. This latter can be a ball-cage or disk valve. The evaluation of prosthetic heart valves starts with 2D echocardiography, by which it is possible to visualize certain abnormalities such as: dehiscence, vegetation, thrombus, and tissue prosthesis degeneration. What is challenging is the fact that it is not always possible to use only transthoracic echocardiography (TTE) for that purpose because of reverberation and reflectance of the prosthetic material, and TEE is necessary for proper evaluation (see Fig. 6-4).
With Doppler echocardiography it is possible to obtain pressure gradients and prosthetic valve area measurements using the same equations considered for the native valve calculations. What is important to notice is that prosthetic heart valves are inherently stenotic, thus velocities and pressure gradients, as well as prosthetic valve areas, are variable and dependent on the type and manufacturer of each one (see Fig. 6-9).
ENDOCARDITIS
Echocardiography is the best imaging tool for analyzing patients with suspected or diagnosed endocarditis with a sensitivity ranging from 60% to 80%. Vegetation found on an echocardiography study is one of two major criteria for the diagnosis of endocarditis. Vegetations are usually highly mobile, linear, or round and are found on the atrial side of atrioventricular valves or ventricular face of semilunar valves. Echocardiography is also important for the detection of endocarditis complications, especially for vegetations greater than 10 mm. TEE has the best accuracy for diagnosis of endocarditis with 95% sensitivity and is usually performed in patients with a nondiagnostic TTE and also to detect complications, especially if aortic valve is involved such as: mitral-aortic intervalvular fibrosa aneurysm and/or perforation with communication into the LA, aortic annular abscess, or perforation of the mitral leaflet (Fig. 6-10).
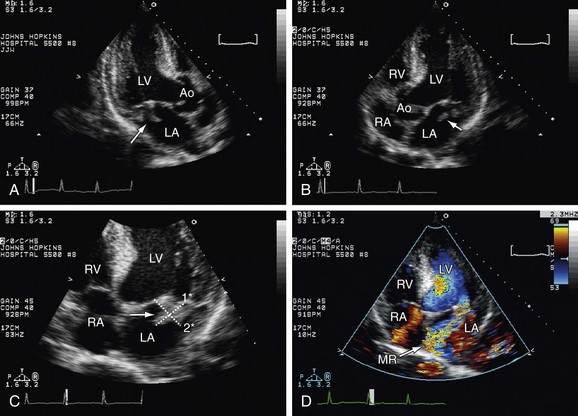
 FIGURE 6-10
CARDIOMYOPATHIES
Noncompaction Cardiomyopathy (Isolated Ventricular Noncompaction)
Because of an embryonic defect in the compaction mechanism, the LV wall in this cardiomyopathy can show marked trabeculations and intratrabecular recesses with blood flow mapped by color flow Doppler. Patients with this condition may present during the follow-up with heart failure, thromboembolic events, ventricular tachycardia, and sudden death (Fig. 6-11).
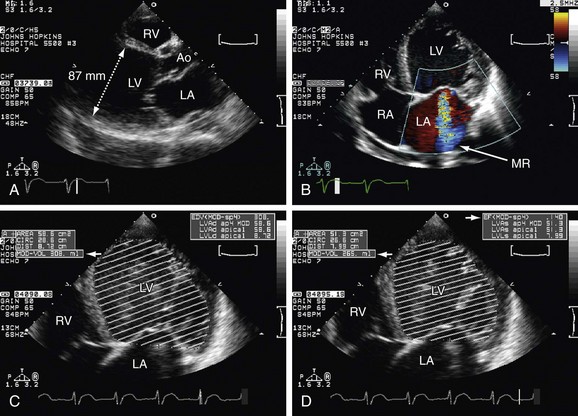
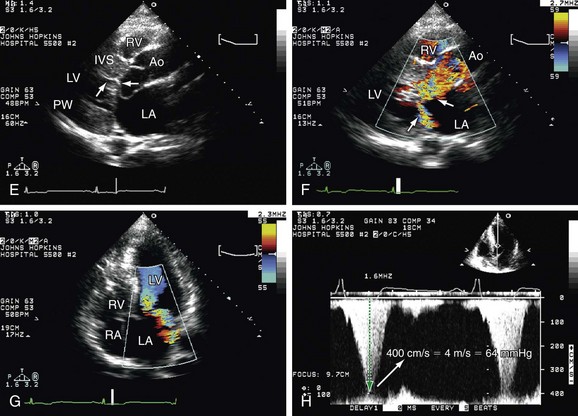
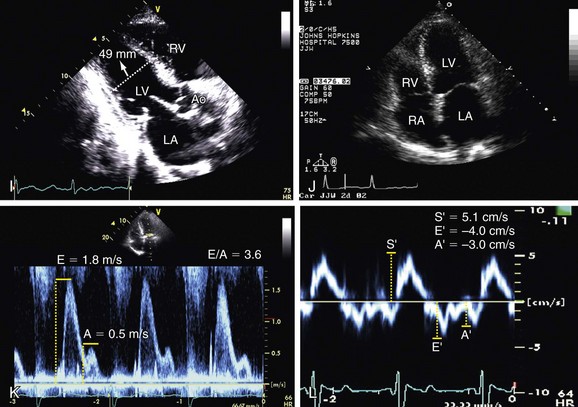
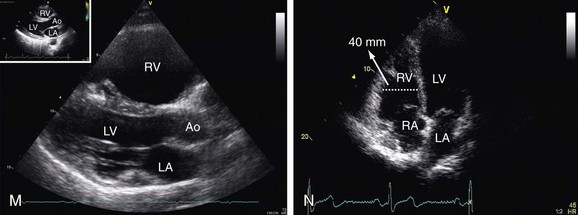
 FIGURE 6-11
PERICARDIAL DISEASES
Constrictive Pericarditis
Previous cardiac surgery, viral infection, radiation to the chest, tuberculosis and collagen vascular disease can cause the pericardium to be inflamed, thickened, and adherent to the heart; in chronic cases, calcification may be seen. The main hemodynamic event of constrictive pericarditis is impaired diastolic filling. The 2D and M-mode can show some signs of constriction, but they are not specific, such as: thickened pericardium, abnormal interventricular septum motion, and dilated inferior vena cava. Doppler can be more helpful and usually the important changes compatible with constriction are: respiratory variation of the right and left ventricle, restrictive pattern of mitral inflow, hepatic vein flow reversal, superior vena cava with no variation due to respiration, E′ equal or higher than 7 cm/seg. If TTE is not conclusive, TEE can be used to study pulmonary vein flow, especially if there is an associated loculated effusion (Fig. 6-12).
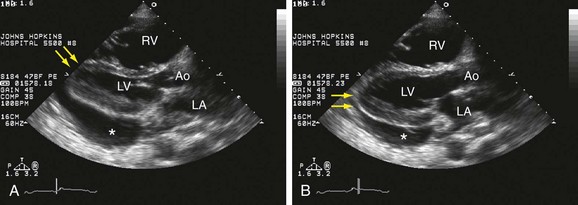
 FIGURE 6-12
CARDIAC MANIFESTATIONS OF SYSTEMIC ILLNESSES
Amyloidosis
Echocardiographic changes found in patients with amyloidosis are: normal cavity size, thickened walls, granular appearance of myocardium, and diastolic dysfunction. Some patients can show thickening of heart valves with variable degrees of multivalvular regurgitation. The systolic function can deteriorate as the disease progresses (Fig. 6-13).
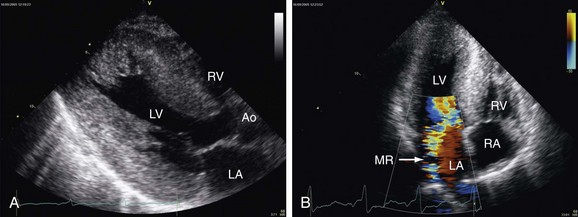
 FIGURE 6-13
TUMORS AND MASSES
Other Masses
Other masses in the heart can be mistaken by a specific tumor and include left atrial lipomatous hypertrophy, right atrial eustachian valve; pacemaker lead, central line catheter, and thrombi. If TTE is not conclusive for the specific etiology, TEE can be used for that purpose (Fig. 6-14).
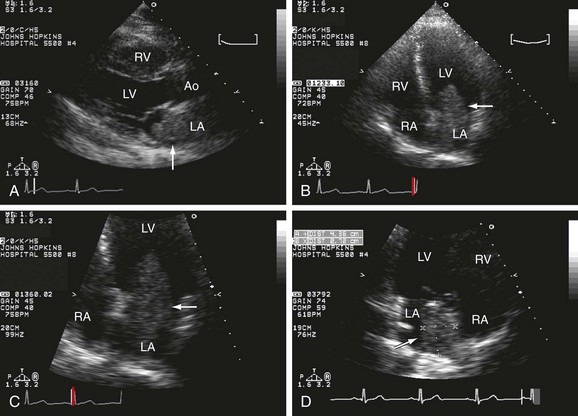
 FIGURE 6-14
DISEASES OF THE AORTA
Aortic Dissection
There are several publications that studied the feasibility and accuracy of echocardiography in the diagnosis of aortic dissection. TTE is usually the option for screening and TEE is the imaging technique for a complete study. It is possible to visualize the thoracic aorta and the proximal portion of its abdominal section. The TEE must be detailed enough to find the point of intimal tear, or even an intramural hematoma, which can be the precursor lesion of dissection. Intramural hematoma is an echodense image between the intima and adventitia and it is different from atherosclerotic plaque because the latter has an irregular surface. Also important in aortic dissection is the identification of the true and false lumen, as well as complications such as coronary involvement, hemopericardium, aortic regurgitation, and LV dysfunction (Fig. 6-15).
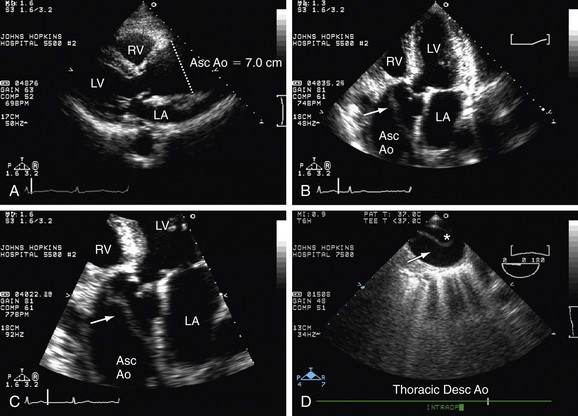
 FIGURE 6-15
Congenital Heart Disease
Complex Congenital Cardiac Malformations
Univentricular Atrioventricular Connection
In this congenital cardiac syndrome one of the two mechanisms can be found: the small size of one ventricle prevents it to work as a circulatory pump or the association of defects that interfere with a division of the two ventricular chambers such as straddling of an atrioventricular valve (Fig. 6-16).
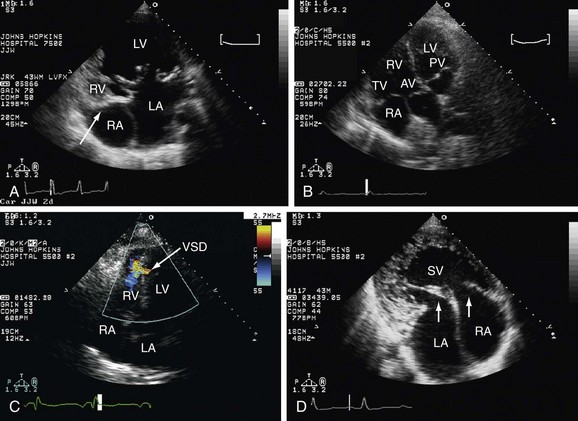
 FIGURE 6-16
TISSUE DOPPLER AND STRAIN IMAGING
All these parameters have been used extensively to study global and regional contractility as well as diastolic function; rest and stress studies in coronary heart disease, and left ventricular dyssynchrony (Fig. 6-17).10–13
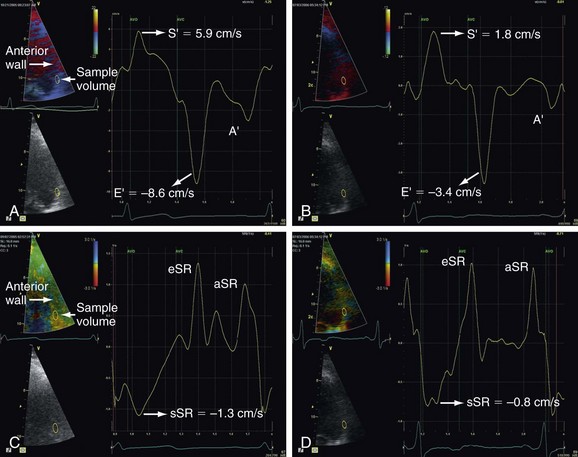
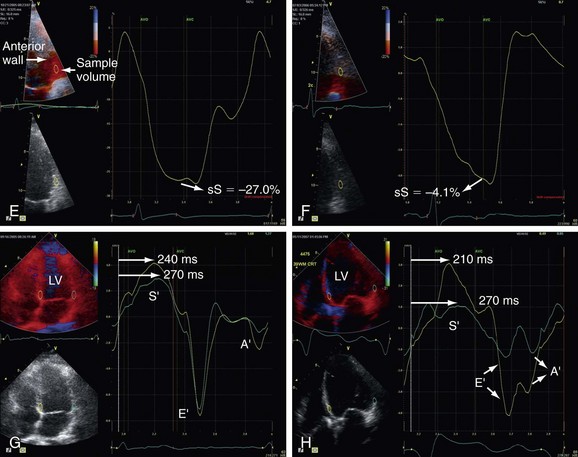
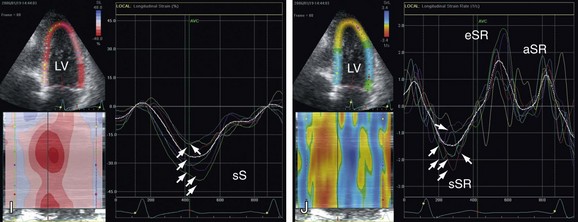
 FIGURE 6-17
Pitfalls and Solutions
Transesophageal echocardiography has several pitfalls that must be considered during the analysis. Many anatomical structures that are not well seen in transthoracic echocardiography can be confused with masses, thrombus (such as pectinate muscles in atria and atrial appendages or surgical sutures of prosthetic valves, or other patch material); the thickened atrial septum in lipomatous hypertrophy can be misinterpreted as a mass such as myxoma; the eustachian valve, in the right atrium at the orifice of the inferior vena cava can appear as a mobile membrane or mass.14
The quality of studies of aortic dissection can be compromised due to the existence of artifacts produced by the lungs in the mid-descending aorta and linear artifacts can be confused with dissection flaps. Caution must always be taken when suspected images such as these are found and when the final quality of the images is compromised by air.14
All the pitfalls discussed here can be minimized by the use of several planes of view in the transthoracic echocardiography and the use of multiplane probes for the transesophageal echocardiography, and most importantly by the experience of the examiner.14


1 Quiñones MA, Otto CM, Stoddard M, et al. Recommendations for quantification of Doppler echocardiography: A report from the Doppler quantification task force of the nomenclature and standards committee of the American Society of Echocardiography. J Am Soc Echocardiogr. 2002;15:167-184.
2 Lang RM, Bierig M, Devereux RB, et al. Recommendations for Chamber Quantification: A Report from the American Society of Echocardiography’s Guidelines and Standards Committee and the Chamber Quantification Writing Group, Developed in Conjunction with the European Association of Echocardiography, a Branch of the European Society of Cardiology. J Am Soc Echocardiogr. 2005;18:1440-1463.
3 Cerqueira MD, Weissman NJ, Dilsizian V, et al. Standardized Myocardial Segmentation and Nomenclature for Tomographic Imaging of the Heart: A Statement for Healthcare Professionals From the Cardiac Imaging Committee of the Council on Clinical Cardiology of the American Heart Association. Circulation. 2002;105:539-542.
4 Abhayaratna WP, Seward JB, Appleton CP, et al. Left Atrial Size: Physiologic Determinants and Clinical Applications. J Am Coll Cardiol. 2006;47:2357-2363.
5 Møller JE, Hillis GS, Oh JK, et al. Wall motion score index and ejection fraction for risk stratification after acute myocardial infarction. Am Heart J. 2006;151:419-425.
6 Møller JE, Søndergaard E, Poulsen SH, et al. Color M-mode and pulsed wave tissue Doppler echocardiography: powerful predictors of cardiac events after first myocardial infarction. J Am Soc Echocardiogr. 2001;14:757-763.
7 Tsuchihashi K, Ueshima K, Uchida T, et al. Transient left ventricular apical ballooning without coronary artery stenosis: a novel heart syndrome mimicking acute myocardial infarction. J Am Coll Cardiol. 2001;38:11-18.
8 Otto CM. Valvular Aortic Stenosis: Disease Severity and Timing of Intervention. J American Coll Cardiol. 2006;47:2141-2151.
9 Zoghbi WA, Enriquez-Sarano M, Foster E, et al. Recommendations for evaluation of the severity of native valvular regurgitation with two-dimensional and Doppler echocardiography. J Am Soc Echocardiogr. 2003;16:777-802.
10 Abraham TP, Belohlavek M, Thomson HL, et al. Time to onset of regional relaxation: feasibility, variability and utility of a novel index of regional myocardial function by strain rate imaging. J Am Coll Cardiol. 2002;39:1531-1537.
11 Yip G, Abraham T, Belohlavek M, Khandheria BK. Clinical applications of strain rate imaging. J Am Soc Echocardiogr. 2003;16:1334-1342.
12 Sutherland GR, Di Salvo G, Claus P, et al. Strain and strain rate imaging: a new clinical approach to quantifying regional myocardial function. J Am Soc Echocardiogr. 2004;17:788-802.
13 Yu CM, Zhang Q, Fung JW, et al. A novel tool to assess systolic asynchrony and identify responders of cardiac resynchronization therapy by tissue synchronization imaging. J Am Coll Cardiol. 2005;45:677-684.
14 Khandheria BK, Seward JB, Tajik AJ. Critical appraisal of transesophageal echocardiography: limitations and pitfalls. Crit Care Clin. 1996;12:235-251.
[/level-membership-for-cardiovascular-category][not-level-membership-for-cardiovascular-category]
CHAPTER 6 Echocardiography
DESCRIPTION OF TECHNICAL REQUIREMENTS
Techniques
M Mode
The M (for motion) mode consists of a graphic in which it is possible to analyze the motion of cardiac structures over time. It is necessary for the correct position of a cursor line along the anatomic cardiac structure to be studied and this cursor line has its origin point at the ultrasound transducer itself. Errors in measurements with M mode are possible because some planes might be in an oblique orientation. This can be corrected with the anatomic M mode, an adjustable cursor line (angle up to 180 degrees), available in actual echocardiograph machines. The M mode is used for cardiac dimensions, subtle cardiac motion abnormalities, and assessment other time-related parameters (Fig. 6-1).
Two-Dimensional Mode (2D Mode)
With the 2D mode it is possible to get real images of the heart in motion and it can be used as a reference for the M mode discussed previously. There are four basic thoracic positions used to get 2D images: parasternal, apical, subcostal, and suprasternal. The parasternal and apical are obtained with the patient in the left lateral position; for the subcostal and suprasternal, the patient lies in supine position. All different planes are obtained with simple tilting and twisting of the probe (Fig. 6-2).
Doppler Echocardiography and Color Flow Imaging
Important hemodynamic information can be obtained by using 2D and Doppler techniques but none of them, not even the invasive approach, is perfect, being influenced by several other hemodynamic factors. Flow velocities can be converted to pressure gradients by using the modified Bernoulli equation1:
where v is peak velocity. It is modified because several other elements can be ignored such as the velocity proximal to a fixed orifice and also flow acceleration and viscous friction. The pressure gradient obtained by this equation represents the instantaneous gradient, which is different from the peak-to-peak pressure measurement in the catheterization (cath) lab because those two peaks are not simultaneous. Several pressure measurements can be made using this equation such as: aortic stenosis gradient, right ventricle systolic pressure, pulmonary end-diastolic and mean arterial pressure, left atrial systolic pressure, and left ventricular end-diastolic pressure.
With the use of Doppler, it is also possible to obtain the stroke volume and cardiac output based on the equation that uses the hydraulic orifice formula, which is1:
The flow velocity is given by the sum of all instantaneous velocities of the curve by Doppler tracings, after tracing the area enclosed by the baseline and the Doppler spectrum. The CSA is given by the assumption that the orifice is a perfect circle so the diameter is measured and applied in the equation:
in which “D” means diameter. To calculate the systolic volume, the left ventricular outflow tract (LVOT) area is used in the first equation. And then, to get the cardiac output, the systolic volume is multiplied by the heart rate. Any flow across an orifice in the heart can be calculated using this method. Hence, it is possible to get the right ventricular outflow tract (RVOT) flow and, together with the LVOT flow, to get the ratio between pulmonary and systemic flows—important in some quantification of severity in congenital abnormalities. This method is also useful to obtain the regurgitant volume across a heart valve, such as mitral or aortic regurgitation (Fig. 6-3).
Transesophageal Echocardiography (TEE)
The TEE uses a gastroesophageal endoscopy probe modified with a 7 to 10 MHz transducer on the tip. The study technique consists of inserting the probe through the esophagus, making it possible to get high resolution images of the heart. The study is performed in a special room, with emergency-trained personnel, suction and oxygen devices, and all necessary resuscitation equipment. The probe then can be anteflexed and retroflexed, moved from side to side, rotated clockwise and counterclockwise manually and the planes can be moved from 0 to 180 degrees wide with the touch of one button (Fig. 6-4).
Intracardiac Echocardiogaphy (ICE)
Indications
Systolic Function and Quantification of Cardiac Chambers
in which LVEDD means left ventricular end-diastolic diameter and LVESD means left ventricular end-systolic diameter. The Simpson method can be used to obtain LV volumes and then the calculated ejection fraction (EF) by the following formula2:
Regional wall motion analysis is the most important tool for the evaluation and diagnosis of patients with suspected or confirmed coronary heart disease. For this purpose, the LV is divided into 16 segments. First into three levels: basal, mid, and apical. The basal and mid levels have six segments: antero-septum, anterior, lateral, posterior, inferior, infero-septum; and the apex is then divided into four segments being the anterior, lateral, inferior, and septum. There was only 1 change for an additional “apical cap” segment by the Association Writing Group on Myocardial Segmentation for Cardiac Imaging with the total of 17 segments.3 Each segment is scored according to its contractility: 1-normal; 2-hypokinesis; 3-akinesis, 4-dyskinesis, and 5-aneurysmal. Each value of each segment is summed and the total is divided by the number of segments analyzed for the wall motion score index (WMSI), being normal if equal to 1.
Right ventricle (RV). The RV size is best measured from the apical four-chamber view and its thickness from the subcostal view at the peak R on the ECG. RV size is useful to detect volume and/or pressure overload and can be accompanied by RV wall thickness higher than 5 mm, the abnormal value.2
Left atrium (LA). The left atrium size is measured from the parasternal long axis view (PLAX) at end systole. This view can provide some underestimation on the chamber size because the LA can enlarge longitudinally. Because of this aspect of LA diameter, the best method is to calculate its volume from two orthogonal apical views using one of the four methods available (Fig. 6-5).2
Diastolic Function
Mitral inflow velocities. With mitral inflow tracings obtained by the use of pulsed wave Doppler, it is possible to measure peak velocities of early (E wave) and late (A wave) diastolic filling, the time from peak E wave to baseline (deceleration time—DT) and also the isovolumic relaxation time (IVRT), between the aortic valve closure and before mitral valve opening. Usually the DT and IVRT are prolonged in relaxation abnormalities because it takes a longer time for the LV filling pressure, in those cases, to equilibrate the LA pressure. And both are shortened in normal individuals or in situations of a higher filling pressure in the LV (with higher LA pressure).1
Mitral annulus velocities. Typical tracings of mitral annulus velocities obtained by tissue Doppler include three waves: one systolic (S′) and two diastolic: an early diastolic wave (E′) and a late diastolic wave (A′). For the purpose of evaluating diastolic function, the most important among those three waves is the E′. It is lower in patients with abnormal relaxation and does not increase with exercise, which is an opposite effect in normal subjects. In general E′ velocity remains lower and E wave velocity increases with higher filling pressures. It has been used as a ratio between those waves to estimate diastolic dysfunction.1
Pulmonary vein flow velocities. There are four different waves in tracings of pulmonary vein flow: two systolic, one diastolic velocity and one atrial flow reversal. Among those, the atrial flow reversal component is the most important, especially its size and morphology.1
Left atrium. The importance of LA dimension is that with progressing LV diastolic stiffness, the LA volume increases being considered one of the best parameters of chronic diastolic dysfunction and is related to further cardiac events such as atrial fibrillation, heart failure, stroke, and death (Figs. 6-5GH and 6-6).4
Pulmonary Hypertension
It is important to distinguish between acute and chronic pulmonary hypertension. Usually acute pulmonary hypertension is due to pulmonary embolism. Chronic pulmonary hypertension causes are related to cor pulmonale. Important findings in both cases are enlargement of right chambers with the LV being “compressed” by the pressure overloaded RV, and also the RV decreased systolic function. It is possible to find images compatible with thrombi, more related to pulmonary embolism. In some cases, it can be difficult to differentiate the acute and chronic pulmonary hypertension. The presence of increased RV thickness may be found in patients with chronic pulmonary hypertension (Fig. 6-7).
