[level-membership-for-basic-science-category]
Dosage regimens
John H. Collett and Soraya Dhillon
Chapter contents
Dosage regimens: influence on the plasma concentration-time profile of a drug in the body
One-compartment open model of drug disposition in the body
Rate of drug input versus rate of drug output
Elimination rate constant and biological half-life of a drug
Concentration-time curve of a drug in the body following the oral administration of equal doses of a drug at fixed time intervals
Important factors influencing steady-state plasma concentrations of a drug
Dose size and frequency of administration
Population data and basic pharmacokinetic parameters
Influence of changes in the apparent elimination rate constant of a drug: patients with renal impairment
Key points
Dosage regimens: influence on the plasma concentration-time profile of a drug in the body
The design of a dosage regimen determines the therapeutic benefit for patients. The principles of clinical pharmacokinetics are applied to design a dosage regimen for a patient that ensures the appropriate formulation of drug is chosen for an appropriate route of administration. On the basis of the patient’s drug handling parameters, which require an understanding of absorption, distribution, metabolism and excretion, the dosage regimen for the medicine in a particular patient, can be optimized. The pharmacist needs to ensure the appropriate regimen is prescribed to achieve optimal efficacy and minimal toxicity.
Clinical pharmacokinetics provides a basic understanding of the principles required to design a dosage regimen. Pharmacokinetics provides a mathematical basis to assess the time course of drugs and their concentrations in the body. It enables the following processes to be quantified:
It is these four pharmacokinetic processes, often referred to as ADME, that determine the drug concentration in the body following administration of a medicine (see also Chapter 18).
The influence that physiological factors, physicochemical properties of a drug and dosage form factors can have in determining whether a therapeutically effective concentration of a drug is achieved in the plasma following oral administration of a single dose of drug has been discussed previously in Chapters 19 and 20.
Whilst a single dose of certain drugs, e.g. single-dose hypnotics, analgesics and antiemetics, may be used in some clinical situations, most medicines are given as a multiple dosage regimen. For example, for the treatment of a respiratory tract infection, amoxicillin may be prescribed as one 250 mg capsule three times a day. The design of the regimen, i.e. formulation, route of administration, dose size and the dosage frequency are important factors which influence what plasma concentration is achieved and maintained in the body over the prescribed course of drug treatment. Other factors to consider are: patient choice and lifestyle, including the route of administration (the oral route is often preferred by patients), the dosing interval (once, twice or three times a day) needs to be suitable for a patient’s work pattern and the dosage form must be appropriate, for instance a liquid may be preferable to a capsule for young and elderly patients.
Rates of ADME processes
To describe the processes of ADME, there is a need to consider the rates of the various processes. In zero-order reactions, the reaction proceeds at a constant rate and is independent of the concentration of a substance present in the body. An example is the elimination of alcohol. Drugs exhibiting this type of elimination will show accumulation of plasma levels of the drug, and hence non-linear pharmacokinetics. In first-order reactions, the reaction proceeds at a rate which is dependent on the concentration of a drug in the body. Most ADME processes follow first-order kinetics (Chapter 7).
The majority of drugs used clinically at therapeutic dosages will show first-order rate processes, e.g. the rate of elimination of most drugs will be first order. However, some drugs show non-linear rates of elimination, for instance phenytoin and high dose salicylates. First-order rate processes do not result in accumulation, i.e. as the amount of drug administered increases, the body is able to eliminate the drug accordingly. Hence, if the dose is doubled, the steady-state plasma concentration is doubled. Whether a drug shows first- or zero-order elimination is determined by its Michaelis Constant (Km). This parameter is the plasma concentration at which the elimination of the drug proceeds at half the maximum metabolic capacity (Vm). If normal therapeutic plasma levels of the drug exceed the drug’s Michaelis Constant, then the drug will show non-linear drug handling. For most drugs, the Michaelis Constant is much higher than the levels achieved through normal therapeutic use.
One-compartment open model of drug disposition in the body
To understand how the design of a dosage regimen can influence the time course of a drug in the body, as measured by its plasma concentration-time profile, it is important to consider the complex pharmacokinetic processes of: drug input (i.e. administration); output (i.e. elimination/metabolism) and distribution within the body. This can be described using the one-compartment open model of drug disposition, shown in Figure 22.1.

Pharmacokinetic models are hypothetical constructs, which describe the fate of a drug in a biological system following its administration. The purpose of modeling is to characterize the ADME profile for a drug to indicate how the drug is handled by the patient and to characterize basic parameters. These basic parameters describe the fate of the drug following administration and are used to optimize a dosage regimen. In a one-compartment model, the drug is considered to be distributed instantly throughout the whole body following its release and absorption from the dosage form. Thus, the body behaves as a single compartment in which absorbed drug is distributed so rapidly that a concentration equilibrium exists at any given time between the plasma, other body fluids and the tissues into which the drug has become distributed.
Rate of drug input versus rate of drug output
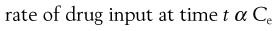
In a one-compartment open model, the overall kinetic processes of drug input and drug output are described by first-order kinetics. Following administration of an oral dosage form, the process of drug input into the body compartment involves drug release from the dosage form and passage of drug (absorption) across the cellular membranes, in this case the gastrointestinal barrier. The rate of drug input (absorption) at any given time is proportional to the concentration of drug, which is assumed to be in an absorbable form, in solution in the gastrointestinal fluids at the site(s) of absorption, i.e. the effective concentration, Ce, of drug at time, t.
Hence:
 (22.1)
and
 (22.2)
where ka is the apparent absorption rate constant.
The negative sign in Equation 22.2 indicates that the effective concentration of drug at the absorption site(s) decreases with time. The apparent absorption rate constant gives the proportion (or fraction) of drug which enters the body compartment per unit time. Unlike the rate of drug input into the body compartment, the apparent absorption rate constant, ka, is independent of the effective concentration of drug at the absorption site(s). The rate of drug input will decrease gradually with time as the effective drug concentration at the site of absorption decreases (assumes first-order absorption). Other processes, such as chemical degradation and movement of drug away from the absorption site(s), will also contribute to the gradual decrease in the drug concentration with time at the absorption site.
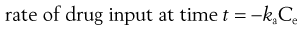
In the case of a one-compartment open model, the rate of drug output or elimination is a first-order process. Consequently, the magnitude of this parameter at any given time is dependent on the concentration of drug in the body compartment at that time. Immediately following administration of the first dose of an oral dosage form, the rate of drug output from the body, i.e. elimination, will be low since a limited amount of drug has been absorbed into the body compartment. However, as absorption proceeds, initially at a higher rate than the rate of drug output, the net concentration of drug in the body will increase with time. As the rate of drug output from the body compartment increases whilst the rate of drug input into the body compartment is decreasing with time, there will be a point at which the rate of drug input is equal to the rate of drug output, such that the net concentration of drug in the body compartment will reach a peak value (Cmax) and then begin to fall with time. At this stage, the rate of drug output exceeds the rate of drug input.
These changes in the rates of drug input and output, relative to each other, with time are responsible for the characteristic shape of the concentration-time course of a drug in the body shown in Figure 22.2 following oral administration of a single dose of a drug.
The shape of the curve is determined by the relationship between the rate of absorption and the rate of elimination. The greater the rate of drug input relative to the rate of drug output from the body compartment over the net absorption phase, the higher will be the peak concentration achieved in the body or plasma following oral administration of a single dose of drug. This explains why increases in dose size and formulation changes in dosage forms, which produce increases in the effective concentration of drug at the absorption site(s), result in higher peak plasma and body concentrations being obtained for a given drug. It should also be noted that any unexpected decrease in the rate of drug output relative to the rate of drug input, which may occur as the result of renal impairment or poor drug metabolism, is also likely to result in higher plasma and body concentrations of drug than expected, and the possibility of the patient exhibiting toxicity. The adjustment of dosage regimens in cases of patients having severe renal impairment is considered later.
Elimination rate constant and biological half-life of a drug
In the case of a one-compartment open model, the rate of elimination or output of a drug from the body compartment follows first-order kinetics and is related to the concentration of drug, Ct, remaining in the body compartment at time t, by the following equation:
 (22.3)
where ke is the apparent elimination rate constant. The negative sign in Equation 22.3 indicates that elimination is removing drug from the body compartment.
The apparent elimination rate constant of a drug gives the proportion, or fraction, of that drug which is eliminated from the body per unit time. Its units are in terms of time−1. The apparent elimination constant of a given drug thus provides a quantitative index of the persistence of that drug in the body.
For example the fraction of drug remaining after time t is calculated from:
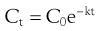 (22.4)
where  is the starting concentration. e−kt is the fraction of drug remaining and the fraction eliminated is given by:
 (22.5)
Application of these equations is shown in Box 22.1.
Box 22.1 Calculation of the fraction of drug eliminated from and remaining in the body with time
A patient has an elimination rate constant of 0.08 hr−1. If the patient has a starting plasma concentration of drug,  , of 16 mg/L, then at 4 hours the fraction remaining in the body (Ct) is equal to
  e−kt. Thus:
Ct = 16 e−0.08×4
Ct = 11.6 mg/L, i.e. 72.6% of the drug is remaining
and the fraction of drug eliminated is:
1 – e−kt = 27.4%
An alternative parameter used is the biological or elimination half-life of the drug, t1/2. The biological half-life of a given drug is the time required for the body to eliminate 50% of the drug which it contained. Thus, the larger the biological half-life exhibited by a drug, the slower will be its elimination from the body or plasma.
For a drug whose elimination follows first-order kinetics, the value of its biological half-life is independent of the concentration of drug remaining in the body or plasma. Hence, if a single dose of a drug having a biological half-life of 4 hours was administered orally, then after the peak plasma concentration had been reached, the plasma concentration of drug would fall by 50% every 4 hours until the entire drug had been eliminated or a further dose was administered. The relationship between the numbers of half-lives elapsed and the percentage of drug eliminated from the body following administration of a single dose is given in Table 22.1.
Table 22.1
Relationship between the amount of drug eliminated and the number of half-lives elapsed
| Number of half-lives elapsed | Percentage of drug eliminated |
| 0.5 | 29.3 |
| 1.0 | 50.0 |
| 2.0 | 75.0 |
| 3.0 | 87.5 |
| 3.3 | 90.0 |
| 4.0 | 94.0 |
| 4.3 | 95.0 |
| 5.0 | 97.0 |
| 6.0 | 98.4 |
| 6.6 | 99.0 |
| 7.0 | 99.2 |
An appreciation of the relationship between the percentage of drug eliminated from the body and the number of biological half-lives elapsed is useful when considering how much drug is eliminated from the body over the time interval between successive doses in a multiple dosage regimen. An understanding of this relationship can assist in determining an appropriate dosage interval. The biological half-life of a drug will show variation from drug-to-drug. Biological half-lives for a number of drugs are given in Table 22.2.
Table 22.2
| Drug | Biological half-life (hours) |
| Digoxin | 36–51 |
| Theophylline | 6–8 |
| Lithium | 15–30 |
| Gentamicin | 2–3 |
There can also be significant interpatient variability influenced by desease state and lifestyle. For example, the drug theophylline has a half- life of 8.6 hours in healthy patients, yet in patients with heart failure or liver impairment it can be prolonged to 16 hours. For the same drug a patient who smokes will show a much shorter half-life, around 5 hours. For drugs such as lithium, gentamicin or digoxin the half-life varies with age and renal function.
In the case of a drug whose elimination follows first-order kinetics, the biological half-life of the drug, t1/2, is related to the apparent elimination rate constant, ke, of that drug according to the following equation:
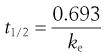 (22.6)
This equation indicates that the biological half-life of a drug will be influenced by any factor that influences the apparent elimination rate constant of the drug. This explains why factors such as genetic differences between individuals, age and certain diseases can affect the biological half-life exhibited by a given drug. The biological half-life of a drug is an important factor that influences the plasma concentration-time curve obtained following oral administration of a multiple dosage regimen.
Concentration-time curve of a drug in the body following the oral administration of equal doses of a drug at fixed time intervals
In discussing how the design of multiple oral dosage regimens can influence the concentration-time course of a drug in the body, the following assumptions have been made.
If the time interval between each orally administered dose is longer than the time required for complete elimination of the previous dose, then the plasma concentration time profile of a drug will exhibit a series of isolated single dose profiles as shown in Figure 22.3.
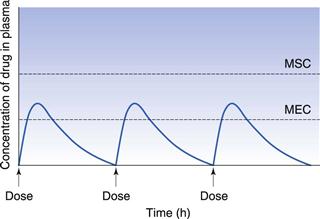
Consideration of the plasma concentration-time profile shown in Figure 22.3 in relation to the minimum effective and maximum safe plasma concentrations for the drug reveals that this particular dosage regimen is unsatisfactory. The therapeutic range expresses the range of concentrations between which the drug will show clinical efficacy and minimal toxicity. In this case, the plasma concentration only lies within the therapeutic range of the drug for a relatively short period of time following the administration of each dose and the patient remains under medicated for relatively long periods of time. If the dosing time interval is reduced such that it is now shorter than the time required for complete elimination of the previous dose, then the resulting plasma concentration-time curve exhibits the characteristic profile shown in Figure 22.4.
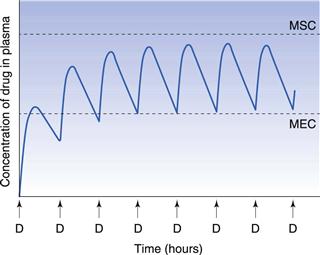
Figure 22.4 shows that at the start of this multiple dosage regimen, the maximum and minimum plasma concentrations of drug observed during each dosing time interval tend to increase with successive doses. This increase is a consequence of the time interval between successive doses being less than that required for complete elimination of the previous absorbed dose. Consequently, the total amount of the drug remaining in the body compartment at any time after a dose is equal to the sum of that remaining from all the previous doses. The accumulation of drug in the body and plasma with successively administered doses does not continue indefinitely. Providing drug elimination follows first-order kinetics, the rate of drug elimination will increase as the average concentration of drug in the body (and plasma) rises. If the amount of drug supplied to the body compartment per unit dosing time interval remains constant, then a situation is eventually reached when the overall rate of elimination of drug from the body over the dosing time interval, becomes equal to the overall rate at which drug is being absorbed to the body compartment over the dosing time interval. The overall rate of elimination has effectively caught up with the overall rate of administration of drug to the body compartment over each dosing time interval. This is due to the elimination rate increasing as the residual concentration of drug in the plasma rises (since elimination is first order here).
When the overall rate of drug supply equals the overall rate of drug output from the body compartment, a steady state is reached with respect to the average concentration of drug remaining in the body over each dosing time interval. At steady state, the amount of drug eliminated from the body over each dosing time interval is equal to the amount of drug that was absorbed into the body compartment following administration of the previous dose.
Figure 22.5 shows that the amount of drug in the body, as measured by the plasma concentration of drug, fluctuates between maximum and minimum values, which remain more or less constant from dose to dose. At steady state, the average concentration of drug in the plasma,  , over successive dosing time intervals remains constant.
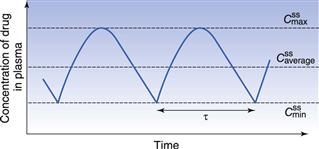
 ,
,  and
and  represent the maximum, minimum and average plasma concentrations of drug, respectively, achieved at steady state.
For a drug administered repeatedly in equal doses and at equal time intervals, the time required for the average plasma concentration to attain the corresponding steady-state value is a function only of the biological half-life of the drug and is independent of both the size of the dose administered and the length of the dosing time interval. The time required for the average plasma concentration to reach 95% of the steady-state value corresponding to the particular multiple dosage regimen is 4.3 times the biological half-life of the drug. The corresponding figure for 99% is 6.6 times. Therefore, depending on the magnitude of the biological half-life of the drug being administered, the time taken to attain steady-state plasma concentrations may range from a few hours to several days.
If we assume a patient is receiving a 100 mg dose of a drug and half the total amount is eliminated between doses, Table 22.3 shows the time required to reach a steady-state concentration in the body.
Table 22.3
Relationship between dose, half-life and the amount of drug present in the body at steady state
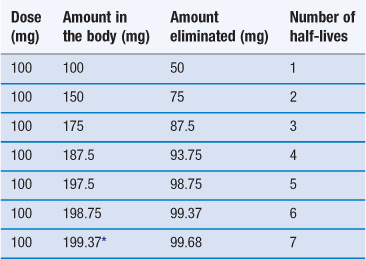
*To continue at this rate of dosage the amount of drug in the body will remain effectively constant.
In practice, steady state is assumed to be reached after 4 to 5 half-lives. From a clinical viewpoint, the time required to reach steady state is important since for a properly designed multiple dosage regimen, the attainment of steady state corresponds to the achievement and maintenance of maximal clinical effectiveness of the drug in the patient.
It should be noted that for some drugs, such as phenytoin, whose elimination is not described by first-order kinetics, the oral administration of equal doses at fixed intervals of time may not result in the attainment of steady-state plasma levels of the drug. With repeated dosing, the average concentration of drug in the body and plasma tends to continue to accumulate, rather than reaching a plateau.
Important factors influencing steady-state plasma concentrations of a drug
Dose size and frequency of administration
The regimen must consider the plasma concentration profile at steady state and in particular the fluctuations in the  and
and  . A word here about symbols used for drug concentrations. In the case of drug levels measured at steady-state, the superscript ss is often added to the C (i.e.
  ). In the specific case of concentrations of drug in blood plasma, an additional subscript p may be included in the symbol (e.g. Cpt, Cpmax, Cpmin, etc).
Only two factors can be adjusted for a given drug, namely the size of the dose and the dosage interval. These are discussed below:
Size of dose
Figure 22.6 shows the effects of changing dose size on the concentration of drug in the plasma following repetitive administration of oral doses at equal time intervals. As the size of the administered dose is increased, the higher are the corresponding maximum, minimum and average plasma drug levels,  ,
,  and
and  respectively, achieved at steady state. An important factor to consider is the impact of the dose on the fluctuations in the plasma levels, i.e. they should be within the therapeutic range. The larger the size of dose administered, the larger the fluctuation between
  and
and  during each dosing time interval. Large fluctuations between
  and
and  may lead to toxicity if the maximum safe concentration is exceeded, or therapeutic failure if the minimum effective concentration is not achieved. This will impact clinically for drugs such as digoxin which have a narrow therapeutic range. Figure 22.6 also illustrates that the time required to attain steady-state plasma concentrations of a drug is independent of the size of the administered dose.
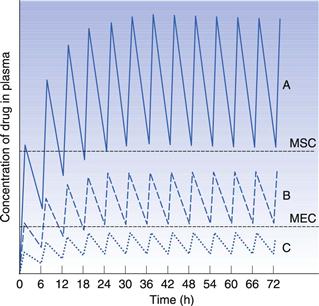
Time interval between successive equal doses
Figure 22.7 illustrates the effects of a constant dose administered at various dosing intervals. It is important to consider the relationship between the dosage interval and the half-life of the drug. If the dosage interval is less than the half-life, Figure 22.7 shows that multiple administration results in higher steady-state plasma drug concentrations being obtained. The higher steady-state concentration is a consequence of the extent of elimination of the drug from the body over a dosing time interval equal to 0.5 t1/2 being smaller than that which is eliminated when the dosing time interval is t1/2.
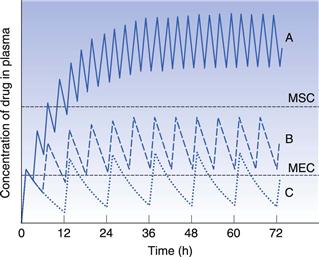
Figure 22.7 also shows the impact of the dosage interval if it is greater than the half-life of the drug, which results in lower steady-state plasma drug concentrations being obtained. This decrease is a consequence of a greater proportion of the drug being eliminated over a dosing time interval equal to 2t1/2 as compared to that which is eliminated when the dosing time interval is equal to t1/2. The profile also shows greater fluctuation in  and
and  .
.
Summary of the effects of dose size and frequency of administration
Consideration of the effects of administered dose size and the dosage time interval on the amount of a given drug in the body, as measured by the plasma concentration of drug, following multiple oral administration of equal doses of the drug has revealed the following relationships:
 value as a 250 mg dose of the same drug given four times a day, whilst the
  and
and  fluctuation for the latter dose regimen will be decreased by a half.
• The maximum safe and minimum effective plasma drug concentrations (therapeutic range) are represented by the horizontal dashed lines in Figures 22.6 and 22.7. It is evident that the proper selection of dose size and dosage time interval is important with respect to achieving and maintaining steady-state plasma concentrations which lie within the therapeutic range of the particular drug being administered.
The characteristics of the drug concentration-time profile is determined by the selection of the dose size and the dosage time interval, which is crucial in ensuring that a multiple dosage regimen provides steady-state concentrations of drug in the body which are both clinically efficacious and safe, i.e. within the therapeutic range for that drug. Patient choice and social factors are also important to consider. For instance, most patients would prefer to take medication once or twice daily. Consequently, patient adherence to the prescribed regimen needs to be considered as well as the pharmacokinetic characteristics of the drug formulation.
Mathematical relationships which predict the values of the various steady-state parameters achieved in the body following repeated administration of doses at constant time intervals have been used to assist the design of clinically acceptable multiple dosage regimens. A useful equation for predicting the average amount of drug achieved in the body at steady state,  , following multiple oral administration of equal doses, D, at a fixed time interval, τ, is given by:
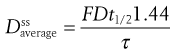 (22.7)
where F is the fraction of drug absorbed following administration of a dose, D, of drug (thus F × D is the bioavailable dose of drug) and t1/2 is the biological half-life of the drug. The average amount of a given drug in the body at steady state,  , is related to the corresponding average plasma concentration of the drug by the factor known as the apparent volume of distribution of the drug, i.e.:
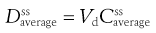 (22.8)
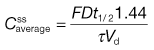
where Vd is the apparent volume of distribution of the drug and  is the average steady-state plasma concentration of the drug. Equation 22.7 can be rewritten in terms of the average steady-state plasma concentration of the drug as follows:
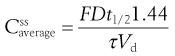 (22.9)
If the value of the average body amount or the average plasma concentration of a given drug at steady state which gives a satisfactory therapeutic response in a patient is known, then Equation 22.7 or Equation 22.9 can be used to estimate, respectively, either the size of dose which should be administered at a preselected dosage time interval or the dosage time interval that a preselected dose should be administered repeatedly. To illustrate a dosage regimen calculation, based on the average steady-slate plasma concentration of a drug, a worked example is shown in Box 22.2.
Box 22.2 Calculation of dosage regimen to achieve a desired steady-slate plasma concentration
An antibiotic is to be administered repeatedly to a female patient weighing 50 kg. The antibiotic is available in the form of capsules each containing 250 mg of the drug. The fraction of the drug which is absorbed following oral administration of one 250 mg capsule is 0.9. The antibiotic has a biological half-life of 3 hours, and the patient has an apparent volume of distribution of 0.2 litre kg−1 of body weight.
To estimate the dosage time interval required for a multiple dosage regimen to achieve a therapeutic average steady-state plasma concentration of 16 mg L−1, the following approach can be used;
Use Equation 22.9:
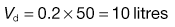
where the average steady-state plasma concentration of drug,  , = 16 mg L−1; the fraction of each administered dose absorbed, F, = 0.9; the size of administered dose, D, = 250 mg; the biological half-life of the drug, t1/2, = 3 hours and the apparent volume of distribution, Vd, = 0.2 litre kg−1 of patient’s body weight.
For a patient weighing 50 kg, the value of:
To calculate the dosage time interval, τ, requires substitution of the above values into Eqn 22.9. This gives:
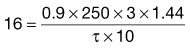
which gives
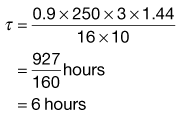
Thus, one 250 mg capsule should be administered every 6 hours in order to achieve the required average steady-state plasma concentration.
Mathematical equations which predict the maximum or minimum steady-state plasma concentrations of a drug achieved in the body following repeated administration of equal doses at a fixed interval of time are also available for drugs whose time course in the body is described by the one-compartment open pharmacokinetic model.
Concept of ‘loading doses’
The time required for a given drug to reach 95% of the average steady-state plasma concentration is approximately 4.5 biological half-lives. Hence for a drug with a long half-life of 24 hours, it would take more than 4 days for the average drug concentration in the plasma to reach 95% of its steady-state value. For some drugs it is important to achieve plasma levels within the therapeutic range quickly for clinical efficacy, and it would be unacceptable to wait 4 days to achieve therapeutic levels. To reduce the time required for the onset of the full therapeutic effect of a drug, a large single dose of the drug may be administered initially in order to achieve a peak plasma concentration which lies within the therapeutic range of the drug and is approximately equal to the value of  required. This initial dose is known as the loading dose. Thereafter, smaller, equal doses are administered at suitable fixed time intervals to maintain the plasma concentrations of drug at the required maximum, minimum and average steady-state levels which provide the patient with the full therapeutic benefit of the drug.
Figure 22.8 shows how rapidly therapeutic steady-state plasma concentrations of drug are achieved when the dosage regimen consists of an initial loading dose followed by maintenance doses compared to a ‘simple’ multiple dosage regimen of equal sized doses administered at the same dosage intervals.
Population data and basic pharmacokinetic parameters
To apply the principles of pharmacokinetics in practice, population data may be employed. Population data are mean pharmacokinetic parameters, such as apparent volume of distribution, which can be used to calculate predicted drug concentrations following a given dosage, or to calculate the dosage regimen, including loading and maintenance doses, required to achieve a particular drug concentration. Population data, i.e. basic pharmacokinetic parameters, can be found in standard reference sources or original pharmacokinetic studies. It is important to identify the correct population data for the type of patient. Interested readers are referred to the texts listed in the Bibliography for further information and examples of the use of such parameters.
Influence of changes in the apparent elimination rate constant of a drug: patients with renal impairment
Whilst the loading dose, maintenance dose and dosage time interval may be varied in order to design a clinically efficacious multiple dosage regimen, one factor cannot normally be adjusted. That factor is the apparent elimination rate constant exhibited by the particular drug being administered. However, the elimination rate constant of a given drug does vary from patient to patient and is influenced by whether the patient has normal or impaired renal function.
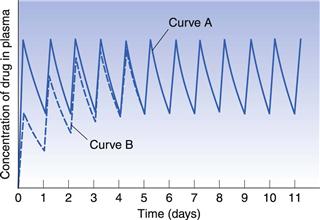
Figure 22.9 indicates the effects produced by changes in the apparent elimination rate constant on the plasma concentration-time curve obtained following multiple oral administration. Any reduction in the apparent elimination rate constant of a drug will produce a proportional increase in the biological half-life exhibited by that drug. This reduction, in turn, will result in a greater degree of accumulation of the drug in the body following multiple administrations before steady-state drug levels are achieved. The greater degree of drug accumulation is a consequence of a smaller proportion of the drug being eliminated from the body over each fixed dosage time interval when the biological half-life of the drug is increased.
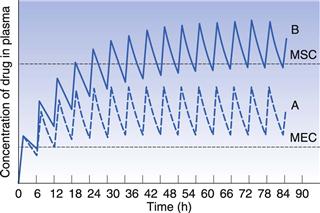
Patients who develop severe renal impairment normally exhibit smaller apparent elimination rate constants and consequently longer biological half-lives for drugs which are eliminated substantially by renal excretion, than do patients with normal renal function. For instance, the average apparent elimination rate constant for digoxin may be reduced from 0.021 h−1 in patients with normal renal function to 0.007 h−1 in severe renal impairment. The average steady-state amount of drug in the body is only achieved and maintained when the overall rate of drug supply equals the overall rate of elimination of drug from the body over successive dosing time intervals. Any reduction in the overall rate of elimination of a drug as a result of renal disease without a corresponding compensatory reduction in the overall rate of drug supply will result in increased steady-state amounts in the body. This effect may, in turn, lead to side-effects and toxicity if the increased steady-state levels of drug exceed the maximum safe concentration of the drug.
In order to illustrate this concept, consider that curves A and B in Figure 22.9 correspond to the plasma concentration-time curves obtained for a given drug in patients having normal renal function and severe renal impairment, respectively, and that the upper and lower dashed lines represent the maximum safe and minimum effective plasma concentrations, respectively. It is evident that administration of a drug according to a multiple dosage regimen which produces therapeutic steady-state plasma levels of drug in patients with normal renal function will result in plasma drug concentrations which exceed the maximum safe plasma concentration of the drug in patients with severe renal impairment. Hence adjustment of multiple dosage regimens in terms of dose size, frequency of administration or both is necessary if patients having renal disease are to avoid the possibility of over-medication.
Summary
This chapter has explained the inter-relationship between the rate at which drug enters the body and the rate at which it leaves. It also discusses how, in turn, this balance influences the concentration of drug in the blood plasma at any given time. It is clearly important for pharmacists and pharmaceutical scientists to understand these concepts in order to find ways of maintaining therapeutic drug levels appropriate to a particular disease state. This can be achieved by the careful design of the appropriate drug delivery system. The design and formulation of modified-release drug delivery systems is discussed fully in Chapter 31.
Bibliography
1. Dhillon S, Kostrewski A. Clinical Pharmacokinetics. London: Pharmaceutical Press; 2006.
2. Gibaldi M. Biopharmaceutics and Clinical Pharmacokinetics. 4th edn Philadelphia: Lea and Febiger; 1991.
3. Rowland M, Tozer TN. Clinical Pharmacokinetics: Concepts and Applications. 4th edn Philadelphia: Lippincott Williams and Wilkins; 2010.
4. Winter M. Basic Clinical Pharmacokinetics. 4th edn Philadelpia: Lippincott Williams and Wilkins; 2003.
[/level-membership-for-basic-science-category][not-level-membership-for-basic-science-category]
Dosage regimens
John H. Collett and Soraya Dhillon
Chapter contents
Dosage regimens: influence on the plasma concentration-time profile of a drug in the body
One-compartment open model of drug disposition in the body
Rate of drug input versus rate of drug output
Elimination rate constant and biological half-life of a drug
Concentration-time curve of a drug in the body following the oral administration of equal doses of a drug at fixed time intervals
Important factors influencing steady-state plasma concentrations of a drug
Dose size and frequency of administration
Population data and basic pharmacokinetic parameters
Influence of changes in the apparent elimination rate constant of a drug: patients with renal impairment
Key points
Dosage regimens: influence on the plasma concentration-time profile of a drug in the body
The design of a dosage regimen determines the therapeutic benefit for patients. The principles of clinical pharmacokinetics are applied to design a dosage regimen for a patient that ensures the appropriate formulation of drug is chosen for an appropriate route of administration. On the basis of the patient’s drug handling parameters, which require an understanding of absorption, distribution, metabolism and excretion, the dosage regimen for the medicine in a particular patient, can be optimized. The pharmacist needs to ensure the appropriate regimen is prescribed to achieve optimal efficacy and minimal toxicity.
Clinical pharmacokinetics provides a basic understanding of the principles required to design a dosage regimen. Pharmacokinetics provides a mathematical basis to assess the time course of drugs and their concentrations in the body. It enables the following processes to be quantified:
It is these four pharmacokinetic processes, often referred to as ADME, that determine the drug concentration in the body following administration of a medicine (see also Chapter 18).
The influence that physiological factors, physicochemical properties of a drug and dosage form factors can have in determining whether a therapeutically effective concentration of a drug is achieved in the plasma following oral administration of a single dose of drug has been discussed previously in Chapters 19 and 20.
Whilst a single dose of certain drugs, e.g. single-dose hypnotics, analgesics and antiemetics, may be used in some clinical situations, most medicines are given as a multiple dosage regimen. For example, for the treatment of a respiratory tract infection, amoxicillin may be prescribed as one 250 mg capsule three times a day. The design of the regimen, i.e. formulation, route of administration, dose size and the dosage frequency are important factors which influence what plasma concentration is achieved and maintained in the body over the prescribed course of drug treatment. Other factors to consider are: patient choice and lifestyle, including the route of administration (the oral route is often preferred by patients), the dosing interval (once, twice or three times a day) needs to be suitable for a patient’s work pattern and the dosage form must be appropriate, for instance a liquid may be preferable to a capsule for young and elderly patients.
Rates of ADME processes
To describe the processes of ADME, there is a need to consider the rates of the various processes. In zero-order reactions, the reaction proceeds at a constant rate and is independent of the concentration of a substance present in the body. An example is the elimination of alcohol. Drugs exhibiting this type of elimination will show accumulation of plasma levels of the drug, and hence non-linear pharmacokinetics. In first-order reactions, the reaction proceeds at a rate which is dependent on the concentration of a drug in the body. Most ADME processes follow first-order kinetics (Chapter 7).
The majority of drugs used clinically at therapeutic dosages will show first-order rate processes, e.g. the rate of elimination of most drugs will be first order. However, some drugs show non-linear rates of elimination, for instance phenytoin and high dose salicylates. First-order rate processes do not result in accumulation, i.e. as the amount of drug administered increases, the body is able to eliminate the drug accordingly. Hence, if the dose is doubled, the steady-state plasma concentration is doubled. Whether a drug shows first- or zero-order elimination is determined by its Michaelis Constant (Km). This parameter is the plasma concentration at which the elimination of the drug proceeds at half the maximum metabolic capacity (Vm). If normal therapeutic plasma levels of the drug exceed the drug’s Michaelis Constant, then the drug will show non-linear drug handling. For most drugs, the Michaelis Constant is much higher than the levels achieved through normal therapeutic use.
One-compartment open model of drug disposition in the body
To understand how the design of a dosage regimen can influence the time course of a drug in the body, as measured by its plasma concentration-time profile, it is important to consider the complex pharmacokinetic processes of: drug input (i.e. administration); output (i.e. elimination/metabolism) and distribution within the body. This can be described using the one-compartment open model of drug disposition, shown in Figure 22.1.
Pharmacokinetic models are hypothetical constructs, which describe the fate of a drug in a biological system following its administration. The purpose of modeling is to characterize the ADME profile for a drug to indicate how the drug is handled by the patient and to characterize basic parameters. These basic parameters describe the fate of the drug following administration and are used to optimize a dosage regimen. In a one-compartment model, the drug is considered to be distributed instantly throughout the whole body following its release and absorption from the dosage form. Thus, the body behaves as a single compartment in which absorbed drug is distributed so rapidly that a concentration equilibrium exists at any given time between the plasma, other body fluids and the tissues into which the drug has become distributed.
Rate of drug input versus rate of drug output
In a one-compartment open model, the overall kinetic processes of drug input and drug output are described by first-order kinetics. Following administration of an oral dosage form, the process of drug input into the body compartment involves drug release from the dosage form and passage of drug (absorption) across the cellular membranes, in this case the gastrointestinal barrier. The rate of drug input (absorption) at any given time is proportional to the concentration of drug, which is assumed to be in an absorbable form, in solution in the gastrointestinal fluids at the site(s) of absorption, i.e. the effective concentration, Ce, of drug at time, t.
Hence:
(22.1)
and
(22.2)
where ka is the apparent absorption rate constant.
The negative sign in Equation 22.2 indicates that the effective concentration of drug at the absorption site(s) decreases with time. The apparent absorption rate constant gives the proportion (or fraction) of drug which enters the body compartment per unit time. Unlike the rate of drug input into the body compartment, the apparent absorption rate constant, ka, is independent of the effective concentration of drug at the absorption site(s). The rate of drug input will decrease gradually with time as the effective drug concentration at the site of absorption decreases (assumes first-order absorption). Other processes, such as chemical degradation and movement of drug away from the absorption site(s), will also contribute to the gradual decrease in the drug concentration with time at the absorption site.
In the case of a one-compartment open model, the rate of drug output or elimination is a first-order process. Consequently, the magnitude of this parameter at any given time is dependent on the concentration of drug in the body compartment at that time. Immediately following administration of the first dose of an oral dosage form, the rate of drug output from the body, i.e. elimination, will be low since a limited amount of drug has been absorbed into the body compartment. However, as absorption proceeds, initially at a higher rate than the rate of drug output, the net concentration of drug in the body will increase with time. As the rate of drug output from the body compartment increases whilst the rate of drug input into the body compartment is decreasing with time, there will be a point at which the rate of drug input is equal to the rate of drug output, such that the net concentration of drug in the body compartment will reach a peak value (Cmax) and then begin to fall with time. At this stage, the rate of drug output exceeds the rate of drug input.
These changes in the rates of drug input and output, relative to each other, with time are responsible for the characteristic shape of the concentration-time course of a drug in the body shown in Figure 22.2 following oral administration of a single dose of a drug.
The shape of the curve is determined by the relationship between the rate of absorption and the rate of elimination. The greater the rate of drug input relative to the rate of drug output from the body compartment over the net absorption phase, the higher will be the peak concentration achieved in the body or plasma following oral administration of a single dose of drug. This explains why increases in dose size and formulation changes in dosage forms, which produce increases in the effective concentration of drug at the absorption site(s), result in higher peak plasma and body concentrations being obtained for a given drug. It should also be noted that any unexpected decrease in the rate of drug output relative to the rate of drug input, which may occur as the result of renal impairment or poor drug metabolism, is also likely to result in higher plasma and body concentrations of drug than expected, and the possibility of the patient exhibiting toxicity. The adjustment of dosage regimens in cases of patients having severe renal impairment is considered later.
Elimination rate constant and biological half-life of a drug
In the case of a one-compartment open model, the rate of elimination or output of a drug from the body compartment follows first-order kinetics and is related to the concentration of drug, Ct, remaining in the body compartment at time t, by the following equation:
(22.3)
where ke is the apparent elimination rate constant. The negative sign in Equation 22.3 indicates that elimination is removing drug from the body compartment.
The apparent elimination rate constant of a drug gives the proportion, or fraction, of that drug which is eliminated from the body per unit time. Its units are in terms of time−1. The apparent elimination constant of a given drug thus provides a quantitative index of the persistence of that drug in the body.
For example the fraction of drug remaining after time t is calculated from:
(22.4)
where is the starting concentration. e−kt is the fraction of drug remaining and the fraction eliminated is given by:
(22.5)
Application of these equations is shown in Box 22.1.
Box 22.1 Calculation of the fraction of drug eliminated from and remaining in the body with time
A patient has an elimination rate constant of 0.08 hr−1. If the patient has a starting plasma concentration of drug, , of 16 mg/L, then at 4 hours the fraction remaining in the body (Ct) is equal to e−kt. Thus:
Ct = 16 e−0.08×4
Ct = 11.6 mg/L, i.e. 72.6% of the drug is remaining
and the fraction of drug eliminated is:
1 – e−kt = 27.4%
An alternative parameter used is the biological or elimination half-life of the drug, t1/2
[/not-level-membership-for-basic-science-category]
