Chapter 172 Degenerative Disease and Infection
Role of Imaging
Degenerative Disease
The term degeneration is commonly applied to a variety of pathologic and imaging manifestations of spine morphology, reflecting the complexity of the process and gaps in our current knowledge. The distribution of axial load is responsible for the typical locations of spine degeneration. C5-6 and C6-7 levels are involved in most cases, because they are the sites of lordosis reversal. The thoracic spine, because of its lesser mobility, is less often affected by degeneration. L4-5 and L5-S1 are the most commonly affected levels because they are the sites of the highest dynamic and static loads.1,2 Because degenerative spine sequelae are among the leading causes of functional incapacity and chronic disability, further research in the epidemiology, pathology, imaging, biomechanics, and therapeutics is warranted.
Low Back Pain
The natural history of low back pain (LBP) with or without radiculopathy is not clearly understood. Traditional practice suggests that imaging has no role in evaluating back pain unless associated signs and symptoms are suggestive of a potentially treatable condition related to trauma, instability, infection, or malignancy. Foregoing imaging in these circumstances may not seriously affect the outcome in most patients and, in fact, may improve conservative management by avoiding the detection of confounding altered morphology. Because back pain is typically a recurrent problem, physicians and patients should benefit from information related to patient group stratification, prognosis for recovery from acute episodes, and likelihood of recurrence.3
Low Back Pain with Radiculopathy
Patients with LBP with radiculopathy constitute a relatively less diverse group in terms of etiology, and the symptoms usually suggest nerve root compression. Multiple authors4–6 suggest that an imaging study is indicated for the evaluation of back pain and associated sciatica when (1) true radicular symptoms are present; (2) there is evidence of nerve root irritation on physical examination (i.e., positive straight-leg raise test); and/or (3) “conservative management” of 4 to 6 weeks’ duration has failed. Earlier imaging is considered appropriate if clinical features raise concern regarding malignancy or infectious pathology or if neurologic findings worsen during observation. These recommendations are based on several studies of the successful nonoperative treatment of sciatica.7–10 Thus, imaging is recommended only for the remaining minority of patients with persistent signs and symptoms who are felt to be surgical candidates or in whom diagnostic uncertainty remains.
Role of Early Imaging
The use of diagnostic imaging earlier in the course of a patient’s symptoms is supported by the following evidence: (1) patients with herniated discs treated surgically have better short-term outcomes than those treated conservatively10,11; (2) the earlier the surgery the better the outcome12; and (3) surgery is cost-effective compared with conservative management (though this varies with the type of surgery).13,14 However, the potential reduction in morbidity from early intervention requires the identification of accurate prognostic indicators, be they clinical or imaging based. Certainly, more than morphology is a factor. As has been suggested by Postacchini,15 two needs likely require consideration: (1) protracted conservative treatment may lengthen the time off from work and reduce the chances of successful surgical treatment; and (2) surgery should be avoided in patients with a herniated disc that may become asymptomatic or even disappear within a few months of onset. Thus, the possible benefits of imaging for degenerative diseases of the spine, other than as a presurgical tool, have never been carefully documented and quantified. Predicting which patients will benefit from imaging is a complicated and controversial subject. Its use as a preintervention planning tool is critical, but its employment for diagnostic information per se is less well accepted and the subject of much debate. Nevertheless, if imaging could be employed to prospectively determine which patients will not do well with surgery or other types of therapy, it would be of great value. Conversely, its use to identify patients undergoing prolonged conservative treatment who require more aggressive therapy (e.g., surgery) might be equally beneficial. This would save the cost of lost work, medical expenses, and personal discomfort. Clearly, there is little consensus, either within or among specialties, on the use of diagnostic tests for patients with back pain.16 The diagnostic evaluation depends heavily on individual physicians, their specialties, and patient socioeconomics, in addition to the patient’s symptoms.16,17 On the other hand, patients with underlying risk factors (“red flags”), mainly, infection, trauma, and malignancy, warrant early imaging for timely intervention.
Counting Reference
The topic is discussed in detail in Chapter 175. It is extremely important that counting reference is clearly stated in the spine imaging report. This is to avoid wrong level surgeries with potential medico-legal implications. The two major factors responsible for discrepancy are (1) a transitional vertebra, which can be a sacralized L5 or lumbarized S1, and (2) variations in the number of rib-bearing vertebrae. Lumbosacral transitional vertebra (LSTV) is a common finding in the general population. Identification of LSTV on imaging is the essential first step in the interpretation of lumbar and thoracic imaging.18 The coronal MRI localizer image of the thoracic and lumbar spine can be useful because L4-5 is generally at the level of the iliac crest. Some prefer to use a vitamin E back-skin marker at an overlapping level in the thoracic spine, which, however, requires imaging of the entire spine. The iliolumbar ligament is easily identified on axial MRI and can be used as a marker of L5.19 There is a greater tendency of counting the lowest lumbar-type intervertebral disc space as L5-S1. Nevertheless, it is crucial that these approaches and variations be specified and clearly communicated in the report.
Plain Radiography
Plain radiography (PR) is still a very useful and cost-effective diagnostic tool by virtue of its availability and efficiency.20 PR is generally used in trauma, for screening of degenerative disease, and for evaluation of sagittal translation using flexion-extension views. PR can aid MRI in characterization of disc disease by better demonstration of vacuum phenomena, disc calcification, bridging osteophytosis, and dorsal longitudinal calcification (though less common in the thoracolumbar spine). Conventional screen-film imaging has been nearly completely replaced by digital acquisition modalities, using either imaging plates (computed radiography, CR) or flat-panel detectors (direct radiography, DR).
Routine Magnetic Resonance Imaging
Unlike CT and conventional radiography, which depend on information related to electron density, proton MR signals are influenced by the T1 and T2 relaxation time, proton density, and motion (both macro and micro) to provide greater tissue contrast. Thus, its role may go beyond gross anatomic appraisal to actual tissue characterization of pathology and biochemical change. The routine sequences and their significance are as follows: (1) sagittal T1 to evaluate bone marrow infiltration and end-plate bone marrow degenerative changes; (2) sagittal T2 to evaluate disc and end-plate degeneration, thecal sac extrinsic impression, the conus medullaris, and the cauda equina morphology; and (3) sagittal STIR to detect bone marrow and paraspinal soft tissue edema. Axial T1 and T2 basically confirm the findings on sagittal imaging and provide a better assessment of central canal/thecal sac narrowing, cauda equina abnormalities, facet disease, and lateral disc herniations. The major degrading factors are patients’ gross motion, positioning, body habitus, and instrumentation.
Magnetic Resonance Myelography
MR myelography (MRM) is currently not practiced routinely in the United States for two major reasons: (1) Intrathecal gadolinium is not yet approved by the FDA, and (2) MRM has no significant added advantage compared with a CT myelogram or conventional MRI.21,22 MRM is, however, comparably accurate in detecting CSF leaks in patients with intracranial hypotension compared with radioisotope cisternography.23
Open and Large-Bore Magnetic Resonance Imaging
The open-design MRI systems enable imaging of those who are claustrophobic and overweight and offer the potential of dynamic imaging. The major penalty is some compromise of the image quality due to decreased signal-to-noise ratio. However, the diagnostic information is satisfactory in most cases.24,25 Closed high-magnetic-field scanners with short magnets and wide-bore tubes offer patients improved comfort and lessen anxiety.26
Dynamic Imaging and Upright Magnetic Resonance Imaging
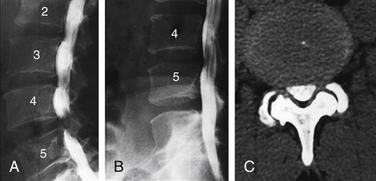
Sagittal segmental lumbar motion is traditionally assessed with lateral flexion-extension radiographs. These dynamic studies often demonstrate a decrease in the slip percentage between the vertebral segments with extension and an increase with forward flexion. Ironically, the degree of spondylolisthesis can actually improve on the lateral film taken on the operating table in an anesthetized patient.27 Somewhat analogous to the flexion-extension imaging, supine-prone imaging of the lumbar spine can also be more sensitive by showing a higher degree of listhesis in the prone position.28 Position-dependent stenosis can be demonstrated on the lateral myelogram in flexion-extension postures, which would otherwise have been underestimated on the follow-up CT myelogram29 (Fig. 172-1). Ben-Galim and Reitman in a study of a small group of patients showed position-dependent severe spinal canal stenosis on CT myelography with grade I or II spondylolisthesis. Additionally, they showed fluid-filled distended facet joints, a marker of positional translation.30 Imaging findings on supine MRI may correlate poorly with clinical findings. This may be related to the positional dependence of spinal stenosis, which reflects dynamic changes in soft tissue structures. Therefore, it is potentially valuable to evaluate spinal disorders under mechanical loading. Hydraulic axial-loading devices have also been tried.31 Upright MRI in different postures can reproduce the positions that bring about their symptoms and may unmask findings that are not visible with routine supine imaging. Small disc herniations and ventral spondylolisthesis can be unmasked, and disc herniations can be increased in size on upright MRI compared with recumbent MRI.32 Assessment of the degree of spinal stability in the degenerative and postoperative lumbar spine can also be performed.33,34 Kinetic magnetic resonance images (kMRIs) in axially loaded, upright-neutral, flexion-extension positions can also accentuate the size of the disc herniations and play a potential problem-solving role in radiculopathy with negative supine static imaging.35 Clearly, axial loading changes anatomic relations. The significance of the findings in terms of therapeutic decision making is not very clear.36
Morphologic Alterations on Imaging
Standardized reporting is a better means of communication and consistent reporting, as well as a useful source of database research. Given the complexity, inconsistency, and overlapping of terminology used to discuss the spine over the years, standardized report generation in spine imaging is needed the most to describe the morphologic alterations in the spine. A consensus-based terminology recommended by Millette et al.37 is used in this chapter. It must be clearly understood that these terms are descriptive only and, in and of themselves, independent of the test. It cannot be overemphasized that these terms do not imply knowledge of etiology, symptoms, prognosis, or need for treatment. Recently, Carrinno et al.38 showed moderate reliability in the interpretation of qualitative nondisc contour degenerative findings on lumbar MRI.
Disc Degeneration
The term disc degeneration is used for a variety of changes, including any or all of the following: real or apparent desiccation, fibrosis, narrowing of the disc space, bulging, fissuring or mucinous degeneration of the anulus, osteophytes of the vertebral apophyses, and end-plate/adjacent marrow changes. MRI and CT show disc space narrowing, T2-weighted signal intensity loss from the intervertebral disc, presence of fissures, fluid, vacuum changes and calcification within the intervertebral disc, ligamentous signal changes, marrow signal changes, and osteophytosis. These alterations result in disc herniation, malalignment, and spinal canal stenosis. Conventional theory suggests that aging and degeneration are very similar processes, albeit occurring at different rates. Historically, the two processes have been characterized morphologically and termed as spondylosis deformans and spondylosis osteochondrosis (deteriorated disc), respectively. The former affects the anulus fibrosus and adjacent apophyses, whereas the latter mainly affects the nucleus pulposus and the vertebral body end plates, particularly fissuring (numerous tears) of the anulus fibrosus. Scientific evidence suggests that spondylosis deformans is the consequence of normal aging, whereas intervertebral osteochondrosis represents a pathologic, though not necessarily symptomatic, process.39 Anteriolateral osteophytosis is a reliable marker of spondylosis deformans, with a 100% incidence above 40 years.39 Disc degeneration and aging are multifactorial processes that encompass a wide spectrum of changes and sequelae, of which the radial tear is but one. Disc degeneration may be explained primarily by genetic influences and complex unpredictable interactions of unidentified factors.
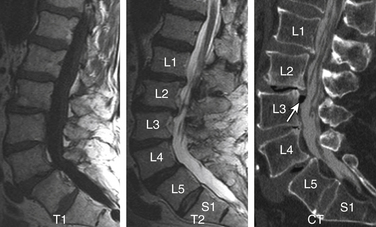
The nucleus pulposus is eccentrically located and more closely related to the dorsal surface of the intervertebral disc. With degeneration and aging, type II collagen increases outwardly in the anulus, and water loss from the nucleus pulposus is greater than from the anulus. This results in a loss of the hydrostatic properties of the disc, with an overall reduction of hydration in both areas to about 70%. In addition to water and collagen, the other important biochemical constituents of the intervertebral disc are the proteoglycans. It is not the individual composition but the relative composition of these constituents that in turn affects the hydrostatic properties and tensile strength of the intervertebral disc. The ratio of keratin sulfate to chondroitin sulfate increases. The disc becomes progressively more fibrous and disorganized, with the end stage represented by amorphous fibrocartilage and no clear distinction between nucleus and anulus. The degenerating disc manifests as diminishing T2 signal and loss of internal lamellation. T2 measurements also correlate with glycoaminoglycan concentration rather than absolute water content. So, it is not just the absolute concentration of water but also the state of water involved in the disc degeneration. The status of the proteoglycans is thus a major determinant of disc space T2 and T1 signal39–41 (Fig. 172-2).
Anular Tears
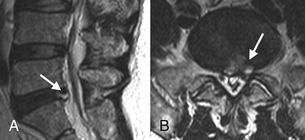
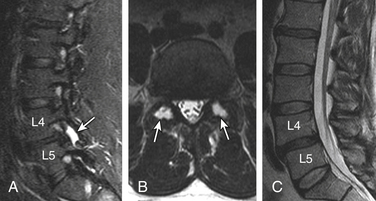
Also called anular fissures, anular tears are separations between anular fibers, avulsion of fibers from their vertebral body insertions, or breaks through fibers that extend radially, transversely, or concentrically and involve one or many layers of the anular lamellae. The term tear, or fissure, describes the spectrum of such lesions and does not imply that the lesion is a consequence of trauma. Although it has certainly been verified that anular disruption is a sequela of degeneration and is often associated with it, its role as the causal agent of disc degeneration has certainly not been proved. Anular disruption initiates a reparative process as it is replaced by dense fibrous tissue and cystic spaces.42–45 Fissuring, chondrocyte generation, and granulation tissue formation have been noted within the end plate, anulus fibrosus, and nucleus pulposus of degenerative discs, indicating attempts at healing.39 Anular tears are commonly seen in the dorsal bulging discs as focal T2 hyperintensity on T2 and STIR imaging; there may be associated small disc protrusion. Anular tears consistently show focal contrast enhancement46 (Fig. 172-3).
Disc Gas “Vacuum Phenomenon”
Radiolucent foci on CT or plain films representing gas, principally nitrogen, occur at sites of negative pressure produced by the abnormal spaces. The vacuum phenomenon within a degenerated disc is represented on spin echo images as areas of signal void. Whereas the presence of gas within the disc is usually suggestive of degenerative disease, spinal infection may (rarely) be accompanied by intradiscal or intraosseous gas.47 A protruding disc with a vacuum phenomenon can present as epidural gas foci on CT and hypointensities on MRI (see Fig. 172-2).
Disc Calcification and T1 Hyperintensity
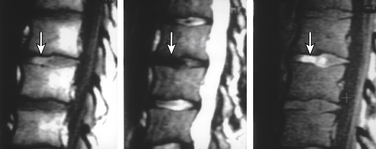
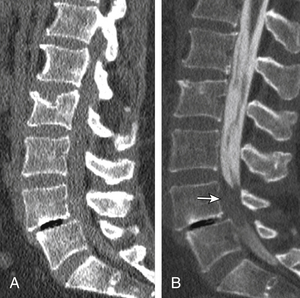
Patchy, partial, or complete calcification of the disc space can be seen either as an isolated finding without degenerative stigmata or as a chronic dystrophic change in a degenerated disc. The clinical significance of a calcified disc is unknown. The disc space on CT and plain films can appears as fused, perhaps “autofused.” Calcification, depending on its biochemical status, can appear as hyperintense or hypointense on sagittal T1 imaging. Furthermore, the hyperintense T1 disc may represent an ossified disc, as can be proven by loss of signal on fat-suppressed MRIs due to lipid marrow. A calcified disc is easily demonstrable on CT (Fig. 172-4).
Degenerative Marrow Changes
The anulus fibrosus, vertebral end plate, and vertebral body have an interreactive relationship in the degenerative process, as is also evident from the model of chymopapain-treated discs.48,49 Paradiscal MR signal changes in the end plate and vertebral bodies take three forms.
Type I Changes
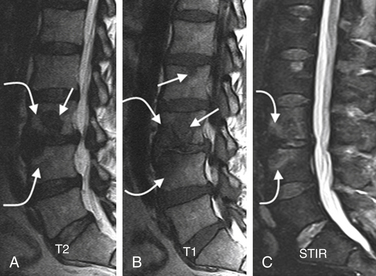
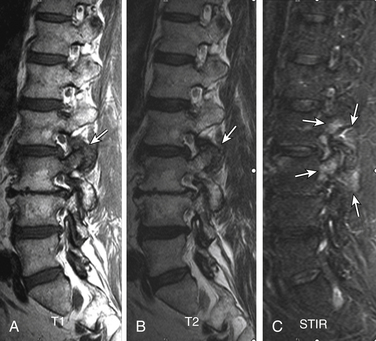
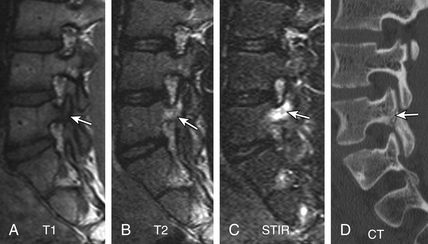
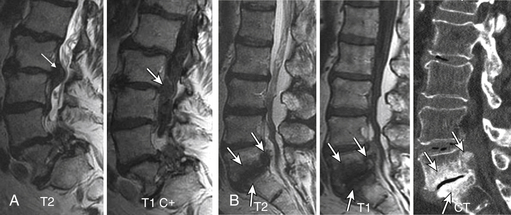
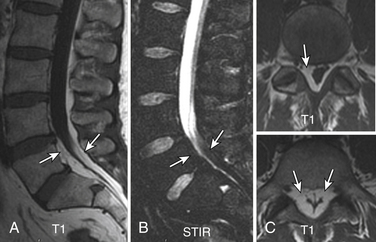
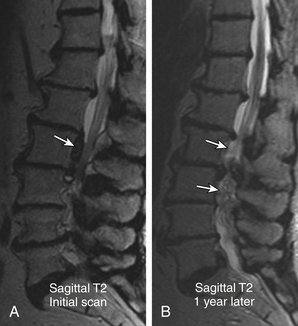
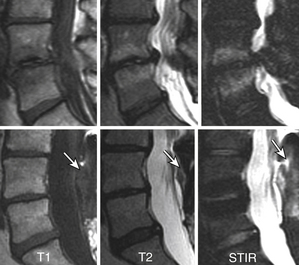
Type I changes demonstrate decreased signal intensity on T1-weighted images and increased signal intensity on T2-weighted images. Type I change is found in about 4% of nonsurgical lumbar spines, 8% in postdiscectomy discs, and 40% to 50% of chymopapain-treated discs.48–50 The last group can be used as a model of acute disc degeneration. Histopathology of type I changes demonstrates disruption and fissuring of the end plate and vascularized fibrous tissues within the adjacent marrow, accounting for prolonged T1 and T2 MR signal. Enhancement of type I vertebral body marrow changes is seen with administration of IV gadolinium. The enhancement may involve a portion of the disc itself and is presumably related to the vascularized fibrous change. The type I signal is expectedly accentuated on STIR, mimicking bone marrow edema, and may be very difficult in some cases to differentiate from discitis osteomyelitis (discussed later under the differential diagnosis of vertebral osteomyelitis; Fig. 172-5).
Type II Changes
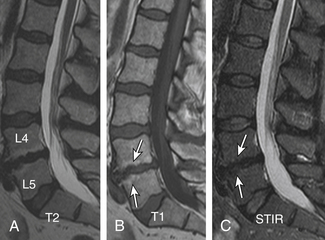
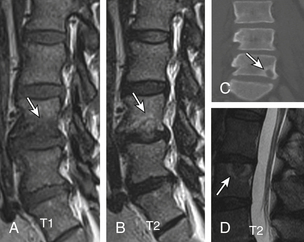
Type II changes are represented by increased signal intensity on T1-weighted images and isointense or slightly hyperintense signal on T2-weighted images. Type II changes are identified in approximately 16% of patients on MRI.48–50 Discs with type II changes, like type I, show evidence of end-plate disruption, with fat marrow in the end plate and adjacent vertebral body resulting in T1 hyperintensity due to T1 shortening (Fig. 172-6).
Type III Changes
Type III changes are represented by a decreased signal intensity on both T1- and T2-weighted images due to extensive bony sclerosis, as evident on plain radiographs and CT. The first two types show no definite correlation with sclerosis seen at radiography, which is not surprising when one considers the histology. The sclerosis on plain radiographs is a reflection of dense woven bone within the vertebral body rather than of the marrow elements. The lack of signal in the type III change represents the relative absence of marrow in areas of advanced sclerosis (see Fig. 172-17B).
Facets, Pedicles, and Ligamentous Changes
The superior articulating process of one vertebra articulates with the inferior articulating process of the vertebra above by a synovium-lined articulation—the zygapophyseal joint. The lumbar facet joints are predisposed to arthropathy with alterations of the articular cartilage. Facet joint degeneration results in hypertrophic changes (osteophytosis), joint effusions, synovial cyst formation, and rostrocaudal subluxation. Mild to moderate facet joint osteophytosis is commonly seen in the lumbar spine at L4-5 and L5-S1 and is more suggestive of age-related change.51,52 The important ligaments of the spine include the anterior longitudinal ligament, the posterior longitudinal ligament, the paired sets of ligamenta flava (connecting the laminae of adjacent vertebrae), the intertransverse ligaments (extending between transverse processes), and the unpaired supraspinous ligament (along the tips of the spinous processes). As these ligaments normally provide stability, any alteration in the vertebral articulations can lead to ligamentous laxity with subsequent deterioration. Loss of elastic tissue, calcification and ossification, and development of bone proliferation at sites of ligamentous attachment to bone are recognized manifestations of such degeneration.
Facet and Disc Degeneration
Generally, disc degeneration dominates facet arthropathy. Some degree of facet arthritic changes usually accompanies disc degeneration. Is facet disease a sequela of disc degeneration? The answer to this question is debatable, but at least it is clear that disc degeneration is more common and generally precedes facet joint arthropathy. Due to altered mechanics, disc degeneration probably accelerates facet joint arthropathy.51–54 A systemic component is hypothesized to account for facet arthrosis since there is a high incidence of concurrent lumbar and cervical facet arthrosis.55 Osteophytosis of the facet joints is, to a degree, a counterpart of end-plate osteophytosis and specifically contributes to lateral recess and foraminal stenosis. Facet arthrosis may occur independently and be a source of symptoms on its own.56 A smaller group of lumbar spines in our experience show dominant facet and ligamentous degenerative hypertrophic changes with absent to minimal degenerative disc changes.
Facet Joint Effusions
Pencil-thin homogeneous bilateral facet joint effusion is a common and normal finding in the lower lumbar spine. In an arthritic facet joint, synovial villi may become entrapped within the joint, with resulting joint effusions. STIR is the best method for demonstrating joint effusions. Large joint effusions (>1.5 mm) are highly predictive of degenerative spondylolisthesis on dynamic imaging, particularly at L4-557 (Fig. 172-7).
Synovial Cysts
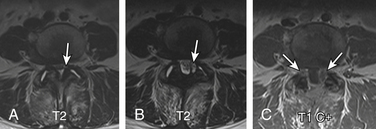
Herniation of the synovium through the facet joint capsule may result in synovial cysts. In a review of patients with degenerative facet disease, synovial cysts occurred at a ventral or intraspinal location in 2.3% of cases and dorsal or extraspinal location in 7.3%.58 There is a more straightforward relationship of synovial cysts with osteoarthritis and the instability of the facet joints than degeneration of the intervertebral disc alone.57 Intraspinal synovial cysts can be symptomatic, depending on their size. Typically, synovial cysts have T2 hyperintense cystic appearance, but signal intensity can vary due to debris, hemorrhage, gas, and superimposed infection. The cyst may exhibit rim enhancement (see Fig. 172-24). Distinguishing the synovial disc from the herniated disc is not usually difficult due to its location and MR characteristics. A dorsolateral extradural impression and associated juxtafacet asymmetrical soft tissue density on CT myelogram is a nonspecific finding; asymmetrical facet joint arthritis can be helpful in such cases.
Dorsal Elements and Paraspinal Edema
Routine use of STIR and similar sequences has resulted in increased detection of dorsal elements and paraspinal soft tissue edema.59,60 Facet joint degenerative arthritis can result in para-articular and pedicular edema, joint effusion, and para-articular soft tissue edema. In patients at high risk, it may be difficult to differentiate from infected facet joints. The signal changes and sclerosis in the pedicles can be seen secondary to facet joint arthritis and underlying pedicle or pars fractures. The greatest mechanical stress is on the pars interarticularis, followed by pedicles as shown by Sairyo et al.61 These stresses can result in a spectrum of reactive bone marrow changes in the pars and pedicles. T2 hyperintense signal in the pedicles has been shown as an early marker of spondylolysis.61 There is evidence that categories of changes in MR signal intensity, similar to those described adjacent to degenerating discs, can be seen in lumbar pedicles adjacent to a spondylolytic defect of the pars interarticularis62 (Figs. 172-8 and 172-9).
Morphologic and Functional Sequelae
Segmental Instability
Each level in the thoracolumbar spine consists of three joints: intervertebral disc space and bilateral facet joints. Degeneration of these joints results in segmental instability replacing the normal spinal motion, which can be irregular, excessive, restricted, translational, and/or angular. Segmental instability, which can cause static and dynamic stenosis, is considered a cause of LBP but is poorly defined.63 On flexion-extension plain radiography, generally about 3 mm or more of sagittal translation is equated with instability. Spondylolisthesis is a term used in static imaging and refers to intervertebral displacement—anterolisthesis, retrolisthesis, or lateral listhesis. The different types, based on etiology, include congenital, degenerative, isthmic, iatrogenic, pathologic, and traumatic (Fig. 172-10).
Grading of Spondylolisthesis
Spondylolisthesis in the sagittal plane can be graded by one of two methods, independent of the imaging modality and type of spondylolisthesis.64 The first is the method described by Meyerding.65 The anteroposterior (AP) diameter of the superior surface of the lower vertebral body is divided into quarters, and a grade of I to IV is assigned to slips of one, two, three, or four quarters of the superior vertebra, respectively. The second method, first described by Taillard,66 expresses the degree of slip as a percentage of the AP diameter of the top of the lower vertebra. Complete slip of L5 on S1 is termed spondyloptosis. The second method is favored by most authors as it is more accurately reproducible.67 Measurement of the slip and its apparent progression, however, should be viewed with caution. Studies have shown that inter- and intraobserver error of up to 15% is possible. This variation can increase if an element of rotation is present. Therefore, only a progression of greater than 20% slip can be reliably assessed.68,69
Degenerative Spondylolisthesis
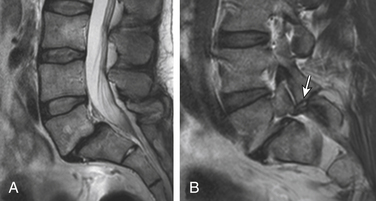
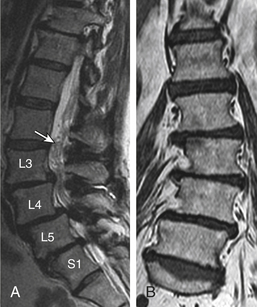
Degenerative spondylolisthesis (DS), which is usually seen with an intact pars interarticularis, is related to degenerative changes of the apophyseal joints and/or intervertebral discs and is most common at the L4-5 and L5-S1 vertebral levels. Lumbar DS is a major cause of spinal canal stenosis and is often related to low back and leg pain.70 Long-standing DS is almost invariably accompanied by disc and facet degenerative changes, which obscure the origin of the process. Discogenic DS and facetic DS cause secondary stress and stretch on the facet joints and disc spaces, respectively. The degree of sagittal listhesis is generally mild in DS relative to other types, particularly isthmic spondylolisthesis. There may be associated degenerative scoliosis and listhesis in nonsagittal planes. Type I end-plate changes, which may be more extensive and quite prominent on a STIR sequence, even without spondylolisthesis on static imaging, may represent segmental instability71 and can mimic discitis osteomyelitis, as discussed later (Fig. 172-11).
Pseudarthrosis
Nonunion of Bone Fusion
Nonunion is the result of failed spinal fusion. The failed fusion typically manifests with axial or radicular pain months to years after surgery. The common causes of this complication are inadequate surgical technique, excessive stresses across the fusion site, insufficient internal or external stabilization, and unrecognized metabolic abnormalities.72 Diagnosis is based on clinical presentation and imaging studies, after other causes of persistent pain are excluded.73 The degree of fusion and associated motion seen on flexion-extension radiographs that is indicative of solid or failed fusion remains a point of controversy due to significant interobserver variations.74 The choice of bone graft material can affect the radiographic assessment of interbody fusion. CT has higher contrast resolution and is therefore better than radiography for assessment of bone fusion. One of the main reasons for CT’s superiority is that premineralized osteoid may be functionally fused but radiographically lucent, therefore leading to underestimation on plain radiography. Bony arthrodesis is usually evident by 6 months, with evidence of bridging trabecular bone. Bridging bone is usually seen lateral to the implant and may also be noted within the implant itself. Mature solid fusion is generally present at between 12 and 24 months75,76 (Fig. 172-12).
Disc Space Failed Fusion
Failed fusion at the disc space manifests as lucency at the device margins or lucent lines through the fusion mass by about 18 to 24 months. Lucency around the fusion devices (e.g., cage or pedicular screws) represents abnormal motion and predicts delayed or failed fusion. Cystic change at the end plates adjacent to the implant is a reliable marker of failed fusion. Other signs include malpositioning and subsidence of the fusion devices74–76 (see Fig. 172-12).
Posterolateral Failed Fusion
Posterolateral failed fusion is divided into three types: Type I shows atrophy and resorption of the grafted bone; type II shows a lack in trabecular continuity of the fusion mass; and type III shows a gap either cranially or caudally between the fusion mass and lumbar matrix (which includes the transverse process and superior facet). CT is better than PR for diagnosing all types of posterolateral failed fusion, particularly type III77 (see Fig. 172-12).
Transitional or Segmental Pseudarthrosis
Segmental pseudarthrosis is usually secondary to transition of the mechanical loading to the adjacent level above the surgical fusion or fusion due to ankylosing spondyloarthropathies and advanced degenerative processes. Neuropathic spine (Charcot spine) can also result in segmental pseudarthrosis. The typical CT imaging pattern is lucency through the ventral and dorsal pillars in a transverse plane with or without associated spondylolisthesis. MRI shows corresponding hyperintense T2 (fluid) signal in the transverse plane defects and variable end-plate signal changes (see Fig. 172-12).
Intervertebral Disc Displacement (Disc Herniation)
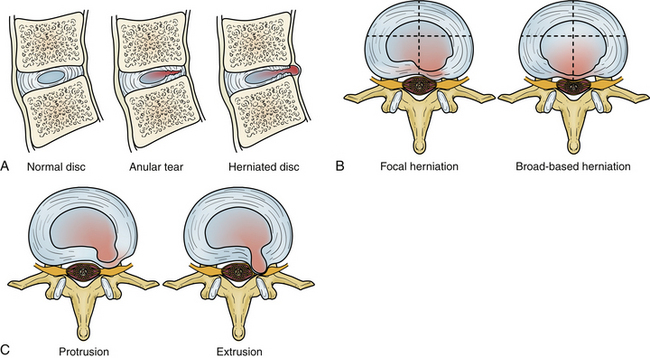
Degeneration allows the disc to displace focally or diffusely in any direction beyond the end-plate margins of the disc space. The anulus fibrosus in a displaced disc tries to contain or limit the herniating nucleus pulposus. A variety of terms are used to describe disc displacement. See Figure 172-13 for diagrammatic representation of disc displacements.
Anular Disc Bulge
An anular bulge is a generalized extension, greater than 50% of the circumference of the disc tissues to a short distance (<3 mm) beyond the edges of the apophyses. A bulge is not a herniation; it is generally diffuse and may be asymmetrical. The latter usually occurs when associated lateral listhesis and scoliosis are present. The nucleus pulposus is contained by the anulus fibrosus. Grading of the disc bulging is subjective. Associated end-plate hypertrophy (spondylosis) may be present but is less prominent than in the cervical spine. Disc bulging may show crescentic calcification along its dorsal margin on sagittal CT (see Fig. 172-11A).
Protrusions
Protrusions are disc displacements in which the greatest distance in any plane between the edges of disc material beyond the disc space is less than the distance between the edges of the base in the same plane (neck is broader than dome). Protrusion is still contained by the anulus fibrosus fibers and therefore is not a true herniation. There may be an associated anular tear, which is usually evident on MRI as T2 hyperintensity, typically in the dorsal or dorsolateral disc protrusions. If the protrusion is less than 25% of the disc circumference, it is referred to as focal, and if between 25% and 50%, it is referred to as broad-based (Fig. 172-14).
Extrusions
Extrusions are disc displacements that are true herniations in which in at least one plane, any one distance between the edges of the disc material beyond the disc space, is greater than the distance between the edges of the base in the same plane (dome is broader than neck). Extrusions usually extend above or below into the suprapedicular or infrapedicular zone, resulting in further narrowing of the neck but still abutting the native disc. The signal intensity of the extruded portion may be increased on T2-weighted images. There may be associated curvilinear areas of decreased signal intensity on the T2-weighted images, which are related to torn portions of the anulus and posterior longitudinal ligament (Fig. 172-15).
Sequestration
Sequestration is displaced disc material that has completely lost any continuity with the parent disc. The extrusion is referred to as “migrated” if it has displaced from the site of extrusion, regardless of whether it is sequestrated. Sequestrated fragments can lie ventral to the posterior longitudinal ligament (especially if they have migrated behind the vertebral bodies where the posterior longitudinal ligament is not in direct opposition), dorsal to the ligament, rarely in the intradural or intraradicular space, and even in the dorsal extradural space.78 Nevertheless, penetration almost invariably occurs through the posterior longitudinal ligament; either dorsal, where it is fused with the anulus, or rostrally or caudally, where it fuses with the vertebral body margin. In the majority of patients in whom sequestrated fragments migrate behind the vertebral body, the sequestration usually lateralizes, with disc material pushing across the midline and the leading edge being smoothly capped. It has been postulated that this shape is imposed by a midline septum in the ventral epidural space. This space is largest in the lower lumbar region and is delineated dorsally by the posterior longitudinal ligament and laterally attached membranes and ventrally by the vertebral body. It is divided into two compartments by a sagittally aligned septum. Sequestrated fragments within the lateral recess and the neural foramen have been shown to produce eroded cortical bone and expansion of those spaces and, thus, should be considered in the differential diagnosis of a mass arising and expanding the neural foramen and lateral recess. Intradural disc herniation is very rare, with few cases reported.79,80 It is most frequent in the lower lumbar spine. The mechanism is thought to be the development of chronic inflammation leading to adhesions between the dura mater and posterior longitudinal ligament. The appearance on axial MRI is described as a “hawk-beak sign.”81 As the herniated disc penetrates, the ligament extends through the dura instead of pushing it away. Other possible causes are congenital connections between the ligament and the dura or previous surgery (Fig. 172-16).
Imaging Characterization of a Disc Herniation
Hyperintense zone (HIZ) in a disc has been used in correlative studies of MR and provocative discography. This nonstandard term generally represents anular tears.82,83
Compression of the nerve root within its sleeve may not correlate with patient symptoms. A grading system by Pfirrmann et al.84 had significant reliability and surgical correlation:
Grade 0 (normal): No contact of disc material with the nerve root.
Grade 1 (contact): Visible contact of disc material with the nerve root and loss of the epidural fat layer between the two.
Grade 2 (deviation): The nerve root is displaced dorsally by disc material.
Grade 3 (compression): The nerve root is compressed between disc material and the wall of the spinal canal; it may appear flattened or be indistinguishable from disc material (see Fig. 172-15B).
A herniated disc may be densely calcified, which may not be easily predictable on preoperative MRI. An isointense to hyperintense T1 signal can be helpful in such cases. CT clearly demonstrates calcification of disc herniation and ossification of the posterior longitudinal ligament (Fig. 172-17).
Intravertebral Disc Herniations (Also Known as Schmorl Nodes)
Nonacute Schmorl node (SN) intrabody herniations are common spinal abnormalities regarded as incidental observations. They have been reported in 38% to 75% of the population.85,86 Most intrabody herniations probably form after axial loading trauma, with extrusion of nuclear material through the vertebral end plate, resulting in reactive bone marrow edema. Another theory is that Schmorl nodes are the end result of ischemic necrosis beneath the cartilaginous end plate, with secondary herniation into the body of the vertebra.87 SNs are mostly well defined and have an isointense intrinsic T1/T2 signal to the disc.88 SNs have been traced to episodes of significant, sudden-onset, localized, nonradiating back pain and tenderness. Wagner et al.89 showed in symptomatic patients that 57% of cases on MRI had SNs surrounded by vertebral body marrow edema. The remaining nodes (43%) were not immediately apparent as SNs and manifested only as vertebral body edema, suggesting end-plate fracture, but did evolve into classical chronic SNs as revealed on follow-up imaging.89 Contrast enhancement demonstrated vascularized SNs, with a higher incidence of surrounding edema. They are more common in symptomatic patients.90,91 A concentric hypointense ring appearance has a high negative predictive value for the absence of underlying fracture, infection, or malignancy.88 Giant cystic SNs have been described by Hauger et al.92 as a clinicoimaging entity in a small series of six cases (Fig. 172-18; and see also Fig. 172-5).
Spinal Canal and Foraminal Stenosis
Spinal stenosis refers to any type of narrowing of the spinal canal, nerve root canals, or intervertebral foramina.93 Two broad groups have been defined: (1) acquired (usually related to degenerative changes) and (2) congenital or developmental. Developmental stenosis can be exacerbated by superimposed acquired degenerative changes. In the acquired type, there has been no association between the severity of pain and the degree of stenosis. The most common symptoms are sensory disturbances in the legs, LBP, neurogenic claudication, weakness, and relief of pain by bending forward. Clinical stenosis is perhaps a better term than spinal stenosis (as diagnosed on imaging studies). The imaging changes are in general more severe than expected from the clinical findings.94 Although there does appear to be a correlation between cross-sectional area and midsagittal measurements in patients with symptomatic spinal stenosis, measurement of canal stenosis is not generally used.39
Acquired Lumbar Spinal Stenosis
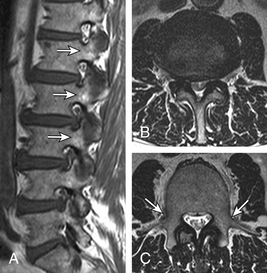
Acquired lumbar spine stenosis (LSS) is typically a sequela of hypertrophic degenerative disc and facet/ligamentous changes that can be accentuated by static or dynamic degenerative DS. Anatomically, spinal stenosis is divided into central canal, lateral canal (subarticular and lateral recess), and foraminal stenosis. Subjective visual grading of the spinal stenosis is a routine practice in interpretation of the spine imaging. Quantitative evaluation by measuring the AP diameter or cross-sectional area of the central canal is used in research studies but is not commonly done in clinical practice.95 Recent Framingham study data used a cut-off AP diameter of 12 mm for relative LSS, and 10 mm for absolute LSS.96 There is tendency to subjectively grade central spinal canal stenosis as mild, moderate, and severe based on the effacement of the thecal sac due to a combination of anular disc bulging, end-plate osteophytosis, and dorsal ligamentum laxity. Nevertheless, spinal stenosis, even of a severe grade, is meaningless if it lacks a correlation to patient symptoms (Fig. 172-19).
Acquired Foraminal Stenosis
MRI (Conventional), CT (Plain), and CT Myelogram
These three imaging modalities are comparable in estimating the degree of stenosis but are limited by less perfect studies to really prove their difference in accuracy.97,98 MRI is a study of choice in spines that have not undergone surgery, provided that the study is not motion degraded and axial imaging is parallel to the intervertebral disc planes and not hampered by angling or volume-averaging issues. Biplanar (sagittal and axial) evaluation is essential. Recently, Lurie et al.99 showed moderate to substantial inter-reader agreement in assessment of central canal stenosis, foraminal stenosis, and nerve root impingement on MRI, whereas subarticular zone stenosis yielded the poorest agreement with marked variability. Plain CT alone is not a preferred preoperative modality and is usually supplemented by MRI or CT myelogram. Redundant nerve roots (RNRs) is a relatively common finding in association with spinal stenosis on MRI. Redundancy is caused by chronic constriction.100 It tends to develop in patients of more advanced age100 (see Figs. 172-11A and 172-22B).
Congenital Lumbar Stenosis
Congenital lumbar stenosis manifests at a relatively younger age with multiple levels of involvement. Relative milder degenerative changes can cause significant spinal and foraminal stenosis by virtue of developmentally compromised reserve. Radiographically, Dewing et al.101 and Singh et al.102 showed that these patients have a shorter pedicular length, resulting in a smaller cross-sectional spinal canal area (mean critical values of 6.5 mm and 213 mm2, respectively). The AP pedicle:vertebral body length ratio was decreased (e.g., 0.36 in patients vs. 0.48 in controls at the L4 level). Recognizing congenital stenosis alerts the treating surgeon to the possibility of multilevel treatment. Subjective MR signs of congenital stenosis include elongated teardrop foramina in the sagittal plane and shortened pedicles with stubby dorsal elements and decreased AP diameter in the axial plane (Fig. 172-20).
Spinal Epidural Lipomatosis
A common incidental finding in the sacral and lower lumbar canal, spinal epidural lipomatosis (SEL) is typically of no clinical significance. Epidural lipomatosis is usually idiopathic and related to the patient’s body habitus. Exogenous steroids can also result in SEL. There are reports of symptomatic epidural lipomatosis treated with decompression surgery.103,104 SEL does reduce the reserve of the central canal in patients who have hypertrophic degenerative disease. Both CT and MRI demonstrate epidural lipomatosis well. Severe epidural lipomatosis compresses the thecal sac, resulting in a Y-shaped configuration103,105 (Fig. 172-21).
Degenerative Adult Scoliosis
Degenerative scoliosis is the most common adult spinal deformity, typically developing after 50 years of age. Type 1 adult scoliosis is primarily degenerative. It is caused by disc degeneration and facet arthropathy. Type 2 is the progression of adolescent scoliosis in adulthood. Type 3 adult scoliosis is a secondary scoliosis mostly caused by osteoporosis.106,107
Deformities of the spine in the sagittal or coronal plane considerably complicate the diagnosis and treatment of lumbar spinal stenosis. The deformities mainly consist of scoliosis, spondylolisthesis, and flatback deformity. Imaging may show listhesis in the sagittal and coronal planes in addition to angular deformities. There are associated asymmetrical changes of end-plate osteophytosis, disc bulges, facet joint hypertrophy, and foraminal encroachments. Coronal MRI is essential for characterizing and measuring scoliosis. The goals of surgery in complex stenosis are neural decompression and a well-balanced sagittal and coronal fusion.108 As alluded to before, correction of deformity may be a relative indication for instrumented fusion in the setting of spinal stenosis109 (see Fig. 172-11B).
Significance of Imaging Findings
Studies to date leave unanswered the question of the significance of morphologic abnormalities and do not adequately explain the role these changes play in the symptomatic population. There is no agreement on the prognostic value of morphologic changes detected by imaging.110–112 It seems logical, therefore, to investigate the morphologic information available from modern imaging in an attempt to predict successful outcomes early in the clinical course of radiculopathy or LBP. Instead, investigators have mostly focused on epidemiologic variables such as gender, duration, litigation, compensation status, sociopsychosocial history, and so on. Any attempt to infer the prognosis from morphology will be confounded by the high prevalence of morphologic change in the asymptomatic population.
Why do some individuals without symptoms show the same morphologic abnormality as those with symptoms? Why do some individuals become symptom free without an obvious change in the morphology of the herniated disc thought to be responsible for the acute event? Why do some individuals show improving symptoms in the face of worsening morphologic changes? These questions still await clear answers. In the discussion that follows, we divide the subjects into three groups based on the presence and absence of symptoms and abnormal imaging findings.
Asymptomatic Subjects with Positive Imaging
There is a high prevalence of degenerative disc changes in asymptomatic patients. Irrespective of age, Wiesel et al.113 found about 35% of spines to be abnormal in asymptomatic patients. Degenerative disc and/or facet disease, including spinal canal stenosis, was present in about 20% of patients younger than 40 years, whereas the prevalence rose to about 50% in patients older than 40 years. Other authors showed similar observations. The prevalence of morphologic alterations increases with advancing chronologic age. Boden et al.114 showed that 57% of the scans were abnormal in a group of individuals older than 60 years of age (37% had disc herniations and 21% had spinal canal stenosis), whereas in the group younger than 60 years, 20% had disc herniations. Jensen et al.115 evaluated MRI examinations of 98 asymptomatic patients and showed that 64% had disc space abnormalities, 52% anular disc bulges, 27% protrusions, 1% extrusions, 19% SNs, 14% anular defects, 7% central canal stenosis, and 38% had a disc abnormality at more than one level.
Boos et al.116 showed a very high prevalence of disc herniation (i.e., 76% in age-, gender-, and occupation-matched asymptomatic cases), which was comparable to that of symptomatic patients (i.e., 96%); there was no statistical significance. Patients had more severe disc herniations (disc extrusions) than asymptomatic volunteers (35% vs. 13%). There were no significant differences regarding disc degeneration between both groups (96% vs. 85%). The only substantial imaging morphologic difference between the groups was the presence of a neural compromise (83% vs. 22%).
The preceding data emphasize the importance of correlating the clinical picture with the MRI examination when major surgical decisions are made. In fact, the findings on lumbar spine MRI may be meaningless when considered in isolation. In addition, with only 1% of the sample showing an extrusion in one of the larger studies by Jensen et al.,115 subcategorizing herniations into protrusion and extrusion may be helpful for better characterizing asymptomatic versus symptomatic discs.
Symptomatic Patients with Negative Imaging
Back pain is thought to occur in some patients without evidence of such morphologic abnormalities as herniation or stenosis. The perplexing clinical scenario of patients who complain of incapacitating back pain but have no overt morphologic abnormality has given rise to the concept of the disc as a pain generator. This was classically described by Crock117 as “chronic internal disc disruption syndrome.” Many different names have been given to this idea, which becomes more confusing when combined with the various diagnostic tests that are used in an attempt to diagnose this confusing syndrome. Additional terms in the literature include internal anular tear, internal disc disruption, black disc disease, and discogenic pain. In a normal human lumbar disc, nerve endings can be found only in the periphery of the anulus, and the pain fibers are part of the sympathetic chain via the sinuvertebral nerve.118,119 This innervates the outer layer of the anulus fibrosus. However, in very degenerated discs, nerves may even penetrate into the nucleus pulposus.120 Potentially, stimulation of these fibers can occur not only from direct disruption and mechanical pressure on the anulus but also from various breakdown products of the nucleus pulposus or secondarily up-regulated inflammatory mediators. The normal disc acting as a source of pain is still a mystery. Provocative discography, as discussed in the following section under symptomatic patients, has been used in morphologically normal discs with an expected lack of pain reproduction.
Disc material leakage is hypothesized to cause back pain and radiculopathy through a chemoinflammatory mechanism. The nucleus pulposus can cause an inflammatory reaction with leukotaxis and increased vascular permeability.121 A simple incision of the anulus fibrosus can produce morphologic and functional changes in the adjacent nerves, such as increased capillaries and reduced nerve conduction velocities,122 with the presumed mechanism of disc material leakage into the epidural space. McCarron et al.,123 using a dog model, demonstrated that autogenous placement of the nucleus pulposus into the epidural space caused acute and chronic inflammatory reactions, with influx of histiocytes and fibroblasts. Kayama et al.122 and Olmarker et al.124 demonstrated that the contents of the nucleus pulposus applied to spinal nerves induces a wide variety of functional, vascular, and morphologic abnormalities, often followed by intraradicular fibrosis and neural atrophy.
Disc Space Degeneration
Treating the sequelae of disc degeneration (i.e., disc herniations, stenosis, and instability) is the goal of therapy and therefore the major focus in clinical and imaging trials rather than the disc degeneration itself. The intervertebral disc is considered to be the source of discogenic pain. Provocative discography has been used to identify one or more disc spaces as the source of pain. Weishaupt et al.,125 however, showed a lower specificity (59%) and positive predictive value (PPV) (63%) for disc degeneration as a correlate of provocative pain, with mildly increased PPV for degenerated discs with HIZs. Their high negative predictive value (98%) in the normal-appearing discs at least indirectly suggests the origin of pain from other levels or causes. Recently, Kang et al.83 demonstrated very high specificity (97.8%) and PPV (87%) for disc protrusion with HIZ in reproduction of pain. They classified the MR findings of the disc into four classes: (1) normal or bulging disc without HIZ; (2) normal or bulging disc with HIZ; (3) disc protrusion without HIZ; and (4) disc protrusion with HIZ. The first two classes had a less significant correlation to provocative pain. Disc protrusion without HIZ had a moderate correlation (specificity, 80.6%; PPV, 53.6%) to pain reproduction. As a note of caution, Carragee et al.126 recently showed accelerated disc degeneration over 10 years in the discs that underwent discography using modern techniques.
Disc Herniations
Anular disc bulges and larger disc herniations contribute to spinal canal stenosis. Smaller or lateralized herniations, on the other hand, can cause radiculopathy. Disc extrusions are more likely to correlate with patient symptoms than disc bulges and disc protrusions.127 There is a high incidence of radiculopathy in patients with imaging findings of central canal stenosis and nerve root compression by disc herniation.127,128 The presence of a disc herniation in a patient with radiculopathy is a positive prognostic marker.127,129 Most of the available studies have shown that the size of disc herniation can reduce dramatically on conservative management; the larger herniation shows a more prominent decrease in size. Extrusion and sequestered discs are also more likely to show a reduction in size; protrusions are less likely to change. There was, however, no clear correlation of these alterations with patient symptoms.9,8,130–132 The higher reduction and even disappearance of the extruded and sequestered discs is thought to be related to more vascular exposure.131 As far as surgery is concerned, most surgeons believe that larger disc herniations do better after surgery than smaller disc herniations. By the same token, larger discectomy defects predict lower rates of reherniation.133 Recently, Dewing et al.101 showed significantly better outcomes in symptomatic patients after microdiscectomy in the following group of patients: younger, active, herniations at L5-S1 (compared with L4-5), and extrusions or sequestrations (compared with contained herniations). As far as patient preference for surgery is concerned, Lurie et al.134 showed that younger patients having a lower level of education and higher disability/unemployment preferred the surgical option (Fig. 172-22).
End-Plate Marrow Changes
Back Pain
End-plate changes are less common in asymptomatic individuals. Degenerative disc disease is more likely to be associated with symptoms when end-plate changes are present.135 Type I changes are more strongly associated with back pain.136,137 Furthermore, conversion from type I to II is associated with clinical improvement of symptoms, and vice versa.138 End-plate changes have a high correlation to pain production on discography compared with other disc degenerative changes; the correlation is much higher as the extent of the end-plate changes increases.125,139 However, some authors have been unable to show a strong correlation of LBP to end-plate changes.140,141 Albert and Manniche136 showed that disc herniation is a strong risk factor for developing new end-plate changes, particularly type I.
Stability of End-Plate Changes
Type I changes are generally considered unstable, and type II are considered stable. Some studies have shown conversion of type II to type I changes.136,142,143 Kuisma et al.144 studied 60 patients with sciatica who did not undergo surgery and showed that 14% of end-plate changes evolved into another type within 3 years—80% of the conversions being from type II to either type I or mixed type I and type II. They also found that nonconverted end-plate changes increased in size and that new end-plate changes developed adjacent to degenerated discs in 6% of patients—77% of these new changes being either type I or mixed type I and type II. Basically, type I changes are a reflection of some type of biomechanical instability. On the other hand, type II changes are a reflection of stability, albeit associated with degeneration. Type II changes in the absence of superimposed accelerated degeneration or instability remain stable.
Segmental Instability
Type I changes have a higher correlation to segmental instability than type II changes do.137 However, there is always a question about the methods for measuring instability. More convincing evidence of this correlation is shown by postfusion studies, which demonstrated a very high prevalence rather conversion into type II change in cases with solid fusion, whereas there was a higher type I change persistence in those with nonunion (pseudarthrosis)145 (Fig. 172-23).
Facet Joint and Dorsal Elements
It is clinically important to identify pain originating from facet joints. Facet joint arthritis on imaging is a nonspecific finding usually accompanying disc degeneration. Dominant facet joint arthritis with or without effusion needs to be addressed in surgical planning. The relationship of joint effusions to spondylolisthesis and instability has already been discussed. Degenerative changes in the dorsal paraspinal structures on STIR are found in a higher percentage of subjects with LBP than in controls.59 Lakadamyali et al.59 showed a significantly increased incidence of facet joint effusions, para-articular soft tissue edema, and interspinous ligamentous edema in patients with LBP than in controls. Pedicle marrow changes are related to spondylolysis, as discussed earlier, but they are also commonly seen with facet degenerative disease and reflect abnormal stresses related to abnormal motion or loading caused by the degenerative changes in the spinal segment146 (Fig. 171-24; see also Figs. 172-8 and 172-9).
Degenerative Spondylolisthesis
The natural history of degenerative spondylolisthesis (DS) is generally favorable. About 15% to 25% of patients eventually need surgery.147,148 Up to 35% of patients show progression of DS, but there is no clear relationship between DS progression and change in patient symptoms. Matsunaga et al.148 studied the long-term (>10 years) nonsurgical natural course of DS. The intervertebral spaces of the slipped segments decreased significantly in size during follow-up examination in patients in whom no progression was found. LBP improved following a decrease in the total intervertebral space size. The development of osteoarthritic spurs, hypertrophy and ossification of the intervertebral ligaments, and facet arthrosis are thought to cause stabilization that prevents slip progression. About 75% of patients remained asymptomatic after 10 years of follow-up. However, most of the patients (83%) who had significant initial symptoms such as intermittent claudication or vesicorectal disorder and who refused surgery showed progressive worsening. Johnsson et al.,149 in a study of symptomatic patients over 4 years, showed that about 75% of the patients had stable spinal claudication. Overall, symptoms in 70% of the cases were unchanged, 15% showed improvement, and 15% worsened. No proof of severe deterioration was found after 4 years. Therefore, DS is clinically significant in a small portion of the cases, and the majority of DS on imaging remains stable over a long period of time. DS is a relative indication for instrumented fusion in the setting of spinal stenosis. Other indications are correction of deformity, recurrent spinal stenosis with instability, adjacent segment stenosis with instability, and multiple-level fusions.109
Lumbar Spinal Stenosis
Lumbar canal stenosis is associated with a threefold higher risk of experiencing LBP.96 However, the degree of lumbar spinal canal stenosis (LSS) on imaging is not strongly correlated with patient symptoms.150,151 Also, imaging provides no clear means of management stratification and plays no prognostic role except in severe degrees of central canal stenosis, which has a fair correlation to functional disability and a favorable postoperative outcome.150,152 Jonsson et al.150 concluded that the “ideal patient for surgery” should have a pronounced constriction of the spinal canal, insignificant LBP, no concomitant disease affecting walking ability, and a symptom duration of less than 4 years. Regarding RNR in spinal canal stenosis, a recent study found a prevalence of about 33%; the longer the relative length of RNR, the better the outcome. Overall, the surgical outcomes in the RNR group were not statistically different from those in the non-RNR group.153
Thoracolumbar Spine Infection
Vertebral Osteomyelitis
The single most important differential consideration to exclude when T2 hyperintense discal and adjacent marrow changes are noted is vertebral osteomyelitis. Vertebral osteomyelitis with discitis is seen in 2% to 4% of all cases of osteomyelitis.154 Despite its low incidence, the potential morbidity and mortality from vertebral osteomyelitis are great. Accurate and specific imaging is required not only for diagnosis but also to guide biopsy for a microbiologic culture. MRI provides the best combination of sensitivity and specificity. Other imaging tests such as plain films, nuclear medicine imaging, and CT may provide additional information. In order to avoid a delayed diagnosis of vertebral osteomyelitis and the consequent devastating sequelae for the patient, keep in mind early discitis and osteomyelitis changes while interpreting spine imaging. Localized back pain is the most common presentation. In a series of 43 adult patients, Hitchon et al.155 reported that 98% presented with local spine pain of longer than 6 weeks’ duration, and 50% presented with fever. All had elevated sedimentation rates. In a review of 442 patients in all age groups with pyogenic infection of the spine, Malawski and Lukawski156 showed that the disease seldom involved one vertebra, as usually both vertebral bodies were affected at the disc space. The lumbar spine was most commonly involved, followed by the thoracic and then the cervical spine. The sacrum rarely was involved.
Etiology and Risk Factors
The risk of vertebral osteomyelitis is increased in patients with IV drug abuse, endocarditis, sickle cell anemia, tuberculosis, malnutrition, alcoholism, diabetes mellitus, rheumatoid arthritis, as well as those undergoing hemodialysis and patients given steroids, due to compromise of host defenses.157–159 The incidence of diabetes mellitus in patients with vertebral osteomyelitis is far out of proportion to that in the general population. Carragee et al. reported that up to 40% of patients had diabetes mellitus.158
Hematogenous vertebral osteomyelitis is caused predominantly by Staphylococcus aureus. Up to half of these infections can be caused by methicillin-resistant S. aureus (MRSA).160 S. aureus is also a major cause of bacteremia and endocarditis in adults. In a series of 37 adult patients with vertebral osteomyelitis from the Cleveland Clinic,161 S. aureus was the responsible organism in 68% of patients (25 of 37). Staphylococcus epidermidis, streptococci, gram-negative aerobic bacilli, and Mycobacterium tuberculosis were identified in 5% of the remaining patients. In IV drug abusers, Pseudomonas aeruginosa, other unusual gram-negative bacilli, and staphylococci cause spinal infection most frequently.162,163 In elderly males with genitourinary tract infections, vertebral osteomyelitis is caused most often by Escherichia coli and Proteus spp.162 Furthermore, pyogenic vertebral osteomyelitis may be caused by a different organism than the one isolated from blood, urine, or sputum culture, as reported by Velan et al. in a series of three older patients.164
Modes of Infection
There are three routes by which vertebral osteomyelitis can be established: (1) hematogenously, (2) iatrogenically, and (3) by contiguous spread.165
Hematogenous
In 1940, Batson166 described a valveless, low-pressure vertebral venous system. This is composed of tributaries from the vertebral body metaphyses that drain into a large channel that exits the vertebral body via the nutrient foramen into the plexus of veins lining the spinal canal in the extradural space. There are also connections through the vertebral body cortex to a plexus of veins on the ventral and lateral aspects of the spine.167 Batson166 demonstrated rich anastomoses of this vertebral venous system with the thoracic and abdominal cavities and with pelvic veins. Slight increases in pressure in the vena caval system resulted in a diversion of blood into the vertebral venous system.
Septic embolization via the arterial system has also been proposed as a route for vertebral osteomyelitis. The arterial system of the spine forms a ladder-like anastomosis on its surface. The horizontal components are segmental arteries (1–3 mm) arising from the abdominal aorta that lie at the equator of the vertebral body, and two metaphyseal (200 mm) anastomosing arteries at each vertebral metaphysis. The vertical components join the segmental arteries to the metaphyseal anastomosing arteries, the metaphyseal anastomosing arteries of adjacent vertebral arteries, as well as metaphyseal anastomosing arteries of the same vertebral body. The intraosseous arteries arise from the segmental and metaphyseal anastomosing arteries and parallel the disc surface. Children have rich anastomoses of the intraosseous arteries, which involute by adulthood. Thus, in an adult, infection of the disc cannot occur directly via hematogenous means. It can occur via contiguous spread from an adjacent infected vertebral body. Ratcliffe168 has proposed that septic emboli were more likely to enter the greater number of arteries at the metaphysis and that the smaller caliber of the vessels allowed for the development of thrombosis with resultant infarction—a requirement for osteomyelitis to develop. These two observations explain the propensity for vertebral osteomyelitis to involve the subchondral aspect of the body with relative sparing of the central portion of the vertebral body. The vertical anastomoses among the metaphyseal anastomosing arteries allowed for the spread of infection across disc spaces as well as within the same vertebral body while sparing the central portion. The intraosseous anastomoses in children would prevent large foci of bony infarction, thus resulting in smaller foci of osteomyelitis.168
Whereas metastatic spread from the pelvic venous system to the vertebral bodies via the vertebral venous plexus has been shown in animals,169,170 the spread of infection via the vertebral plexus could not be demonstrated experimentally. Further argument supporting arterial spread is that vertebral osteomyelitis is usually preceded by symptomatology compatible with bacteremia (sepsis). If spread is via the venous route, extradural thrombophlebitis with meningismus should be expected to represent a prominent feature of osteomyelitis.171 This has not proven to be the case.
Iatrogenic or Posttraumatic
Organisms can be directly implanted secondary to surgical procedures or penetrating spinal trauma. Discitis has been reported as a complication of cervical and lumbar discography,172,173 chemonucleolysis (chymopapain injection),174,175 and laminectomy.176,177 Discitis as a complication of discography is uncommon. Its incidence has been reported as 0.05% to 1.4% in various series. An aggravation or increase of neck and back pain and fever are typical presenting complaints.172,173
The diagnosis of disc space infection following discectomy is problematic. Patients typically present 2 to 6 weeks following surgery with recurrence of pain after initially having experienced the relief of symptoms. Patients are often febrile with muscle spasm and a positive straight-leg raising test.176 The sedimentation rate is elevated. Roentgenographic findings appear several weeks after initial symptoms, with a decrease in the intervertebral disc space height and development of end-plate erosions.
Contiguous Spread
Vertebral osteomyelitis, or disc space infection, can result from contiguous spread from an adjacent infected source. It is the least common of the three mechanisms discussed here.178 Contiguous spread requires the spread of a superlative soft tissue focus through the periosteum, cortex, and marrow of the vertebral body or through the longitudinal ligaments, anulus fibrosus, and nucleus pulposus of the disc. Contiguous spread of infection to the spine is encountered in the sacral region in association with infected decubitus ulcers, as well as genitourinary and intestinal processes.178 Vertebral osteomyelitis and disc space infection have been reported as complications of colonic,179 hypopharyngeal,180 and esophageal181,182 perforations or instrumentation, as well as pelvic abscesses.183 Lesions of the aorta or of an aortic graft, such as mycotic aneurysm or pseudoaneurysm, may predispose to the development of vertebral osteomyelitis.184 When considering vertebral osteomyelitis as a result of contiguous spread, the question often arises as to whether the infection was actually a result of hematogenous spread (either arterial or venous) rather than truly contiguous with direct invasion.185–187 For example, the direct invasion of a vertebral body by a lung lesion is felt to be an unlikely sequence of events due to an effective barrier provided by the pleura.185 Here it has been postulated that spread actually occurs via pleural veins communicating with the Batson plexus.
Imaging of Discitis Osteomyelitis
Conventional Radiography
Typically, the early findings of disc space infection on plain radiography are minimal disc space narrowing and erosions or indistinctness of the end plates. In addition to the bony changes, soft tissue swelling due to paraspinal phlegmon or abscess may also be evident. In the lumbar region, this presents as enlargement of the psoas shadows. In the thoracic region, disc space infection appears as a paraspinal soft tissue mass. In the cervical spine, prevertebral soft tissue swelling is evident. As the disease progresses, the disc space narrowing worsens. The destruction of the end plates becomes more obvious. In addition, sclerosis of the end plates and a periosteal reaction also become evident. In general, with healing, the disc space remains markedly narrowed or fuses, and there may be a concomitant loss of height of the vertebral body with resultant spinal deformity (see Fig. 172-31C).
Digby and Kersley188 reported the following time sequence for the radiographic changes to correlate with the pathologic changes: at 2 weeks, decreased disc space height becomes evident; at 6 weeks, lytic vertebral body lesions are seen; reactive sclerosis is present at 8 weeks; and at 6 months, new bone formation and fusion are present. Malawski and Lukawski156 also reported the time sequence of radiographic changes in a series of 150 cases of vertebral osteomyelitis. They found that radiologic changes became apparent after 4 to 6 weeks. In their series, an early sign was also a decrease in disc space height. After several weeks, lytic vertebral body lesions and end-plate disruption were evident.
Unique presentations of vertebral osteomyelitis have also been reported. McHenry et al.189 reported a series of six patients with osteomyelitis who presented with underlying osteoporosis and compression fracture of a single vertebral body. On the initial plain radiographs, the end plates were intact. This unique presentation accounted for 13% of all hospitalized patients with vertebral osteomyelitis and 2.4% of inpatients with osteoporotic compression fractures over a 5-year period in our institution.
Nuclear Medicine
The role of nuclear medicine in vertebral osteomyelitis is diminishing. If MRI cannot be performed, nuclear medicine examinations have been used for diagnosis of vertebral osteomyelitis. Specificity is a major limiting factor with bone scans, which use the radionuclide technetium-99m. Gallium-67 is, however, a useful radionuclide with high specificity.190 Both these tracers have significantly high specificity due to a complementary role. Indium-111 leukocyte imaging has little or no usefulness in detecting vertebral osteomyelitis and has been shown to be unreliable.191
Three-Phase and Total-Body Bone Scan
In the setting of vertebral osteomyelitis, the three-phase bone scan demonstrates increased uptake in flow and blood pool phases and in delayed images. Intense uptake in two adjacent vertebral bodies with loss of the disc space is seen in patients with vertebral osteomyelitis. The bone scan is sensitive for vertebral osteomyelitis. However, it lacks specificity. In the spine, it can be difficult to separate increased radionuclide uptake due to degenerative disc disease, benign compression fracture, or metastatic disease from that occurring as a result of vertebral osteomyelitis. Moreover, some investigators report bacteriologically proven vertebral osteomyelitis in patients who had a negative bone scan at 2 weeks following the onset of symptoms.192,193 In addition, the increased uptake of tracer does not differentiate active from inactive osteomyelitis, since increased uptake can persist for long periods following resolution of the infection.194
Gallium-67
Gallium scan also demonstrates increased uptake in the setting of vertebral osteomyelitis. It also gives information about the surrounding soft tissues. The combination of gallium scanning and a three-phase bone scan may increase the specificity up to nearly 100%.192 The sensitivity is approximately 90%. The two tests provide complementary information.195 It is generally accepted that the combination of bone and gallium imaging can identify vertebral osteomyelitis when (1) the distribution of the two tracers is spatially incongruent or (2) their distribution is spatially congruent and the relative uptake of gallium exceeds that of technetium.191 The combination of the two studies is currently the nuclear medicine study of choice for vertebral osteomyelitis. Gratz et al.196 were able to demonstrate that gallium-67 (67Ga)-citrate single-photon emission tomography (SPECT) activity correlated with the severity of infection in a small series of patients who had been receiving antibiotic treatment for an average of 7 weeks prior to scanning. The sensitivity in detecting vertebral osteomyelitis was 80% for individual foci and 100% for vertebral osteomyelitis. In addition, 67Ga-citrate SPECT detected foci of infection outside of the spine before other imaging techniques demonstrated these196 (Fig. 172-25).
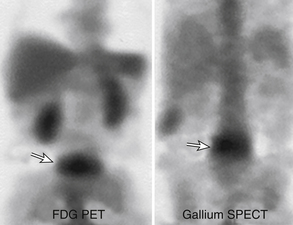
FIGURE 172-25 Vertebral osteomyelitis on gallium and 2-[18F] fluoro-2-deoxy-d-glucose/positron emission tomography (FDG-PET). Coronal images from FDG-PET and 67Ga single-photon emission computed tomography (SPECT). Increased radiotracer accumulation (white arrows) at L5-S1 due to discitis osteomyelitis.
(From Love C, Tomas MB, Tronco GG, et al: FDG PET of inflammation and infection. Radiographics 25(5):1357–1368, 2005, with permission.)
2-[18F] Fluoro-2-Deoxy-d-Glucose Positron Emission Tomography
With the exception of combined bone scan–gallium imaging, nuclear medicine imaging for vertebral osteomyelitis has been unsatisfactory. 2-[18F] fluoro-2-deoxy-d-glucose positron emission tomography (FDG-PET) has shown higher sensitivity and specificity in the diagnosis of vertebral osteomyelitis than has MRI.197,198 FDG-PET has proven useful for differentiating degenerative and infectious end-plate abnormalities detected on MRI.198 FDG imaging findings are likely due to increased glucose metabolism in inflammatory cells such as leukocytes, granulocytes, and macrophages. An additional advantage is that FDG-PET is not affected by metal implants. It may be useful in evaluating infection in patients with hardware. FDG-PET has better resolution than other nuclear medicine imaging techniques and can differentiate bone from soft tissue infection. Low FDG-PET uptake has been shown in fractures and pseudarthrosis. Hodges et al.199 identified persistent disease on MRI as a sign of failure of conservative treatment. Recently, Kim et al.200 showed the utility of FDG-PET in differentiating between residual and nonresidual disease based on standard uptake value measurements. FDG-PET may therefore be used in cases of vertebral osteomyelitis as a problem-solving tool in proper clinical settings (see Fig. 172-25).
Computed Tomography
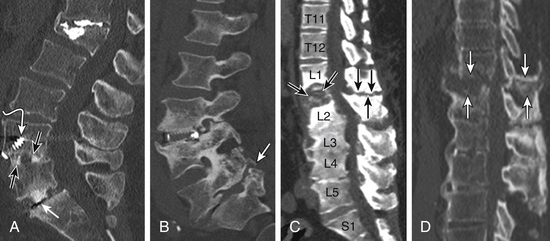
CT can be used in the diagnosis of advanced vertebral osteomyelitis and discitis. Due to routine use of multiplanar reformats, vertebral osteomyelitis may be picked up as an incidental finding on CT of the abdomen and pelvis. CT allows detection of bony destruction and paraspinal swelling. CT demonstrates a decrease in the density of the affected vertebral body and disc.178,200,201 The CT criteria for the diagnosis of pyogenic vertebral osteomyelitis include diffuse moth-eaten or permeative bone destruction, gas within the bone or adjacent soft tissues, and prevertebral soft tissue involvement.178,202 Discal gas is generally considered a sign of degenerative change and excludes discitis, but rare exceptions have been reported.47 Granulomatous vertebral osteomyelitis may manifest with fragmented end plates rather than as a purely lytic lesion, with paraspinal masses that extend for a greater length than the vertebral body itself and with paraspinal masses that may demonstrate calcifications.203 With treatment and resolution of the infection, the density of the vertebral bodies increases and associated soft tissue masses decrease in size. At the Cleveland Clinic, CT is most often used for guiding needle biopsy for definitive diagnosis and microbiologic culture, rather than as a method of diagnosis (Figs. 172-26 and 172-27).
Magnetic Resonance Imaging
MRI has been found to have a sensitivity of 96%, a specificity of 92%, and an accuracy of 94% in the diagnosis of vertebral osteomyelitis.204,205 This result is comparable to the combination of technetium-99m bone scanning and gallium scanning, as discussed previously. MRI is also more sensitive and specific for the diagnosis of vertebral osteomyelitis than is plain radiography.204 It is superior to CT regarding its contrast resolution, its demonstration of epidural disease, and its detection of the effect of the infection on the spinal cord and thecal sac. The classic MRI changes of vertebral osteomyelitis are divided into discal and paradiscal (end-plate, paraspinal, and epidural soft tissue) spaces.205 The findings on the sagittal imaging are as follows:
T1 imaging shows a confluent decreased signal intensity of the intervertebral disc and adjacent vertebral bodies with the inability to discern a margin between the two on T1-weighted images (“diffuse spondylodiscal darkening”). The typical MR findings of vertebral osteomyelitis are consistently seen on T1 sagittal imaging. A study from our institution showed typical T1 end-plate signal changes plus T2 disc hyperintensity in 95% cases of vertebral osteomyelitis.161
T2 imaging shows (1) corresponding end-plate and vertebral body hyperintensity on each side of the disc space, and (2) an abnormal configuration and hyperintense fluid signal intensity of the intervertebral disc with loss of the nuclear cleft204,205 (“diffuse spondylodiscal brightening”). Conventional sagittal T2 imaging may not show the typical end-plate hyperintense signal, as occurs in about half of the cases in the study just mentioned.161 However, STIR imaging is very helpful in such cases, not only illuminating the paradiscal end plates but also unequivocally showing the discal T2 hyperintense signal as well as paraspinal soft tissue edema. Disc space infection can originate in the soft tissue along the discs. The authors retrospectively noted few cases with early and subtle paradiscal soft tissue foci on STIR imaging later converting into full-blown cases of discitis and osteomyelitis. Isolated T2 discal hyperintensity itself is a nonspecific finding because a T2 hyperintense degenerated disc can have a similar appearance, as is discussed later in the differential diagnosis.
Contrast enhancement has been found to increase the accuracy of the diagnosis of vertebral osteomyelitis and discitis in cases with equivocal MRI scans.206 The involved portions of the adjacent vertebral body and disc typically enhance following the administration of gadolinium. The typical enhancement pattern is rim enhancement of the inflamed disc space. Other patterns include homogeneous enhancement of the majority of the disc space and patchy nonconfluent areas of disc enhancement.206 Absence of discal enhancement is rare in thoracolumbar spine discitis and osteomyelitis.205,206 Post et al.206 described abnormal enhancement of the vertebral bodies, disc, and paraspinal soft tissues that progressively decreased on follow-up imaging in patients successfully treated with antibiotics. Gillams et al.207 also followed patients given antibiotic therapy with MRI. They saw both decreasing and stable, and even increasing enhancement patterns in patients who were improving clinically while taking medical therapy. They concluded that whereas decreasing spinal and soft tissue enhancement was a useful sign, persistent or increasing enhancement alone did not indicate treatment failure (see Figs. 172-26 and 172-27).
Follow-up MRI is generally used to monitor the response to therapy in combination with clinical and inflammatory markers. After 4 to 8 weeks of parenteral therapy, clinicians must decide whether to stop or continue parenteral therapy, begin oral therapy, or go for diagnostic imaging or ask for surgical intervention. Follow-up MRI at 4 to 8 weeks after the start of therapy may show variable imaging features indicating either improvement or equivocal or worsening of the findings. The bone marrow and disc space findings can be misleading and may not correlate with the clinical response.208 However, paraspinal and epidural soft tissue changes (including abscess formation) are relatively reliable markers of response to therapy. Kowalski et al.208 also showed some degree of vertebral body loss of height in all cases in the unfavorable group (however, it was a nonspecific finding). Most of the studies of vertebral osteomyelitis on follow-up MRI are limited due to the smaller size of the samples. Another major limitation is a marked bony and soft tissue vascularized response to the infection, which may remain for a long time. For example, gadolinium enhancement at the site of infection may not completely resolve even years after treatment.208–211
Specific Etiologies
Postoperative Discitis
Differentiating postoperative discitis from normal postoperative disc space change can be difficult. Boden et al.212 reported postoperative MRI changes in 15 asymptomatic patients and 7 patients with proven postoperative discitis. They found gadolinium enhancement to be useful. The entire triad of vertebral bone marrow enhancement, disc space enhancement, and anulus fibrosus enhancement was not seen in any of the asymptomatic patients in their series. However, Ross et al.213 showed similar results in 94 asymptomatic postoperative patients demonstrating anular enhancement (curet site), disc enhancement, and vertebral end-plate enhancement. Approximately 20% (19 of 94) of the patients showed intervertebral disc enhancement at the surgical level 3 months after surgery. They also showed type I marrow changes at the surgical level that enhanced postoperatively. Type I marrow changes represent the conversion of normal marrow to fibrovascular marrow with low signal on T1-weighted images and high signal on T2-weighted images.214 Some patients showed no marrow changes between preoperative and postoperative MRI scans, but others exhibited a change to type I enhancing marrow conversion on the postoperative scan. They emphasized the necessity of understanding normal asymptomatic postoperative changes, and that asymptomatic postoperative disc enhancement coupled with enhancing marrow changes can look similar to osteomyelitis but may be distinguished from infection by the smooth linear bands of enhancement within the disc (Fig. 172-28).
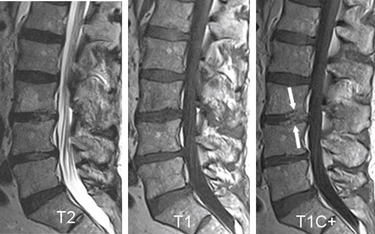
Spinal Epidural Abscess
Epidural soft tissue changes generally involve the ventral epidural space and abut the infected disc. The solid component is termed epidural phlegmon because no fluid is identified on MRI. Both epidural abscess and phlegmon cause mass effect on the thecal sac and spinal cord. Most of these epidural masses occur adjacent to the level of osteomyelitis and discitis and usually involve two to four vertebral segments.215–218 Epidural abscesses can be extensive, noncontiguous, and even distant from the site of osteomyelitis. Spinal epidural abscess represents a significant complication of vertebral osteomyelitis.
Spontaneous epidural abscess is less common.216 Karikari et al.,219 in their 10-year experience of spontaneous epidural abscesses, divided them into two groups based on location: 65.4% of cases were ventral and 34.6% were dorsal abscesses. The patients with dorsal epidural abscesses had a higher rate of associated paraplegia or quadriplegia. MRI offers a distinct advantage in its ability to easily and noninvasively image the entire spinal column and therefore detect the presence of such distant foci of disease.
Postcontrast MRI exhibits enhancement of the epidural mass. This provides excellent distinction between the high signal enhancing epidural process and the lower signal of the cerebrospinal fluid and spine on T1-weighted images.206 The administration of contrast aids in differentiating between epidural phlegmon versus abscess. Dense homogeneous enhancement of the mass suggests phlegmon, whereas peripheral or ring enhancement of the mass suggests an abscess.160,220–222 The investigators have not found the unenhanced T1- and T2-weighted image signal characteristics to be helpful in differentiating phlegmon from abscess.161 This distinction may be important clinically since an abscess usually requires surgical decompression and drainage but phlegmon does not (Fig. 172-29).
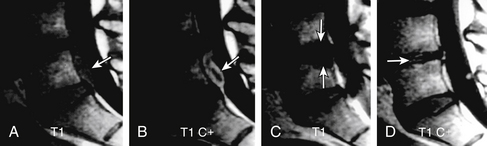
Nonpyogenic Discitis Osteomyelitis
Nonpyogenic discitis osteomyelitis mainly includes tuberculous and brucellar infections. Almost half of the skeletal tuberculosis is due to vertebral osteomyelitis.223 Tuberculous spondylitis may be indistinguishable from pyogenic spondylitis. However, there are distinct imaging characteristics that, when present, should suggest the diagnosis of tuberculous rather than pyogenic spondylitis.224 Tuberculous osteomyelitis tends to involve the ventral aspect of the vertebral body at the metaphysis. The infectious process tends to spread via the anterior longitudinal ligaments to adjacent vertebral bodies. Involvement of the intervertebral disc is relatively limited compared with the amount of vertebral body involvement. Mycobacterium requires a well-oxygenated environment to survive. It is able to infect the well-oxygenated, well-vascularized environment of the vertebral body but has difficulty invading the intervertebral disc.225 The thoracic and lumbar spine are most commonly involved, with the organism having a predilection for the thoracolumbar junction.203,226 Usually, more than one vertebral body level is involved, with more than 40% of cases involving disc spaces in one series.226,227 Solitary and skip lesions can occur.203,227,228 The ventral aspect of the vertebral body is most commonly involved, but dorsal elements can also be involved.224,227 Isolated dorsal spinal tuberculosis is rare.229 On plain films and CT, there is delay in destruction of the intervertebral discs; a large calcified paravertebral mass may be present (due to psoas abscess—highly suggestive of TB infection) and absent or less prominent reactive sclerosis230 (Figs. 172-30 and 172-31).
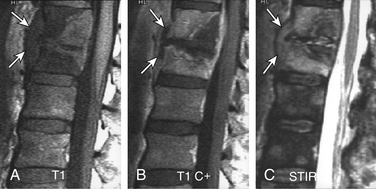
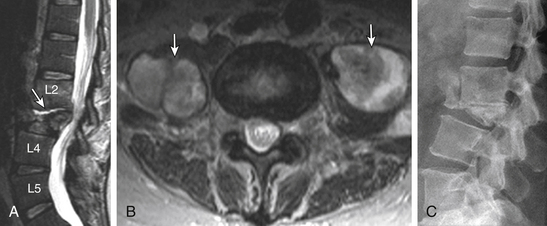
Brucellosis is an insidious febrile illness with nonspecific signs and symptoms. Between 25% and 34% of cases have involvement of osteoarticular structures.231 About 5% to 15% cases of patients with brucellosis can have spondylodiscitis.232–234 One level of involvement is usually seen but, rarely, multilevel involvement may be seen.235,236 Vertebral bodies, discs, and paraspinal soft tissues are involved. Specifically, ventral rostral vertebral body involvement and paraspinal soft tissue changes have been reported without abscess or dominant discal changes.234
Differential Diagnosis
Type I Degenerative Marrow Changes
Type I degenerative marrow changes may mimic vertebral osteomyelitis. Type I marrow signal intensity change may enhance following the administration of gadolinium, and enhancement of the central portion of the cervical and lumbar intervertebral discs in patients who have not undergone surgery does occur in the setting of degenerative disc disease.237 In advanced disc degeneration, blood vessels once again can be seen within the disc. Usually, the signal intensity of the disc on T2-weighted images helps differentiate the two entities. The disc is usually decreased in signal on T2-weighted images in degenerative disc disease. On occasion in degenerative disc disease, the intervertebral discs may show increased T2 signal, as discussed in the following section. In infectious spondylitis, the distribution of the increased signal intensity on T2-weighted images does not conform to the anatomic configuration of the disc. The clinical history and the presence or absence of increased sedimentary rate help to differentiate the two entities. Only 4% of patients in a series of 474 patients with degenerative disc disease demonstrated the type I pattern215 (Fig. 172-32).
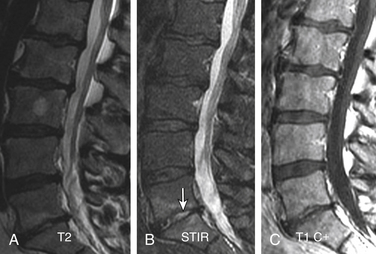
T2 Hyperintense Degenerated Disc
A T2 hyperintense degenerated disc is not an uncommon presentation. Typically, a diffuse T2 hyperintense disc, disc space narrowing, variable end-plate changes, and degenerative disc disease are evident at other levels. Generally, this does not represent a major challenge, but in a high-risk patient for whom there is strong clinical suspicion for vertebral osteomyelitis, contrast enhancement may be needed to further characterize the disc space. Lack of paraspinal soft tissue edema strongly argues against infection (see Fig. 172-32).
Metastatic Disease
Metastatic disease can be differentiated from vertebral osteomyelitis by its sparing of the intervertebral disc space. Disc involvement with metastatic disease is rare.238,239 In addition, metastatic disease commonly involves the pedicles of the vertebral body, whereas osteomyelitic foci tend to be subchondral and do not affect the pedicle.
Primary Tumors of the Spine
Primary tumors of the spine are rare compared with metastatic tumors. There are, however, primary tumors of the spine that involve contiguous vertebral body levels and may therefore have disc involvement. Such tumors include plasmacytoma,240 aneurysmal bone cysts,241 giant-cell tumors,242 and chordoma.243 Eosinophilic granuloma presents with lytic vertebral body lesions that can progress to nearly complete destruction of the vertebral body or vertebral plana. Despite this, the adjacent intervertebral discs usually remain intact, allowing for differentiation from disc space infection. Aneurysmal bone cysts and giant-cell tumors of the spine can be characterized by lytic lesions that can span vertebral body levels. However, these tumors usually involve the dorsal elements. These tumors may be more difficult to distinguish from tuberculous spondylitis than from pyogenic spondylitis. Chordomas are uncommon tumors derived from notochordal elements. They can be found throughout the spinal column with a marked propensity for the clivus and sacrococcygeal regions. They are isointense or hypointense in signal on T1-weighted images and increased in signal on T2-weighted images. The intervertebral disc and adjacent vertebral bodies are commonly affected. A paraspinal soft tissue mass is often present.243
Spinal Neuroarthropathy (Charcot Spine)
Spinal neuropathy, or Charcot spine, is most commonly related to tabes dorsalis, syringomyelia, or diabetes mellitus and can be difficult to differentiate from infectious spondylitis on plain films and CT. Park et al.244 found MRI to be useful for distinguishing between the two entities. MRI in neuropathy demonstrated hypointensity in the abnormal disc and adjacent vertebral bodies on both T1- and T2-weighted sequences. In neuroarthropathy, the disc space and surrounding marrow were of lower signal intensity on T2-weighted images than that seen in spinal osteomyelitis. Wagner et al.245 evaluated the plain film, CT, and MRI findings in 14 patients with spinal neuroarthropathy versus 19 patients with disc space infection. They found that facet involvement with narrowing or erosions and vacuum disc were more common in spinal neuroarthropathy on imaging studies and rare in disc space infection. Vertebral body spondylolisthesis, osseous joint debris, joint disorganization, disc rim enhancement, and diffuse vertebral body enhancement were more frequent imaging findings in spinal neuroarthropathy (Fig. 172-33).
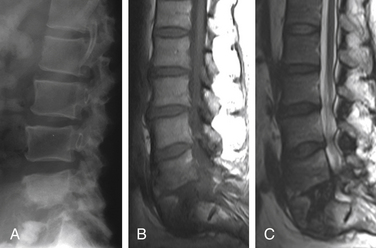
Destructive Spondyloarthropathy
Destructive spondyloarthropathy (DSA) has been described in patients undergoing long-term hemodialysis and, more commonly, in the lower cervical spine.246–248 Plain film changes include disc space narrowing and irregular end-plate destruction. CT images reveal osteolytic areas, with bone sclerosis of adjacent vertebral end plates and minimal osteophytosis.249 This entity typically demonstrates decreased signal in the disc on T2-weighted images and absence of an associated soft tissue mass that helps to distinguish it from vertebral osteomyelitis.250 With progression of the disease, collapse of a vertebral body and spinal instability may occur.249 Distinction between these two entities may be difficult since the sedimentation rate is typically elevated in both groups. Intervertebral disc biopsy may be required in some cases (Fig. 172-34).
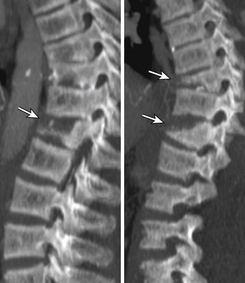
Ankylosing Spondylitis
Ankylosing spondylitis (AS) can mimic discitis osteomyelitis due to inflammatory and noninflammatory processes. Ventral and dorsal end-plate focal inflammatory changes (Romanus lesions) are multifocal and limited to the bones. Imaging shows focal changes at the ventral and dorsal end-plate margins. Andersson lesions represent rheumatic spondylodiscitis. The imaging features depend on the stage of the process. Early findings include end-plate erosion and hypointense T1 and hyperintense T2 signals. Later on, there is development of sclerosis and hyperintense T1 signal due to fatty marrow change. Differentiation from discitis osteomyelitis is usually not difficult in these lesions due to multilevel involvement, localized nature of the lesions, and lack of paraspinal soft tissue thickening.251–253 Segmental pseudarthrosis can develop in AS following fracture of the spine and can better mimic disc space infection.254 It is usually seen at the thoracolumbar junction. On MRI, the segmental pseudarthrosis exhibits an increased signal on T2-weighted images. Shih et al.253 showed both T2 hyperintense and T2 hypointense discovertebral changes in fractures and pseudofractures in AS. Associated segmental dorsal element involvement and disruption of the thickened anterior longitudinal ligament (ALL) are specific features of AS (Fig. 172-35).
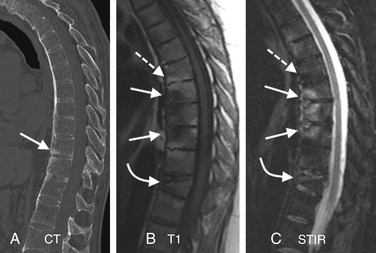
al-Mulhim F.A., Ibrahim E.M., el-Hassan A.Y., et al. Magnetic resonance imaging of tuberculous spondylitis. Spine (Phila Pa 1976). 1995;20:2287-2292.
Alyas F., Connell D., Saifuddin A. Upright positional MRI of the lumbar spine. Clin Radiol. 2008;63:1035-1048.
Gallucci M., Puglielli E., Splendiani A., et al. Degenerative disorders of the spine. Eur Radiol. 2005;15:591-598.
Gilbert F.J., Grant A.M., Gillan M.G., et al. Low back pain: influence of early MR imaging or CT on treatment and outcome–multicenter randomized trial. Radiology. 2004;231:343-351.
Kowalski T.J., Layton K.F., Berbari E.F., et al. Follow-up MR imaging in patients with pyogenic spine infections: lack of correlation with clinical features. AJNR Am J Neuroradiol. 2007;28:693-699.
Lakadamyali H., Tarhan N.C., Ergun T., et al. STIR sequence for depiction of degenerative changes in posterior stabilizing elements in patients with lower back pain. AJR Am J Roentgenol. 2008;191:973-979.
Modic M.T., Feiglin D.H., Piraino D.W., et al. Vertebral osteomyelitis: assessment using MR. Radiology. 1985;157:157-166.
Modic M.T., Ross J.S. Lumbar degenerative disc disease. Radiology. 2007;245:43-61.
1. Resnick D. Degenerative diseases of the vertebral column. Radiology. 1985;156:3-14.
2. Gallucci M., Puglielli E., Splendiani A., et al. Degenerative disorders of the spine. Eur Radiol. 2005;15:591-598.
3. Cherkin D.C., Deyo R.A., Street J.H., Barlow W. Predicting poor outcomes for back pain seen in primary care using patients’ own criteria. Spine (Phila Pa 1976). 1996;21:2900-2907.
4. Deyo R.A., Bigos S.J., Maravilla K.R. Diagnostic imaging procedures for the lumbar spine. Ann Intern Med. 1989;111:865-867.
5. Fager C.A. Identification and management of radiculopathy. Neurosurg Clin North Am. 1993;4:1-12.
6. Long D.M. Decision making in lumbar disc disease. Clin Neurosurg. 1992;39:36-51.
7. Bell G.R., Rothman R.H. The conservative treatment of sciatica. Spine (Phila Pa 1976). 1984;9:54-56.
8. Bozzao A., Gallucci M., Masciocchi C., et al. Lumbar disk herniation: MR imaging assessment of natural history in patients treated without surgery. Radiology. 1992;185:135-141.
9. Bush K., Cowan N., Katz D.E., Gishen P. The natural history of sciatica associated with disc pathology. A prospective study with clinical and independent radiologic follow-up. Spine (Phila Pa 1976). 1992;17:1205-1212.
10. Weber H., Holme I., Amlie E. The natural course of acute sciatica with nerve root symptoms in a double-blind placebo-controlled trial evaluating the effect of piroxicam. Spine (Phila Pa 1976). 1993;18:1433-1438.
11. Chou R., Baisden J., Carragee E.J., et al. Surgery for low back pain: a review of the evidence for an American Pain Society Clinical Practice Guideline. Spine (Phila Pa 1976). 2009;34:1094-1109.
12. Thomas M., Grant N., Marshall J., Stevens J. Surgical treatment of low backache and sciatica. Lancet. 1983;2:1437-1439.
13. Malter A.D., Larson E.B., Urban N., Deyo R.A. Cost-effectiveness of lumbar discectomy for the treatment of herniated intervertebral disc. Spine (Phila Pa 1976). 1996;21:1048-1054. discussion 1055
14. Tosteson A.N., Skinner J.S., Tosteson T.D., et al. The cost effectiveness of surgical versus nonoperative treatment for lumbar disc herniation over two years: evidence from the Spine Patient Outcomes Research Trial (SPORT). Spine (Phila Pa 1976). 2008;33:2108-2115.
15. Postacchini F. Results of surgery compared with conservative management for lumbar disc herniations. Spine (Phila Pa 1976). 1996;21:1383-1387.
16. Gilbert F.J., Grant A.M., Gillan M.G., et al. Low back pain: influence of early MR imaging or CT on treatment and outcome—multicenter randomized trial. Radiology. 2004;231:343-351.
17. Cherkin D.C., Deyo R.A., Wheeler K., Ciol M.A. Physician variation in diagnostic testing for low back pain. Who you see is what you get. Arthritis Rheum. 1994;37:15-22.
18. Hughes R.J., Saifuddin A. Imaging of lumbosacral transitional vertebrae. Clin Radiol. 2004;59:984-991.
19. Hughes R.J., Saifuddin A. Numbering of lumbosacral transitional vertebrae on MRI: role of the iliolumbar ligaments. AJR Am J Roentgenol. 2006;187:W59-W65.
20. Benneker L.M., Heini P.F., Anderson S.E., et al. Correlation of radiographic and MRI parameters to morphological and biochemical assessment of intervertebral disc degeneration. Eur Spine J. 2005;14:27-35.
21. Thornton M.J., Lee M.J., Pender S., et al. Evaluation of the role of magnetic resonance myelography in lumbar spine imaging. Eur Radiol. 1999;9:924-929.
22. Erdem L.O., Erdem C.Z., Gundogdu S., et al. The role of three dimensional MR myelography in lumbar discogenic disease. Tani Girisim Radyol. 2004;10:189-195.
23. Yoo H.M., Kim S.J., Choi C.G., et al. Detection of CSF leak in spinal CSF leak syndrome using MR myelography: correlation with radioisotope cisternography. AJNR Am J Neuroradiol. 2008;29:649-654.
24. Sanal H.T., Cardoso F., Chen L., Chung C. Office-based versus high-field strength MRI: diagnostic and technical considerations. Sports Med Arthrosc. 2009;17:31-39.
25. Bangard C., Paszek J., Berg F., et al. MR imaging of claustrophobic patients in an open 1.0T scanner: motion artifacts and patient acceptability compared with closed bore magnets. Eur J Radiol. 2007;64:152-157.
26. Hailey D. Open magnetic resonance imaging (MRI) scanners. Issues Emerg Health Technol. 2006;92:1-4.
27. Montgomery D.M., Fischgrund J.S. Passive reduction of spondylolisthesis on the operating room table: a prospective study. J Spinal Disord. 1994;7:167-172.
28. D’Andrea G., Ferrante L., Dinia L., et al. “Supine-prone” dynamic X-ray examination: new method to evaluate low-grade lumbar spondylolisthesis. J Spinal Disord Tech. 2005;18:80-83.
29. Zander D.R., Lander P.H. Positionally dependent spinal stenosis: correlation of upright flexion-extension myelography and computed tomographic myelography. Can Assoc Radiol J. 1998;49:256-261.
30. Ben-Galim P., Reitman C.A. The distended facet sign: an indicator of position-dependent spinal stenosis and degenerative spondylolisthesis. Spine J. 2007;7:245-248.
31. Cartolari R. Functional evaluation of the operated lumbar spine with axial loaded computed tomography (AL-CT). Rivista di Neuroradiologica. 2002;15:393-398.
32. Ferreiro Perez A., Garcia Isidro M., Ayerbe E., et al. Evaluation of intervertebral disc herniation and hypermobile intersegmental instability in symptomatic adult patients undergoing recumbent and upright MRI of the cervical or lumbosacral spines. Eur J Radiol. 2007;62:444-448.
33. Alyas F., Connell D., Saifuddin A. Upright positional MRI of the lumbar spine. Clin Radiol. 2008;63:1035-1048.
34. Suzuki F., Fukami T., Tsuji A., et al. Discrepancies of MRI findings between recumbent and upright positions in atlantoaxial lesion. Report of two cases. Eur Spine J. 2008;17(Suppl 2):S304-S307.
35. Zou J., Yang H., Miyazaki M., et al. Missed lumbar disc herniations diagnosed with kinetic magnetic resonance imaging. Spine (Phila Pa 1976). 2008;33:E140-E144.
36. Madsen R., Jensen T.S., Pope M., et al. The effect of body position and axial load on spinal canal morphology: an MRI study of central spinal stenosis. Spine (Phila Pa 1976). 2008;33:61-67.
37. Milette P.C. The proper terminology for reporting lumbar intervertebral disk disorders. AJNR Am J Neuroradiol. 1997;18:1859-1866.
38. Carrino J.A., Lurie J.D., Tosteson A.N., et al. Lumbar spine: reliability of MR imaging findings. Radiology. 2009;250:161-170.
39. Modic M.T., Ross J.S. Lumbar degenerative disk disease. Radiology. 2007;245:43-61.
40. Marinelli N.L., Haughton V.M., Munoz A., Anderson P.A. T2 relaxation times of intervertebral disc tissue correlated with water content and proteoglycan content. Spine (Phila Pa 1976). 2009;34:520-524.
41. Johannessen W., Auerbach J.D., Wheaton A.J., et al. Assessment of human disc degeneration and proteoglycan content using T1rho-weighted magnetic resonance imaging. Spine (Phila Pa 1976). 2006;31:1253-1257.
42. Sether L.A., Yu S., Haughton V.M., Fischer M.E. Intervertebral disk: normal age-related changes in MR signal intensity. Radiology. 1990;177:385-388.
43. Yu S., Haughton V.M., Sether L.A., et al. Criteria for classifying normal and degenerated lumbar intervertebral disks. Radiology. 1989;170:523-526.
44. Friberg S., Hirsch C. Anatomical and clinical studies on lumbar disc degeneration. 1950. Clin Orthop Relat Res. 1992;279:3-7.
45. Pfirrmann C.W., Metzdorf A., Zanetti M., et al. Magnetic resonance classification of lumbar intervertebral disc degeneration. Spine (Phila Pa 1976). 2001;26:1873-1878.
46. Munter F.M., Wasserman B.A., Wu H.M., Yousem D.M. Serial MR imaging of annular tears in lumbar intervertebral disks. AJNR Am J Neuroradiol. 2002;23:1105-1109.
47. Bielecki D.K., Sartoris D., Resnick D., et al. Intraosseous and intradiscal gas in association with spinal infection: report of three cases. AJR Am J Roentgenol. 1986;147:83-86.
48. de Roos A., Kressel H., Spritzer C., Dalinka M. MR imaging of marrow changes adjacent to end plates in degenerative lumbar disk disease. AJR Am J Roentgenol. 1987;149:531-534.
49. Masaryk T.J., Boumphrey F., Modic M.T., et al. Effects of chemonucleolysis demonstrated by MR imaging. J Comput Assist Tomogr. 1986;10:917-923.
50. Modic M.T., Steinberg P.M., Ross J.S., et al. Degenerative disk disease: assessment of changes in vertebral body marrow with MR imaging. Radiology. 1988;166:193-199.
51. Eubanks J.D., Lee M.J., Cassinelli E., Ahn N.U. Does lumbar facet arthrosis precede disc degeneration? A postmortem study. Clin Orthop Relat Res. 2007;464:184-189.
52. Kalichman L., Hunter D.J. Lumbar facet joint osteoarthritis: a review. Semin Arthritis Rheum. 2007;37:69-80.
53. Fujiwara A., Tamai K., Yamato M., et al. The relationship between facet joint osteoarthritis and disc degeneration of the lumbar spine: an MRI study. Eur Spine J. 1999;8:396-401.
54. Butler D., Trafimow J.H., Andersson G.B., et al. Discs degenerate before facets. Spine (Phila Pa 1976). 1990;15:111-113.
55. Master D.L., Eubanks J.D., Ahn N.U. Prevalence of concurrent lumbar and cervical arthrosis: an anatomic study of cadaveric specimens. Spine (Phila Pa 1976). 2009;34:E272-E275.
56. Schellinger D., Wener L., Ragsdale B.D., Patronas N.J. Facet joint disorders and their role in the production of back pain and sciatica. Radiographics. 1987;7:923-944.
57. Chaput C., Padon D., Rush J., et al. The significance of increased fluid signal on magnetic resonance imaging in lumbar facets in relationship to degenerative spondylolisthesis. Spine (Phila Pa 1976). 2007;32:1883-1887.
58. Doyle A.J., Merrilees M. Synovial cysts of the lumbar facet joints in a symptomatic population: prevalence on magnetic resonance imaging. Spine (Phila Pa 1976). 2004;29:874-878.
59. Lakadamyali H., Tarhan N.C., Ergun T., et al. STIR sequence for depiction of degenerative changes in posterior stabilizing elements in patients with lower back pain. AJR Am J Roentgenol. 2008;191:973-979.
60. D’Aprile P., Tarantino A., Jinkins J.R., Brindicci D. The value of fat saturation sequences and contrast medium administration in MRI of degenerative disease of the posterior/perispinal elements of the lumbosacral spine. Eur Radiol. 2007;17:523-531.
61. Sairyo K., Katoh S., Takata Y., et al. MRI signal changes of the pedicle as an indicator for early diagnosis of spondylolysis in children and adolescents: a clinical and biomechanical study. Spine (Phila Pa 1976). 2006;31:206-211.
62. Ulmer J.L., Elster A.D., Mathews V.P., Allen A.M. Lumbar spondylolysis: reactive marrow changes seen in adjacent pedicles on MR images. AJR Am J Roentgenol. 1995;164:429-433.
63. Inufusa A., An H.S., Lim T.H., et al. Anatomic changes of the spinal canal and intervertebral foramen associated with flexion-extension movement. Spine (Phila Pa 1976). 1996;21:2412-2420.
64. Wiltse L.L., Winter R.B. Terminology and measurement of spondylolisthesis. J Bone Joint Surg [Am]. 1983;65:768-772.
65. Meyerding H. Spondyloptosis. Surg Gynecol Obstet. 1932:371-377.
66. Taillard W. Spondylolisthesis in children and adolescents. Acta Orthop Scand. 1954;24:115-144.
67. Butt S., Saifuddin A. The imaging of lumbar spondylolisthesis. Clin Radiol. 2005;60:533-546.
68. Danielson B., Frennered K., Irstam L. Roentgenologic assessment of spondylolisthesis. I. A study of measurement variations. Acta Radiol. 1988;29:345-351.
69. Danielson B., Frennered K., Selvik G., Irstam L. Roentgenologic assessment of spondylolisthesis. II. An evaluation of progression. Acta Radiol. 1989;30:65-68.
70. Kalichman L., Hunter D.J. Diagnosis and conservative management of degenerative lumbar spondylolisthesis. Eur Spine J. 2008;17:327-335.
71. Rahme R., Moussa R. The modic vertebral endplate and marrow changes: pathologic significance and relation to low back pain and segmental instability of the lumbar spine. AJNR Am J Neuroradiol. 2008;29:838-842.
72. Steinmann J.C., Herkowitz H.N. Pseudarthrosis of the spine. Clin Orthop Relat Res. 1992;284:80-90.
73. Raizman N.M., O’Brien J.R., Poehling-Monaghan K.L., Yu W.D. Pseudarthrosis of the spine. J Am Acad Orthop Surg. 2009;17:494-503.
74. Blumenthal S.L., Gill K. Can lumbar spine radiographs accurately determine fusion in postoperative patients? Correlation of routine radiographs with a second surgical look at lumbar fusions. Spine (Phila Pa 1976). 1993;18:1186-1189.
75. Burkus J.K., Dorchak J.D., Sanders D.L. Radiographic assessment of interbody fusion using recombinant human bone morphogenetic protein type 2. Spine (Phila Pa 1976). 2003;28:372-377.
76. Williams A.L., Gornet M.F., Burkus J.K. CT evaluation of lumbar interbody fusion: current concepts. AJNR Am J Neuroradiol. 2005;26:2057-2066.
77. Miyata S., Kambara K. Bone union after lumbar postero-lateral fusion: comparative evaluation by x-ray and CT. Nippon Seikeigeka Gakkai Zasshi. 1994;68:1023-1032.
78. Suzer T., Tahta K., Coskun E. Intraradicular lumbar disc herniation: case report and review of the literature. Neurosurgery. 1997;41:956-958. discussion 958–959
79. Koc R.K., Akdemir H., Oktem I.S., Menku A. Intradural lumbar disc herniation: report of two cases. Neurosurg Rev. 2001;24:44-47.
80. Kataoka O., Nishibayashi Y., Sho T. Intradural lumbar disc herniation. Report of three cases with a review of the literature. Spine (Phila Pa 1976). 1989;14:529-533.
81. Choi J.Y., Lee W.S., Sung K.H. Intradural lumbar disc herniation—is it predictable preoperatively? A report of two cases. Spine J. 2007;7:111-117.
82. Lam K.S., Carlin D., Mulholland R.C. Lumbar disc high-intensity zone: the value and significance of provocative discography in the determination of the discogenic pain source. Eur Spine J. 2000;9:36-41.
83. Kang C.H., Kim Y.H., Lee S.H., et al. Can magnetic resonance imaging accurately predict concordant pain provocation during provocative disc injection? Skeletal Radiol. 2009;38:877-885.
84. Pfirrmann C.W., Dora C., Schmid M.R., et al. MR image-based grading of lumbar nerve root compromise due to disk herniation: reliability study with surgical correlation. Radiology. 2004;230:583-588.
85. Hilton R.C., Ball J., Benn R.T. Vertebral end-plate lesions (Schmorl’s nodes) in the dorsolumbar spine. Ann Rheum Dis. 1976;35:127-132.
86. Resnick D., Niwayama G. Intravertebral disk herniations: cartilaginous (Schmorl’s) nodes. Radiology. 1978;126:57-65.
87. Peng B., Wu W., Hou S., et al. The pathogenesis of Schmorl’s nodes. J Bone Joint Surg [Br]. 2003;85:879-882.
88. Wu H.T., Morrison W.B., Schweitzer M.E. Edematous Schmorl’s nodes on thoracolumbar MR imaging: characteristic patterns and changes over time. Skeletal Radiol. 2006;35:212-219.
89. Wagner A.L., Murtagh F.R., Arrington J.A., Stallworth D. Relationship of Schmorl’s nodes to vertebral body endplate fractures and acute endplate disk extrusions. AJNR Am J Neuroradiol. 2000;21:276-281.
90. Stabler A., Bellan M., Weiss M., et al. MR imaging of enhancing intraosseous disk herniation (Schmorl’s nodes). AJR Am J Roentgenol. 1997;168:933-938.
91. Takahashi K., Miyazaki T., Ohnari H., et al. Schmorl’s nodes and low-back pain. Analysis of magnetic resonance imaging findings in symptomatic and asymptomatic individuals. Eur Spine J. 1995;4:56-59.
92. Hauger O., Cotten A., Chateil J.F., et al. Giant cystic Schmorl’s nodes: imaging findings in six patients. AJR Am J Roentgenol. 2001;176:969-972.
93. Arnoldi C.C., Brodsky A.E., Cauchoix J., et al. Lumbar spinal stenosis and nerve root entrapment syndromes. Definition and classification. Clin Orthop Relat Res. 1976;115:4-5.
94. Amundsen T., Weber H., Lilleas F., et al. Lumbar spinal stenosis. Clinical and radiologic features. Spine (Phila Pa 1976). 1995;20:1178-1186.
95. Carlisle E., Luna M., Tsou P.M., Wang J.C. Percent spinal canal compromise on MRI utilized for predicting the need for surgical treatment in single-level lumbar intervertebral disc herniation. Spine J. 2005;5:608-614.
96. Kalichman L., Cole R., Kim D.H., et al. Spinal stenosis prevalence and association with symptoms: the Framingham Study. Spine J. 2009;9:545-550.
97. de Graaf I., Prak A., Bierma-Zeinstra S., et al. Diagnosis of lumbar spinal stenosis: a systematic review of the accuracy of diagnostic tests. Spine (Phila Pa 1976). 2006;31:1168-1176.
98. Kent D.L., Haynor D.R., Larson E.B., Deyo R.A. Diagnosis of lumbar spinal stenosis in adults: a metaanalysis of the accuracy of CT, MR, and myelography. AJR Am J Roentgenol. 1992;158:1135-1144.
99. Lurie J.D., Tosteson A.N., Tosteson T.D., et al. Reliability of readings of magnetic resonance imaging features of lumbar spinal stenosis. Spine (Phila Pa 1976). 2008;33:1605-1610.
100. Suzuki K., Takatsu T., Inoue H., et al. Redundant nerve roots of the cauda equina caused by lumbar spinal canal stenosis. Spine (Phila Pa 1976). 1992;17:1337-1342.
101. Dewing C.B., Provencher M.T., Riffenburgh R.H., et al. The outcomes of lumbar microdiscectomy in a young, active population: correlation by herniation type and level. Spine (Phila Pa 1976). 2008;33:33-38.
102. Singh K., Samartzis D., Vaccaro A.R., et al. Congenital lumbar spinal stenosis: a prospective, control-matched, cohort radiographic analysis. Spine J. 2005;5:615-622.
103. Dihlmann S.W., Mayer H.M. Lumbar epidural lipomatosis. Z Rheumatol. 1995;54:417-423.
104. Ishikawa Y., Shimada Y., Miyakoshi N., et al. Decompression of idiopathic lumbar epidural lipomatosis: diagnostic magnetic resonance imaging evaluation and review of the literature. J Neurosurg Spine. 2006;4:24-30.
105. Kuhn M.J., Youssef H.T., Swan T.L., Swenson L.C. Lumbar epidural lipomatosis: the “Y” sign of thecal sac compression. Comput Med Imaging Graph. 1994;18:367-372.
106. Smith J.S., Shaffrey C.I., Ct Kuntz, Mummaneni P.V. Classification systems for adolescent and adult scoliosis. Neurosurgery. 2008;63:16-24.
107. Aebi M. The adult scoliosis. Eur Spine J. 2005;14:925-948.
108. Fraser J.F., Huang R.C., Girardi F.P., Cammisa F.P.Jr. Pathogenesis, presentation, and treatment of lumbar spinal stenosis associated with coronal or sagittal spinal deformities. Neurosurg Focus. 2003;14:e6.
109. Knaub M.A., Won D.S., McGuire R., Herkowitz H.N. Lumbar spinal stenosis: indications for arthrodesis and spinal instrumentation. Instr Course Lect. 2005;54:313-319.
110. Deyo R.A. Magnetic resonance imaging of the lumbar spine. Terrific test or tar baby? N Engl J Med. 1994;331:115-116.
111. Enzmann D.R. On low back pain. AJNR Am J Neuroradiol. 1994;15:109-113.
112. Borenstein D.G., O’Mara J.W.Jr., Boden S.D., et al. The value of magnetic resonance imaging of the lumbar spine to predict low-back pain in asymptomatic subjects: a seven-year follow-up study. J Bone Joint Surg [Am]. 2001;83:1306-1311.
113. Wiesel S.W., Tsourmas N., Feffer H.L., et al. A study of computer-assisted tomography. I. The incidence of positive CAT scans in an asymptomatic group of patients. Spine (Phila Pa 1976). 1984;9:549-551.
114. Boden S.D., Davis D.O., Dina T.S., et al. Abnormal magnetic-resonance scans of the lumbar spine in asymptomatic subjects. A prospective investigation. J Bone Joint Surg [Am]. 1990;72:403-408.
115. Jensen M.C., Brant-Zawadzki M.N., Obuchowski N., et al. Magnetic resonance imaging of the lumbar spine in people without back pain. N Engl J Med. 1994;331:69-73.
116. Boos N., Rieder R., Schade V., et al. 1995 Volvo Award in clinical sciences. The diagnostic accuracy of magnetic resonance imaging, work perception, and psychosocial factors in identifying symptomatic disc herniations. Spine (Phila Pa 1976). 1995;20:2613-2625.
117. Crock H.V. Internal disc disruption. A challenge to disc prolapse fifty years on. Spine (Phila Pa 1976). 1986;11:650-653.
118. Edgar M.A., Ghadially J.A. Innervation of the lumbar spine. Clin Orthop Relat Res. 1976;115:35-41.
119. Fagan A., Moore R., Vernon Roberts B., et al. ISSLS prize winner: The innervation of the intervertebral disc: a quantitative analysis. Spine (Phila Pa 1976). 2003;28:2570-2576.
120. Freemont A.J., Peacock T.E., Goupille P., et al. Nerve ingrowth into diseased intervertebral disc in chronic back pain. Lancet. 1997;350:178-181.
121. Olmarker K., Blomquist J., Stromberg J., et al. Inflammatogenic properties of nucleus pulposus. Spine (Phila Pa 1976). 1995;20:665-669.
122. Kayama S., Konno S., Olmarker K., et al. Incision of the anulus fibrosus induces nerve root morphologic, vascular, and functional changes. An experimental study. Spine (Phila Pa 1976). 1996;21:2539-2543.
123. McCarron R.F., Wimpee M.W., Hudkins P.G., et al. The inflammatory effect of nucleus pulposus. A possible element in the pathogenesis of low-back pain. Spine (Phila Pa 1976). 1987;12:760-764.
124. Olmarker K., Nordborg C., Larsson K., et al. Ultrastructural changes in spinal nerve roots induced by autologous nucleus pulposus. Spine (Phila Pa 1976). 1996;21:411-414.
125. Weishaupt D., Zanetti M., Hodler J., et al. Painful lumbar disk derangement: relevance of endplate abnormalities at MR imaging. Radiology. 2001;218:420-427.
126. Carragee E.J., Don A.S., Hurwitz E.L., et al. 2009 ISSLS Prize Winner: Does discography cause accelerated progression of degeneration changes in the lumbar disc: a ten-year matched cohort study. Spine (Phila Pa 1976). 2009;34:2338-2345.
127. Modic M.T., Obuchowski N.A., Ross J.S., et al. Acute low back pain and radiculopathy: MR imaging findings and their prognostic role and effect on outcome. Radiology. 2005;237:597-604.
128. Shobeiri E., Khalatbari M.R., Taheri M.S., et al. Magnetic resonance imaging characteristics of patients with low back pain and those with sciatica. Singapore Med J. 2009;50:87-93.
129. Carragee E.J., Kim D.H. A prospective analysis of magnetic resonance imaging findings in patients with sciatica and lumbar disc herniation. Correlation of outcomes with disc fragment and canal morphology. Spine (Phila Pa 1976). 1997;22:1650-1660.
130. Maigne J.Y., Rime B., Deligne B. Computed tomographic follow-up study of forty-eight cases of nonoperatively treated lumbar intervertebral disc herniation. Spine (Phila Pa 1976). 1992;17:1071-1074.
131. Komori H., Shinomiya K., Nakai O., et al. The natural history of herniated nucleus pulposus with radiculopathy. Spine (Phila Pa 1976). 1996;21:225-229.
132. Jensen T.S., Albert H.B., Soerensen J.S., et al. Natural course of disc morphology in patients with sciatica: an MRI study using a standardized qualitative classification system. Spine (Phila Pa 1976). 2006;31:1605-1612. discussion 1613
133. Carragee E.J., Han M.Y., Suen P.W., Kim D. Clinical outcomes after lumbar discectomy for sciatica: the effects of fragment type and anular competence. J Bone Joint Surg [Am]. 2003;85:102-108.
134. Lurie J.D., Berven S.H., Gibson-Chambers J., et al. Patient preferences and expectations for care: determinants in patients with lumbar intervertebral disc herniation. Spine (Phila Pa 1976). 2008;33:2663-2668.
135. Kjaer P., Korsholm L., Bendix T., et al. Modic changes and their associations with clinical findings. Eur Spine J. 2006;15:1312-1319.
136. Albert H.B., Manniche C. Modic changes following lumbar disc herniation. Eur Spine J. 2007;16:977-982.
137. Toyone T., Takahashi K., Kitahara H., et al. Vertebral bone-marrow changes in degenerative lumbar disc disease. An MRI study of 74 patients with low back pain. J Bone Joint Surg [Br]. 1994;76:757-764.
138. Mitra D., Cassar-Pullicino V.N., McCall I.W. Longitudinal study of vertebral type-1 end-plate changes on MR of the lumbar spine. Eur Radiol. 2004;14:1574-1581.
139. Braithwaite I., White J., Saifuddin A., et al. Vertebral end-plate (Modic) changes on lumbar spine MRI: correlation with pain reproduction at lumbar discography. Eur Spine J. 1998;7:363-368.
140. Sandhu H.S., Sanchez-Caso L.P., Parvataneni H.K., et al. Association between findings of provocative discography and vertebral endplate signal changes as seen on MRI. J Spinal Disord. 2000;13:438-443.
141. Kokkonen S.M., Kurunlahti M., Tervonen O., et al. Endplate degeneration observed on magnetic resonance imaging of the lumbar spine: correlation with pain provocation and disc changes observed on computed tomography diskography. Spine (Phila Pa 1976). 2002;27:2274-2278.
142. Marshman L.A., Trewhella M., Friesem T., et al. Reverse transformation of Modic type 2 changes to Modic type 1 changes during sustained chronic low-back pain severity. Report of two cases and review of the literature. J Neurosurg Spine. 2007;6:152-155.
143. Modic M.T. Modic type 1 and type 2 changes. J Neurosurg Spine. 2007;6:150-151. discussion 151
144. Kuisma M., Karppinen J., Niinimaki J., et al. A three-year follow-up of lumbar spine endplate (Modic) changes. Spine (Phila Pa 1976). 2006;31:1714-1718.
145. Lang P., Chafetz N., Genant H.K., Morris J.M. Lumbar spinal fusion. Assessment of functional stability with magnetic resonance imaging. Spine (Phila Pa 1976). 1990;15:581-588.
146. Morrison J.L., Kaplan P.A., Dussault R.G., Anderson M.W. Pedicle marrow signal intensity changes in the lumbar spine: a manifestation of facet degenerative joint disease. Skeletal Radiol. 2000;29:703-707.
147. Postacchini F., Cinotti G., Perugia D. Degenerative lumbar spondylolisthesis. II. Surgical treatment. Ital J Orthop Traumatol. 1991;17:467-477.
148. Matsunaga S., Ijiri K., Hayashi K. Nonsurgically managed patients with degenerative spondylolisthesis: a 10- to 18-year follow-up study. J Neurosurg. 2000;93:194-198.
149. Johnsson K.E., Rosen I., Uden A. The natural course of lumbar spinal stenosis. Clin Orthop Relat Res. 1992;279:82-86.
150. Jonsson B., Annertz M., Sjoberg C., Stromqvist B. A prospective and consecutive study of surgically treated lumbar spinal stenosis. Part I: Clinical features related to radiographic findings. Spine (Phila Pa 1976). 1997;22:2932-2937.
151. Athiviraham A., Yen D., Scott C., Soboleski D. Clinical correlation of radiological spinal stenosis after standardization for vertebral body size. Clin Radiol. 2007;62:776-780.
152. Yukawa Y., Lenke L.G., Tenhula J., et al. A comprehensive study of patients with surgically treated lumbar spinal stenosis with neurogenic claudication. J Bone Joint Surg [Am]. 2002;84:1954-1959.
153. Min J.H., Jang J.S., Lee S.H. Clinical significance of redundant nerve roots of the cauda equina in lumbar spinal stenosis. Clin Neurol Neurosurg. 2008;110:14-18.
154. Rothman M.I., Zoarski G.H. Imaging basis of disc space infection. Semin Ultrasound CT MR. 1993;14:437-445.
155. Hitchon P.W., Osenbach R.K., Yuh W.T., Menezes A.H. Spinal infections. Clin Neurosurg. 1992;38:373-387.
156. Malawski S.K., Lukawski S. Pyogenic infection of the spine. Clin Orthop Relat Res. 1991;272:58-66.
157. Priest D.H., Peacock J.E.Jr. Hematogenous vertebral osteomyelitis due to Staphylococcus aureus in the adult: clinical features and therapeutic outcomes. South Med J. 2005;98:854-862.
158. Carragee E.J. Pyogenic vertebral osteomyelitis. J Bone Joint Surg [Am]. 1997;79:874-880.
159. Broner F.A., Garland D.E., Zigler J.E. Spinal infections in the immunocompromised host. Orthop Clin North Am. 1996;27:37-46.
160. Livorsi D.J., Daver N.G., Atmar R.L., et al. Outcomes of treatment for hematogenous Staphylococcus aureus vertebral osteomyelitis in the MRSA ERA. J Infect. 2008;57:128-131.
161. Dagirmanjian A., Schils J., McHenry M., Modic M.T. MR imaging of vertebral osteomyelitis revisited. AJR Am J Roentgenol. 1996;167:1539-1543.
162. Sapico F.L., Montgomerie J.Z. Pyogenic vertebral osteomyelitis: report of nine cases and review of the literature. Rev Infect Dis. 1979;1:754-776.
163. Sapico F.L., Montgomerie J.Z. Vertebral osteomyelitis in intravenous drug abusers: report of three cases and review of the literature. Rev Infect Dis. 1980;2:196-206.
164. Velan G.J., Leitner J., Gepstein R. Pyogenic osteomyelitis of the spine in the elderly: three cases of a synchronous non-axial infection by a different pathogen. Spinal Cord. 1999;37:215-217.
165. Colmenero J.D., Jimenez-Mejias M.E., Sanchez-Lora F.J., et al. Pyogenic, tuberculous, and brucellar vertebral osteomyelitis: a descriptive and comparative study of 219 cases. Ann Rheum Dis. 1997;56:709-715.
166. Batson O.V. The function of the vertebral veins and their role in the spread of metastases. Ann Surg. 1940;112:138-149.
167. Batson O.V. The vertebral vein system. Caldwell lecture, 1956. Am J Roentgenol Radium Ther Nucl Med. 1957;78:195-212.
168. Ratcliffe J.F. Anatomic basis for the pathogenesis and radiologic features of vertebral osteomyelitis and its differentiation from childhood discitis. A microarteriographic investigation. Acta Radiol Diagn (Stockh). 1985;26:137-143.
169. Coman D.R., de L.R. The role of the vertebral venous system in the metastasis of cancer to the spinal column: experiments with tumor-cell suspensions in rats and rabbits. Cancer. 1951;4:610-618.
170. Mitten R.W. Vertebral osteomyelitis in the dog due to Nocardia-like organisms. J Small Anim Pract. 1974;15:563-570.
171. Wiley A.M., Trueta J. The vascular anatomy of the spine and its relationship to pyogenic vertebral osteomyelitis. J Bone Joint Surg [Br]. 1959;41:796-809.
172. Guyer R.D., Collier R., Stith W.J., et al. Discitis after discography. Spine (Phila Pa 1976). 1988;13:1352-1354.
173. Zeidman S.M., Thompson K., Ducker T.B. Complications of cervical discography: analysis of 4400 diagnostic disc injections. Neurosurgery. 1995;37:414-417.
174. Deeb Z.L., Schimel S., Daffner R.H., et al. Intervertebral disk-space infection after chymopapain injection. AJR Am J Roentgenol. 1985;144:671-674.
175. Fraser R.D., Osti O.L., Vernon-Roberts B. Discitis following chemonucleolysis. An experimental study. Spine (Phila Pa 1976). 1986;11:679-687.
176. Fernand R., Lee C.K. Postlaminectomy disc space infection. A review of the literature and a report of three cases. Clin Orthop Relat Res. 1986;209:215-218.
177. Ozuna R.M., Delamarter R.B. Pyogenic vertebral osteomyelitis and postsurgical disc space infections. Orthop Clin North Am. 1996;27:87-94.
178. Resnick D., Niyawana G. Osteomyelitis, septic arthritis, and soft tissue infection: the axial skeleton. In Resnick D., Niwayama G., editors: Diagnosis of bone and joint disorders, ed 2, Philadelphia: WB Saunders, 1988.
179. Romanick P.C., Smith T.K., Kopaniky D.R., Oldfield D. Infection about the spine associated with low-velocity-missile injury to the abdomen. J Bone Joint Surg [Am]. 1985;67:1195-1201.
180. Lloyd T.V., Johnson J.C. Infectious cervical spondylitis following traumatic endotracheal intubation. Spine (Phila Pa 1976). 1980;5:478-479.
181. Barr R.J., Hannon D.G., Adair I.V., McCoy G.F. Cervical osteomyelitis after rigid oesophagoscopy: brief report. J Bone Joint Surg [Br]. 1988;70:147-148.
182. Mattingly W.T., Dillon M.L., Todd E.P. Cervical osteomyelitis after esophageal perforation. South Med J. 1982;75:626-627.
183. Gordon E.J. Infection of disk space secondary to fistula from pelvic abscess. South Med J. 1977;70:114-117.
184. McHenry M.C., Rehm S.J., Krajewski L.P., et al. Vertebral osteomyelitis and aortic lesions: case report and review. Rev Infect Dis. 1991;13:1184-1194.
185. Awad I., Bay J.W., Petersen J.M. Nocardial osteomyelitis of the spine with epidural spinal cord compression—a case report. Neurosurgery. 1984;15:254-256.
186. Meyers S.P., Wiener S.N. Diagnosis of hematogenous pyogenic vertebral osteomyelitis by magnetic resonance imaging. Arch Intern Med. 1991;151:683-687.
187. Tokumoto J.I., Jacobs R.A. Case report: Nocardia osteomyelitis. Am J Med Sci. 1994;307:428-433.
188. Digby J.M., Kersley J.B. Pyogenic non-tuberculous spinal infection: an analysis of thirty cases. J Bone Joint Surg [Br]. 1979;61:47-55.
189. McHenry M.C., Duchesneau P.M., Keys T.F., et al. Vertebral osteomyelitis presenting as spinal compression fracture. Six patients with underlying osteoporosis. Arch Intern Med. 1988;148:417-423.
190. Love C., Patel M., Lonner B.S., et al. Diagnosing spinal osteomyelitis: a comparison of bone and Ga-67 scintigraphy and magnetic resonance imaging. Clin Nucl Med. 2000;25:963-977.
191. Palestro C.J., Torres M.A. Radionuclide imaging in orthopedic infections. Semin Nucl Med. 1997;27:334-345.
192. Elgazzar A.H., Abdel-Dayem H.M., Clark J.D., Maxon H.R.3rd. Multimodality imaging of osteomyelitis. Eur J Nucl Med. 1995;22:1043-1063.
193. Schlaeffer F., Mikolich D.J., Mates S.M. Technetium Tc 99m diphosphonate bone scan. False-normal findings in elderly patients with hematogenous vertebral osteomyelitis. Arch Intern Med. 1987;147:2024-2026.
194. Kern R.Z., Houpt J.B. Pyogenic vertebral osteomyelitis: diagnosis and management. Can Med Assoc J. 1984;130:1025-1028.
195. Rosenthall L., Lisbona R., Hernandez M., Hadjipavlou A. 99mTc-PP and 67Ga imaging following insertion of orthopedic devices. Radiology. 1979;133:717-721.
196. Gratz S., Dorner J., Oestmann J.W., et al. 67Ga-citrate and 99Tcm-MDP for estimating the severity of vertebral osteomyelitis. Nucl Med Commun. 2000;21:111-120.
197. Gratz S., Dorner J., Fischer U., et al. 18F-FDG hybrid PET in patients with suspected spondylitis. Eur J Nucl Med Mol Imaging. 2002;29:516-524.
198. Stumpe K.D., Zanetti M., Weishaupt D., et al. FDG positron emission tomography for differentiation of degenerative and infectious endplate abnormalities in the lumbar spine detected on MR imaging. AJR Am J Roentgenol. 2002;179:1151-1157.
199. Hodges F.S., McAtee S., Kirkpatrick J.S., Theiss S.M. The ability of MRI to predict failure of nonoperative treatment of pyogenic vertebral osteomyelitis. J Spinal Disord Tech. 2006;19:566-570.
200. Kim S.J., Kim I.J., Suh K.T., et al. Prediction of residual disease of spine infection using F-18 FDG PET/CT. Spine (Phila Pa 1976). 2009;34:2424-2430.
201. Larde D., Mathieu D., Frija J., et al. Vertebral osteomyelitis: disk hypodensity on CT. AJR Am J Roentgenol. 1982;139:963-967.
202. Van Lom K.J., Kellerhouse L.E., Pathria M.N., et al. Infection versus tumor in the spine: criteria for distinction with CT. Radiology. 1988;166:851-855.
203. Sharif H.S., Morgan J.L., al Shahed M.S., al Thagafi M.Y. Role of CT and MR imaging in the management of tuberculous spondylitis. Radiol Clin North Am. 1995;33:787-804.
204. Modic M.T., Feiglin D.H., Piraino D.W., et al. Vertebral osteomyelitis: assessment using MR. Radiology. 1985;157:157-166.
205. Ledermann H.P., Schweitzer M.E., Morrison W.B., Carrino J.A. MR imaging findings in spinal infections: rules or myths? Radiology. 2003;228:506-514.
206. Post M.J., Sze G., Quencer R.M., et al. Gadolinium-enhanced MR in spinal infection. J Comput Assist Tomogr. 1990;14:721-729.
207. Gillams A.R., Chaddha B., Carter A.P. MR appearances of the temporal evolution and resolution of infectious spondylitis. AJR Am J Roentgenol. 1996;166:903-907.
208. Kowalski T.J., Layton K.F., Berbari E.F., et al. Follow-up MR imaging in patients with pyogenic spine infections: lack of correlation with clinical features. AJNR Am J Neuroradiol. 2007;28:693-699.
209. Carragee E.J. The clinical use of magnetic resonance imaging in pyogenic vertebral osteomyelitis. Spine (Phila Pa 1976). 1997;22:780-785.
210. Veillard E., Guggenbuhl P., Morcet N., et al. Prompt regression of paravertebral and epidural abscesses in patients with pyogenic discitis. Sixteen cases evaluated using magnetic resonance imaging. Joint Bone Spine. 2000;67:219-227.
211. Kowalski T.J., Berbari E.F., Huddleston P.M., et al. Do follow-up imaging examinations provide useful prognostic information in patients with spine infection? Clin Infect Dis. 2006;43:172-179.
212. Boden S.D., Davis D.O., Dina T.S., et al. Postoperative diskitis: distinguishing early MR imaging findings from normal postoperative disk space changes. Radiology. 1992;184:765-771.
213. Ross J.S., Zepp R., Modic M.T. The postoperative lumbar spine: enhanced MR evaluation of the intervertebral disk. AJNR Am J Neuroradiol. 1996;17:323-331.
214. Modic M.T., Masaryk T.J., Ross J.S., Carter J.R. Imaging of degenerative disk disease. Radiology. 1988;168:177-186.
215. Post M.J., Quencer R.M., Montalvo B.M., et al. Spinal infection: evaluation with MR imaging and intraoperative US. Radiology. 1988;169:765-771.
216. Tang H.J., Lin H.J., Liu Y.C., Li C.M. Spinal epidural abscess–experience with 46 patients and evaluation of prognostic factors. J Infect. 2002;45:76-81.
217. Baker A.S., Ojemann R.G., Swartz M.N., Richardson E.P.Jr. Spinal epidural abscess. N Engl J Med. 1975;293:463-468.
218. Darouiche R.O., Hamill R.J., Greenberg S.B., et al. Bacterial spinal epidural abscess. Review of 43 cases and literature survey. Medicine (Baltimore). 1992;71:369-385.
219. Karikari I.O., Powers C.J., Reynolds R.M. Management of a spontaneous spinal epidural abscess: a single-center 10-year experience. Neurosurgery. 2009;65(5):919-923. discussion 923–924
220. Angtuaco E.J., McConnell J.R., Chadduck W.M., Flanigan S. MR imaging of spinal epidural sepsis. AJR Am J Roentgenol. 1987;149:1249-1253.
221. Sandhu F.S., Dillon W.P. Spinal epidural abscess: evaluation with contrast-enhanced MR imaging. AJNR Am J Neuroradiol. 1991;12:1087-1093.
222. Post M.J., Bowen B.C., Sze G. Magnetic resonance imaging of spinal infection. Rheum Dis Clin North Am. 1991;17:773-794.
223. Martini M., Ouahes M. Bone and joint tuberculosis: a review of 652 cases. Orthopedics. 1988;11:861-866.
224. Smith A.S., Weinstein M.A., Mizushima A., et al. MR imaging characteristics of tuberculous spondylitis vs vertebral osteomyelitis. AJR Am J Roentgenol. 1989;153:399-405.
225. Calderone R.R., Larsen J.M. Overview and classification of spinal infections. Orthop Clin North Am. 1996;27:1-8.
226. al-Mulhim F.A., Ibrahim E.M., el-Hassan A.Y., Moharram H.M. Magnetic resonance imaging of tuberculous spondylitis. Spine (Phila Pa 1976). 1995;20:2287-2292.
227. Sharif H.S., Clark D.C., Aabed M.Y., et al. Granulomatous spinal infections: MR imaging. Radiology. 1990;177:101-107.
228. Smith A.S., Blaser S.I. Infectious and inflammatory processes of the spine. Radiol Clin North Am. 1991;29:809-827.
229. Ragland R.L., Abdelwahab I.F., Braffman B., Moss D.S. Posterior spinal tuberculosis: a case report. AJNR Am J Neuroradiol. 1990;11:612-613.
230. Burrill J., Williams C.J., Bain G., et al. Tuberculosis: a radiologic review. Radiographics. 2007;27:1255-1273.
231. Applebaum G.D., Mathisen G. Spinal brucellosis in a southern California resident. West J Med. 1997;166:61-65.
232. Alarcon G.S., Bocanegra T.S., Gutuzzo E., et al. Articular involvement in human brucellosis. J Rheumatol. 1988;15:379-380.
233. Bozgeyik Z., Ozdemir H., Demirdag K., et al. Clinical and MRI findings of brucellar spondylodiscitis. Eur J Radiol. 2008;67:153-158.
234. Ozaksoy D., Yucesoy K., Yucesoy M., et al. Brucellar spondylitis: MRI findings. Eur Spine J. 2001;10:529-533.
235. Raptopoulou A., Karantanas A.H., Poumboulidis K., et al. Brucellar spondylodiscitis: noncontiguous multifocal involvement of the cervical, thoracic, and lumbar spine. Clin Imaging. 2006;30:214-217.
236. Ozden M., Demirdag K., Kalkan A., et al. A case of Brucella spondylodiscitis with extended, multiple-level involvement. South Med J. 2005;98:229-231.
237. Ross J.S., Modic M.T., Masaryk T.J., et al. Assessment of extradural degenerative disease with Gd-DTPA-enhanced MR imaging: correlation with surgical and pathologic findings. AJNR Am J Neuroradiol. 1989;10:1243-1249.
238. Hubbard D.D., Gunn D.R. Secondary carcinoma of the spine with destruction of the intervertebral disk. Clin Orthop Relat Res. 1972;88:86-88.
239. Resnick D., Niwayama G. Intervertebral disc abnormalities associated with vertebral metastasis: observations in patients and cadavers with prostatic cancer. Invest Radiol. 1978;13:182-190.
240. Meszaros W.T. The many facets of multiple myeloma. Semin Roentgenol. 1974;9:219-228.
241. Stillwell W.T., Fielding J.W. Aneurysmal bone cyst of the cervicodorsal spine. Clin Orthop Relat Res. 1984;187:144-146.
242. Di Lorenzo N., Spallone A., Nolletti A., Nardi P. Giant cell tumors of the spine: a clinical study of six cases, with emphasis on the radiological features, treatment, and follow-up. Neurosurgery. 1980;6:29-34.
243. Modic M.T., Masaryk T.J., Ross J.S. Magnetic resonance imaging of the spine. St Louis: Mosby; 1994.
244. Park Y.H., Taylor J.A., Szollar S.M., Resnick D. Imaging findings in spinal neuroarthropathy. Spine (Phila Pa 1976). 1994;19:1499-1504.
245. Wagner S.C., Schweitzer M.E., Morrison W.B., et al. Can imaging findings help differentiate spinal neuropathic arthropathy from disk space infection? Initial experience. Radiology. 2000;214:693-699.
246. Kaplan P., Resnick D., Murphey M., et al. Destructive noninfectious spondyloarthropathy in hemodialysis patients: a report of four cases. Radiology. 1987;162:241-244.
247. Naidich J.B., Mossey R.T., McHeffey-Atkinson B., et al. Spondyloarthropathy from long-term hemodialysis. Radiology. 1988;167:761-764.
248. Rafto S.E., Dalinka M.K., Schiebler M.L., et al. Spondyloarthropathy of the cervical spine in long-term hemodialysis. Radiology. 1988;166:201-204.
249. Theodorou D.J., Theodorou S.J., Resnick D. Imaging in dialysis spondyloarthropathy. Semin Dial. 2002;15:290-296.
250. Flipo R.M., Cotten A., Chastanet P., et al. Evaluation of destructive spondyloarthropathies in hemodialysis by computerized tomographic scan and magnetic resonance imaging. J Rheumatol. 1996;23:869-873.
251. Bron J.L., de Vries M.K., Snieders M.N., et al. Discovertebral (Andersson) lesions of the spine in ankylosing spondylitis revisited. Clin Rheumatol. 2009;28:883-892.
252. Bollow M. Magnetic resonance imaging in ankylosing spondylitis (Marie-Struempell-Bechterew disease). Rofo. 2002;174:1489-1499.
253. Shih T.T., Chen P.Q., Li Y.W., Hsu C.Y. Spinal fractures and pseudoarthrosis complicating ankylosing spondylitis: MRI manifestation and clinical significance. J Comput Assist Tomogr. 2001;25:164-170.
254. Eschelman D.J., Beers G.J., Naimark A., Yablon I. Pseudoarthrosis in ankylosing spondylitis mimicking infectious discitis: MR appearance. AJNR Am J Neuroradiol. 1991;12:1113-1114.