Data Management

Published on 27/03/2015 by admin

Filed under Neurosurgery

Last modified 22/04/2025

Print this page

rate 1 star rate 2 star rate 3 star rate 4 star rate 5 star
Your rating: none, Average: 0 (0 votes)

This article have been viewed 1315 times

Chapter 29 Data Management

The incorporation of true evidence-based models into the care for spinal disorders necessitates the collection of outcomes metrics throughout the continuum of patient care. Until this is realized, the clinical decision process will continue to rely on subjective, anecdotal evidence, with a risk that ineffective treatments will continue to be performed at both high financial and patient expense. Although this is not a problem among skilled practitioners, this subjective model does nothing to promote improved outcomes at a macro level and does not translate well across health systems.

Ultimately, significant barriers pose a challenge to create a system to capture and evaluate outcome measures consistently. At a very fundamental level, the data collection process has a negative effect on the bottom line. Any system designed to capture outcomes data requires human resources, hardware, and software. At its outset, even the most basic system adds to the cost per visit or admission. Worse yet, the data collection process has the potential to disrupt clinical work flows, and the information collected may not always be immediately useful (some data elements will be clinically relevant, but many will not prove their significance until much later).

All of these factors serve as disincentives to implement a system for collecting information about outcomes of care. However, external forces, such as public reporting of outcomes data and value-based purchasing, are starting to drive demand and will eventually overcome the barriers. In the long term, ignoring the call for objective clinical outcomes will prove to be incredibly costly. Appropriately designed systems will allow practitioners to measure the effectiveness of available treatments against the relative cost. Once this type of analysis is available at the point of clinical decision, physicians can finally apply their clinical expertise for the exceptions and depend on evidence for the “regular” cases. This outcome will allow the provider and the health care delivery system to contain cost while maintaining high standards of care.

Most importantly, a patient-centric approach to spine surgery means that specific clinical characteristics, interventions, and outcomes should be considered in context. Data management for such a varied and distributed dataset is extremely complex. It will require a thoughtful and intentional plan that is executed by a strong team with a wide array of skills, from the clinical through the technologic.

Building a Successful Outcomes Information System

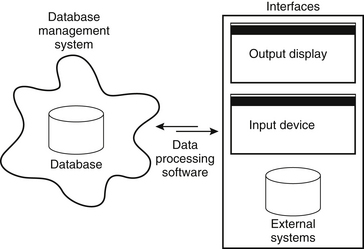
The database itself is but one component of an efficient scheme for data collection, storage, and retrieval. At this point it is necessary to highlight a crucial aspect of understanding outcomes information systems (outcomes systems). The word system is used here to accent the simple distinction between the data “store,” or database (i.e., the electronic data storage mechanism), and its functional environment. Although each system typically has a database at its core that is responsible for data storage, the overall system is much broader, including database management software, data processing software, presentation applications (i.e., browsers), user interfaces (i.e., input and output screens), and the hardware on which it operates (Fig. 29-1). The term database simply refers to the data storage mechanism. Within the context of an overall information system, the database can perform properly, but the database is entirely useless outside of the system. Ideally, a well-designed database drives the development of its interrelated technical components (i.e., hardware and software), resulting in an efficient and elegant solution for outcomes research.

Too often, the term database is used to describe not only the database but also the database management software used to create and administer it. Although the difference is subtle, it is important. Database management software has drastically simplified the database administration process (maintenance and data management) in recent years, and this has fostered the idea that the underlying databases are simple as well. This is a common and costly misconception. A poorly designed database that is at the heart of an outcomes system invariably leads to faulty data processing and an unsuccessful project. Unfortunately, poor database design is not always immediately evident, and a substantial amount of time, effort, and resources can be wasted before the inherent problems manifest themselves.

This discussion is intended to help bridge the divide between individuals who desire a medical outcomes information system and those who possess the knowledge and skills to build and maintain it. There is often a significant gap between the perceived resource requirements, in terms of time, technology, and human resources, the creation of such a system, and the actual requirements. This is especially true with respect to the time necessary for design and development. However, effective communication between the users and the technical staff (i.e., the individuals commissioned to build and maintain a system) can drastically shorten the development cycle. Therefore, here this relationship is analyzed throughout all of the system development stages, beginning with the initial conceptual development and finishing with implementation. The system development process is deconstructed into three key stages: definition, design, and deployment.

System (Project) Definition

Defining the Research Focus

Defining the research focus of the outcomes information system must be a thoughtful, deliberate exercise by the principal investigator, coinvestigators, and clinical project leadership. Carefully defining the question(s) to be answered by the data collected, stored, and ultimately retrieved from the outcomes system is both necessary and critical. A clear vision of the questions at hand, the statistical analysis, and hence the system purpose establishes a solid platform on which the entire system can be built. The result of the definitional phase is the determination of the system/project size and scope from a clinical, technologic, and operational standpoint. Once defined, the ability to obtain answers to the proposed questions serves as the benchmark against which the final system will be evaluated.

A common mistake with system development is to postpone the process of defining the goals, consciously or unconsciously. Individuals who adopt this approach view the definitional phase of the outcomes information system as an evolutionary process in which the defining elements theoretically become evident as the project takes shape, rather than take specific steps to determine them. This inevitably leads to a poorly designed database at the heart of the outcomes system, which functions neither efficiently nor appropriately. Conversely, thorough investigation and due diligence during the definitional phase of the project foster the establishment of a blueprint from which the entire system can be built, thus maximizing the system’s efficiency and its ability to achieve the stated objectives.

Understanding the Clinical and Operational Environment

It is impossible to design an appropriate model for data management without a clear understanding of a physician’s working environment. This includes cataloging the types of disorders that are treated, the available treatment options, and the factors that influence treatment decisions (i.e., patient age, comorbidities, and medical history), the myriad of possible outcome patterns, the nature and impetus of patient-physician interactions, and measures by which treatments are validated. Clearly, it is the clinician who can best describe this environment, and the transfer of this information to the information technology personnel on the project team is critical. Any disconnect between the clinician and the analyst is most damaging during this phase. However, if this divide can be overcome in the early stages of the process, subsequent tasks become increasingly more manageable.

The establishment of clear project objectives primarily provides a blueprint for the information system and also delivers a number of secondary benefits. It is during this phase that the original concept is validated. Participants (e.g., clinicians, nurses, administrators, analysts) have the opportunity to consider every aspect of the project, and most importantly, the outcomes information system has a distinct model for comparison. Without this objective model, there is no clear way to determine whether the overall project goals have been satisfied.

Determining Data Elements

Pursuant to the definition of the outcomes model, difficult decisions surrounding the inclusion of data elements need to be made. The natural tendency is to attempt to collect enough data to potentially answer any question that may surface. This, however, becomes very onerous for both clinician and patient. In this arena, considering patient and provider burden, parsimony is essential.

Input from multiple participants is important during this phase of the process so that critical data elements are not overlooked. However, it is equally important to exclude data elements that do not contribute significantly to the overall goals of the project. Great attention to detail is a requirement in the definitional phase to achieve a proper balance in the data model; the inclusion of too many data elements adds unnecessary strain on the systems resources (both human and technologic), and the exclusion of critical data elements renders the system ineffective.

Beyond the selection process, all of the data elements must be presented in a standardized and concise manner that can be readily adopted by all of the system participants (patients and health care providers). For provider-entered data elements, standardizing the terms used to describe spinal disorders and their manifestations is necessary to allow accurate categorization of patients within each specific disorder. This standardization process is essentially the process of establishing the common language that is subsequently used by all participants. Health care providers will use it to describe their patients, patient symptoms, pathologies, treatment options, and the course of therapy. For patient-reported data, using validated scales and questions that are at the appropriate education level is good practice and optimizes the accuracy of the information.

System Design

Data Mapping and Modeling

Once the nature of the data to be gathered has been defined, the source of the data must be determined. Primary data collection (i.e., patients and clinicians) and electronic sources (i.e., cost and procedure-related data from the operating room and financial systems) must both be considered. The availability and accessibility of these resources varies among institutions. Hence, data acquisition must be tailored to fit. Efficient data acquisitions can be realized through the automation of the data collection process, and automated processes should be introduced to the model wherever and whenever possible. This, of course, is dependent on the availability of data “feeds” from alternate information systems (i.e., patient demographic data retrieved from a patient scheduling system). However, some information will need to be collected directly from clinicians, patients, or both. Outcomes systems must merge all of the data sources gracefully to succeed.

Data sources are not nearly as important, however, as the data destinations. The most critical aspect of system design is found in the modeling of data. Because the components of a clinician’s environment have been clearly outlined during the initial (definitional) phase of the project, the definitions are now readily available for use while designing the outcomes information system. Most effective information systems are merely reflections of real-world models. The outcomes information system is no exception. The entire process shifts from a definitional into a translational role as the descriptions of real-world entities become definitions used in the construction of a virtual model. This process is not academic, but accurate descriptions of the data, the environment, and the relationships among them can markedly simplify the process.

In the initial phase, definitions of the patients and their diagnoses, symptoms, and treatments directly describe the observable aspects of the clinician’s environment. In the design phase, these definitions are abstracted, assuming a role of data description within the database. Hence, the definitional phase determines what data should be stored, and the design phase determines how it should be stored. The design phase is also the stage at which the primary responsibility shifts from the clinician to the system analyst. The system analyst, working from the model constructed by the medical and administrative staff, must develop a database model suitable for accurate, meaningful data processing. The data elements selected and defined earlier must now be organized logically into an overall data design that facilitates consistent data storage and retrieval. New questions will be considered for the same data elements determined in the definitional phase. These are directed at defining the nature of the data.

For instance, if a patient’s medical record number is to be used as the main form of identification, a series of questions about the data element itself need to be addressed. First and foremost, is the medical record number an appropriate identifier? Is it truly unique, or are there circumstances in which multiple patients can share a medical record number? Will the medical record number be readily available at the time the information is collected? Are there any legal or business constraints on the use of a medical record number as a tracking measure within the information system? In this example, although medical record numbers are generally suitable for identifying specific patients, a number of privacy issues concern their use. Current law requires the use of a separate, unique identifier for each patient that is independent of the medical record number. As a result, sensitive information cannot be directly linked back to a given patient outside of the outcomes system itself. Consequently, even though the medical record number is an effective identification technique for patients (and patient records), it may not be an appropriate identifier in the overall data model.

Additional questions regarding the information pertain to the type of the data to be acquired. Drawing from the previous example, is the medical record number numeric, or can alphabetic characters be included? If character data can be used, the medical record number must be stored in a character format. Otherwise, it could make sense to store the data numerically (character formats can include numeric data, but numeric formats cannot accommodate alphabetic characters; for example, “123456” can be stored numerically, whereas “4B3R589” cannot). Once this distinction has been made, it is still necessary to decide which character or numeric format should be implemented. For instance, if a data element is to be used in any mathematical calculations, a numeric data type is necessary. However, numeric data types can be further subdivided into integer, long, float, and double, each with its own range of values, storage space requirements, and functionality (i.e., the float data type typically requires more storage space than an integer data type but permits the use of decimal places, whereas integers do not).

Columns are assigned specific data types during the database design process. Data type assignment is based on the data storage requirements of each column, and valid data entries must conform to their data type designations. The data type selection effectively restricts the allowable values in a given column (i.e., a column storing “date of service” allows only date values). In relational databases (defined later in this chapter), data types provide an excellent example of how the data are controlled implicitly through the actual structure of the data. As a result, it is important to consider current and future data needs while selecting the data type for any column. If used effectively, data typing protects the quality of the data and reduces data entry vulnerabilities.

On a grander scale, the system analyst must also consider established protocols for patient care to design a system that can be incorporated into the clinical workflow with the least amount of resistance. This includes assessing the physical layout of clinical areas, clinical and support staff availability for outcomes system functions, and patient flow throughout the clinical areas, and so on. If workstations are available in a waiting area, perhaps a patient can complete an electronic survey while he or she is waiting to see a physician. Otherwise, paper surveys can be used, but it must be determined whether the surveys, once collected, will then be scanned into the data store or whether data entry will be the responsibility of a staff person.

The most fundamental questions in the design phase address the type of database appropriate for the outcomes research project. If the study includes one clinician and a small patient population, a simple desktop database is more than adequate. In this case, the data store might even take the form of a series of files saved on the investigator’s computer in lieu of a traditional database. However, if the data store must be accessed from numerous physical locations, or if there are many users sending and consuming data, the desktop approach quickly becomes unmanageable. Clearly, quantitative information, including the number of unique patients and patient visits anticipated in a given time, has significant implications concerning the type of database that is to be used. As the demands on the data collection and storage system (i.e., number of data elements, users, and simultaneous research queries) increase, the viable options are narrowed to the realm of database servers, in which the data are centrally stored and managed. Access can be offered over a network (whether local or global). Regardless of the type of database implemented in the outcomes information system, the core principles of database design are applicable. Because the relational database model is the de facto standard in this arena, it is the focus of this discussion.

Relational Database

The relational model takes its name from the mathematical term relation, which can roughly be translated to mean table, the building block for relational databases. Regardless of the method by which the relational system stores the data, presentation to the user for viewing and modification takes a tabular form, constructed of tuples (pronounced like couples) and attributes, commonly referred to as rows and columns, respectively. Although the mathematical terms (i.e., relation, tuple, and attribute) provide the greatest precision in database description, this discussion uses the more familiar terms (i.e., table, row, and column) for greater clarity and comprehension. The relational model presents information stored in each table in such a way that every column contains “like” data. More formally, the data contained in each column are of the same domain, or data type. The data type selection actually restricts the possible values of a column. For instance, the selection of an integer data type prohibits the entry of alphabetic characters in that column. The use of a character format permits both numeric and alphabetic values to be entered, but the values are stored in such a manner that calculations are not possible without first converting them to a numeric data type. For this reason, character formats should not be selected for any columns that store data that may be used in any type of calculations (i.e., scores, ages). However, they are appropriate for identification numbers or text fields.

Each row groups attributes of a specific entity. In a table that stores patient information, every row stores attributes of a specific patient. This contrasts the columnar view, which provides a longitudinal perspective of one specific attribute across the entire population (i.e., all of the ages of patients are stored in the same column). Consequently, the intersection of a row and column is a special occurrence within each table. The intersection represents a specific characteristic of the entity being defined by the row. For example, the patient table in Figure 29-2 contains the columns “PatientKey,” “LastName,” “FirstName,” “Birthdate,” “Physician,” “AppointmentDate,” and “Diagnosis.” The intersection of the first row and the column called “FirstName” indicates that the entity being described (in this case, a patient) has the first name “Jane.”

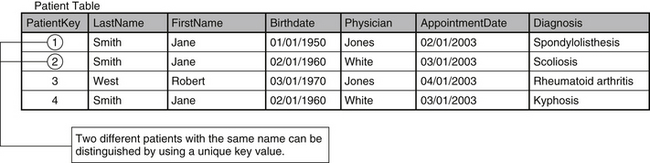
The reliability of these intersections is inextricably bound to the ability to distinguish each row from every1 other row. This requires the assignment of a unique identifier, or primary key, to every row within the table. A common instinct for the row identification in a table that houses patient information is to use the patient’s name as the primary key. This solution, however, breaks down as soon as two different patients with the same name are entered. The medical record number is usually a better alternative, providing a completely unique value for identifying each patient. However, for reasons discussed previously (patient privacy law), the medical record number is not generally a viable option. A more appropriate method is to assign an independent, arbitrary value as a primary key for the row. One column within the table is dedicated to the primary keys (see Fig. 29-2), and will be structured to require that each value is unique.

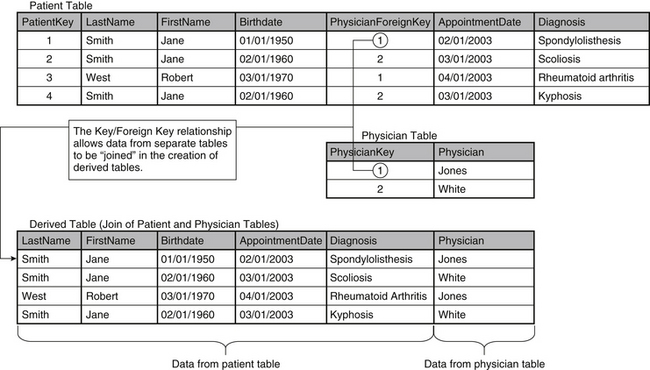
By assigning a distinct value as primary key for each row, two different patients with the same name can now be identified unambiguously. The uniqueness of the primary key is important because it serves as a device to connect different tables within the database. Establishment of these connections, or relationships, across tables becomes essential as the database is normalized (a process of “tuning” the data storage system, discussed later in this chapter). If each row cannot be identified and referenced individually, relationships between separate tables become confused and unreliable. In the relational model, a table’s primary key provides a means for other tables to reference its information. When the primary key of one table is stored in another as a link between them, it is called a foreign key, and it establishes the relationship between the two tables. As a result, data elements that are stored in separate tables in a database can be combined to form new tables (called derived tables), as Figure 29-3 demonstrates. By linking records from the patient and physician tables through the “PhysicianForeignKey” column, a derived table is created that contains the relevant data from both tables.

Although this example is somewhat trivial, the ability of the primary/foreign key model to connect otherwise disjointed tables is clear. As the discussion develops, the importance of this concept will become more evident. The application of the primary/foreign key model is one of the building blocks for normalizing the relational system.

Normalization

The rules of normalization, originally defined by Dr. E F. Codd, deal primarily with the elimination of data redundancies that lead directly to flawed data and impractical, inefficient data management in relational systems.2 The rules of normalization provide solid guidelines for building effective relational database systems. Normalization leverages the actual structure of the database to improve the integrity of the data. In practice, normalization is manifested as a “spreading” of the data, as information is stored throughout the database in many separate tables that are interrelated. Entities should be grouped and related in the same manner that they would be observed in their real-world roles. In the same way, the differences should be maintained by using separate tables (i.e., a patient table should not contain information concerning the physician). Although this idea is fairly simple, it is the foundation of normalizing the database.

Originally, there were only three rules of normalization, but subsequent rules have been added. The rules of normalization are ordered by their degree of specificity, and each higher-order rule is contingent on compliance with each of the previous rules. A database that is in second normal form (term used to describe a database that complies with the second rule of normalization) must also be in first normal form. Each rule is more rigid than its predecessor and more difficult to use. The highest-order rules, in fact, are so strict that they can actually cause a decline in the performance of a relational system. It is uncommon for a production database to achieve anything higher than third normal form.

First Rule of Normalization

The first rule of normalization is somewhat academic: each column in a given row contains one—and only one—value. Violation of this principle is relatively easy to recognize and correct. It would seem unnatural, for instance, to include a column with the head “Physician/Diagnosis” that contains both the name of the physician and the patient’s diagnosis. This problem is easily resolved by separating the two independent values into two distinct columns, “Physician” and “Diagnosis.” A subtler example is demonstrated in the storage of a patient’s name in a single column, rather than creating one column for the first name and another for the last name. Arguments can be made that this is not truly a violation of first normal form, but the two-attribute approach is more suitable because of the common use of last name as an identifier and sort item for groups of patients.

The higher-order rules of normalization deal more specifically with the reduction of data in the relational system. The storage of duplicate information in multiple locations causes the process of modification to become unruly. For example, in the database depicted in Figure 29-2, if Dr. Jones gets married, triggering a name change, two rows are affected (those with values of 1 and 3 in the “PatientKey” column). As a result, the physician values stored in the “Physician” column of each record must be updated, signaling a data storage redundancy. In Figure 29-3, this redundancy is corrected by isolating the physician information into its own table (“Physician”). The data have been effectively reduced, so that the same change requires the update of only one row. This type of data reduction demonstrates the importance of the primary key in the relational model. Separate, related tables are “bridged” by storing the primary key from one table (i.e., “PatientKey”) as a foreign key in another (i.e., “PatientForeignKey”).

Second Rule of Normalization

Although this design strengthens the overall structure of the database, Figure 29-3 has yet to satisfy the standard set by the second rule of normalization: every nonkey attribute must be irreducibly dependent on the primary key.3 The second rule deals with the logical grouping of data elements. Tables should be designed to mirror their real-world counterparts. A table commissioned to store patient data should contain attributes of the patient only, completely separate from other entities, such as diagnosis or physician.

To achieve second normal form, the tables must be restructured. Duplication can be easily identified while reviewing the content of the database, as shown in Figure 29-3. The patient named Jane Smith, who was born February 20, 1960, has two rows in the “Patient” table. As a result, her name and date of birth are repeated unnecessarily. This repetition is caused by the inclusion of the attribute “Diagnosis” as part of the “Patient” table, even though it is functionally independent. To rectify this situation, the “Patient” table must be separated again into a set of smaller tables. This process, known as decomposition, must be “lossless” to maintain the integrity of the data. Just as the term implies, lossless decomposition is a process that retains all essential data and removes redundant values while preserving the ability to reproduce the content of the original table, as needed. This process is demonstrated in Figure 29-3, in which the “Patient” and “Physician” tables are stored separately but can be joined to form a derived table that contains the data from both. It should be noted that derived tables are temporary and should not be included in the long-term data storage design. Derived tables simply provide a convenient, short-term view of related data from separate tables.

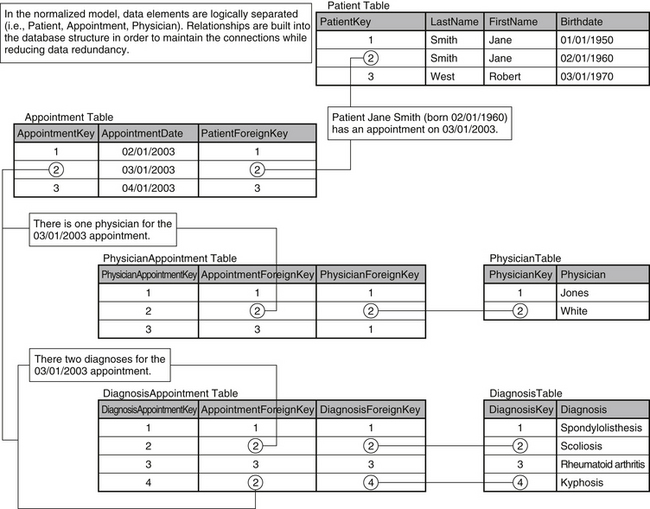
In the current example (see Fig. 29-3), the “Diagnosis” column is the source of the redundancy and must be sequestered to its own table. However, this separation must be done without any data loss. To accomplish this, an “Appointment” table should be added to serve as a bridge between each patient and his or her associated diagnoses. The “Appointment” table also connects patients and physicians.

The relationship between patients and appointments is established by storing the “PatientKey” for each patient in the “PatientForeignKey” column. The relationship between the “Patient” and “Appointment” tables in the database mirrors the relationship between patients and appointments in reality. The relationship can be best described as “one-to-many,” in which one patient can have many appointments. If this relationship is built into the database design, a patient can have multiple appointments (requiring multiple entries in the “Appointment” table) but only one entry is required in the “Patient” table. As a result, the data redundancy visible in Figure 29-3 (in columns “LastName,” “FirstName,” and “Birthdate”) is eliminated.

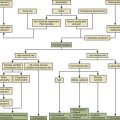
The process of decomposition continues as the diagnosis and physician information are also separated. The relationships between the patient and the associated physician and diagnoses must be maintained. The “Appointment” table is used to connect the “Patient,” “Physician,” and “Diagnosis” tables. Once again, the database design draws from a real-world example. An appointment is the point in the treatment process at which the patient meets with the physician and the physician determines the diagnosis. The database model is a natural extension of this relationship. The restructured database is shown in Figure 29-4.

Two tables worth mentioning have been introduced into the model “PhysicianAppointment” and “DiagnosisAppointment.” Up to this point, all of the tables included in the database have been based in the real world, but the new tables are more abstract. Their sole function is to establish a link between tables in such a way that the principles of normalization are not compromised. As a result, they do not have real-world counterparts.

The new tables are necessary because of the nature of the relationships between both appointments and diagnoses and appointments and physicians. These relationships are best described as “many-to-many.” For example, every appointment can be associated with multiple diagnoses, and every diagnosis can be associated with multiple appointments. “Junction” tables must be included in the database model to account for this interaction and eliminate data redundancy. In the absence of these tables, multiple diagnoses in any given appointment would cause the unnecessary repetition of appointment data.

Technologic Vulnerabilities

The most important factor when considering system vulnerabilities is the protection of data. Access to the database should be restricted to legitimate users, and the nature of access should be structured to fit the use patterns of each specific user. Full access to every component of the database should be limited to the database administrator. Read-only access for all other users is preferred, reserving write access (update) for situations that require it. For example, a physician will need to update the tables used for any direct data entry (i.e., symptoms, diagnosis), implying write access. However, the same physician will not need permission to update a patient survey table, in which read-only access will suffice. Provision of full access to the database for all users can easily result in the corruption of data.

Control of permissions to the database can be managed with the database management systems built into most commercial database packages. Access can be restricted on a table-by-table basis (by the administrator), allowing for access customizations to fit the use patterns, as previously discussed. Additional layers of software can also be built on top of the database to further control access. Customized software applications can be written to limit user interaction with the database and provide data verification functions. These added tiers act as a buffer for the outcomes system and can effectively monitor the quality of the information before it reaches the database.

A subtler vulnerability relates to the timeliness of the data. The timing and availability of information stored in the database vary significantly, depending on the method of data collection. This becomes critical when some data elements are dependent on others. For example, an outcomes system that tracks patients by appointment creates such a scenario. At each appointment, the patient completes a survey and the physician completes an assessment of the patient’s health. In the database model for such a system, the appointment provides the bond between the patient survey and the physician assessment. Relationships have been established in the database design that link the table of appointments with the tables for surveys and assessments. If a particular appointment is not present in the appointment table, it cannot be referenced by either of the other tables, and any attempt to do so will result in an error, preventing the database from being updated.

Participation provides another interesting challenge in the pursuit of an outcomes system. Data collection systems that are too costly in terms of time, effort, or resources will not succeed. A successful model is one that leaves the smallest possible footprint, a prospect that is best realized through collaboration. In the health care industry, the availability of information has increased exponentially in recent years. Pursuant to this, outcomes systems are afforded the opportunity to draw from many sources within the organization. Data are collected and retained for every patient throughout the scheduling, registration, treatment, and billing processes as the trend of paperless patient care continues. Consequently, information is typically stored in many different systems throughout the organization, and effective outcomes systems draw from these disparate data sources whenever possible. Not only does the sharing of data reduce the possibility of errors stemming from data entry, but it also minimizes the level of effort necessary from the participants (both patients and physicians). For example, if a patient’s demographic information is gathered for the registration process, it should not be necessary to collect it again when the patient completes a survey. As multiple systems are leveraged within the outcomes system, the resulting automation can significantly reduce the risk of unverified data. Moreover, participation levels improve as the required effort decreases.

Building the System

As mentioned previously, the three major components of any electronic information system are technology, people, and processes in which the human and technologic components interact. When analyzing the requirements for building a system and diagnosing any shortfalls or failures of a system once it is built, it is useful to categorize the required inputs and/or desired outputs (i.e., expectations) of these three component parts. The preceding sections of this chapter have been devoted primarily to technology and processes; this section focuses on understanding the people involved and their roles in creating the system.

As a prerequisite for success, human resources from the clinical, information technology, and administrative areas of the organization must be dedicated to the project. Participating individuals must be highly skilled in their respective disciplines, and ideally (to help champion the project), they should command a high degree of respect among their peers before joining the project team. Furthermore, they should be able to sustain a high degree of personal commitment to the success of the project over the long range (typically a period of 3–5 years) and possess excellent interpersonal and team-building skills (i.e., listening, speaking, demonstrating a collaborative work style, showing sensitivity to individual differences). Each member of the project team must fully understand and agree to accept a defined role in the process of system development and implementation.

First and foremost, a project leader, director, or manager must be identified. The project leader is responsible for the overall success of the system via effective management of all aspects of the project. It is recommended that a clinician fill this role in any health care information system project, because clinicians are the key stakeholders in these projects. Clinical support, guidance, and direction are vital to the development of a system that will actually meet the needs of physicians and nurses. This is true from both an input (i.e., the data elements to be collected and collection process requirements in the clinical setting) and output (i.e., the data and information produced and provided to clinicians by the system) perspective. If the end result of all of the time, money, and effort invested in the system does not satisfy the clinical participants and stakeholders, the project surely has failed. If the perceived benefits do not outweigh the actual and perceived costs of participating in the system, it has failed as well.

All project team members are expected to take responsibility for ensuring the success of the system as it relates to their respective disciplines. For example, the physicians and nurses are responsible for the clinical success of the system. As such, they must ascertain that the data elements to be collected and information outputs are meaningful and relevant to clinicians, that the collection process is user-friendly to their colleagues and patients, and that the data collected will produce appropriate, clinically valid, and meaningful output for clinical outcomes measurement and research. The entire team relies exclusively on the clinical contingent to assess and decide all clinical parameters.

A system analyst is required to assume responsibility for the technical success of the system. Regardless of his or her actual title or position within the organization, this person must be highly skilled and knowledgeable, with respect to efficient and effective data management strategies, project management strategies, and the fundamental principles of information systems. Most importantly, relationships must be fostered between the technical and clinical personnel, so that each has a keen understanding of the other’s working environment. The system analyst will not be able to build a system tracking clinical activity and patient outcomes without a clear description of the physicians’ working environment. Inefficiencies in the project will develop if clinicians cannot describe this setting in a manner that the system analyst can comprehend.

Finally, an administrative representative is relied on to manage the operational and financial aspects of the project. For the project to be successful, the system must ultimately “fit” into the constraints of a busy and demanding clinical setting, especially because it requires collecting data from both physicians and patients at the time of an outpatient visit. This is typically the greatest challenge in developing such systems and has been noted as a major obstacle to outcomes measurement systems development. Data collection methods must be evaluated from a cost-benefit perspective and for user-friendliness. Securing “buy in” from affected operational and clinical personnel is essential, and this task is typically shared by the entire team, although the administrative representative carries the main responsibility for this function throughout the project. The administrator also handles tasks such as securing copyright permission for patient surveys or Institutional Review Board (IRB) approval of clinical studies when applicable, preparing a budget and securing approvals, informing clinical and operational personnel as to project milestones, implementation schedules, and so on. It is recommended that at least one management representative join the team for the entire duration of the project, whereas other operational or financial personnel may be called on to participate in or consult with the project team for defined project tasks.

Measuring Success

Both objective and subjective indicators can gauge the success of an outcomes information system. Establishing the metrics by which the system’s success will be measured is ideally done early in the project development phase. This ensures that the system created is, in fact, that which is desired by the stakeholders. A simple report that presents the results of objective and subjective evaluations is useful and recommended. Ideally, monthly reports are generated during the first year or two of implementation.

In the final evaluation of any outcomes system, both objective and subjective measures must be considered. Both measures combine to form a critical component of an ongoing monitoring and evaluation of the system. Feedback will not only help to determine the effectiveness and relevance of the outcomes project but will also be used as the primary tool to develop enhancements and refinements as the system evolves.

Objective Metrics

The number/percentage of all patients seen, in the target population, from whom patient-reported data are collected. Example: 89 of 100 (89%) patients seen in March 2002 completed the required data collection survey.

The number/percentage of all patients seen, in the target population, for whom physician-reported data were collected. Example: Physicians submitted data on 90 of 100 (90%) patients seen in March 2002.

The number/percentage of survey “matches” between physician and patient-collected data. Example: For the 200 surveys collected from patients during March 2002, 190 (95%) surveys were collected on the same patients by physicians.

The number/percentage of surveys (either physician or patient) completed entirely (no questions or sections left blank or illegibly marked). Example: 95 of 100 (95%) surveys completed by physicians (or patients) were complete.

The average and range of time required for patients to complete a survey. Example: Patients spent between 10 and 35 minutes to complete a survey (average, 15 minutes).

The average and range of time required for physicians to complete a survey. Example: Physicians spent between 5 and 15 minutes to complete a survey (average, 7 minutes).

Based on a random cross-check of selected fields from 20 completed physician-reported surveys with the corresponding patient medical record, the number and percentage of surveys in which the survey data were in agreement with the medical record. Example: In 16 of 20 (80%) physician surveys, the selected data fields were in complete agreement with the medical record.

Quantification of individual physician participation relative to other physicians within the department (e.g., physician A provided data on 62% of patients compared with a department-wide percentage of 84%).