[level-membership-for-cardiovascular-category]
CHAPTER 80 Computed Tomographic Angiography
Clinical Techniques
DSA remains the gold standard method for evaluation of atherosclerosis within the vasculature; however, this is a minimally invasive technique with the potential for iatrogenic complications. Therefore, noninvasive imaging methods are desirable among patients and physicians alike. With the advent of MDCT, noninvasive angiography has become a viable option as a result of increased speed, spatial resolution, and volume coverage. CTA revolutionized vascular imaging when vessels smaller than 1 mm in diameter were imaged with single-slice spiral CT.1–5 However, because of the small volume of coverage and limitations in the speed of image processing, CTA did not become widely used until the introduction of MDCT in 1998.6–8 With the advent of MDCT, temporal and spatial resolution of the scanners significantly improved.9,10 Gantry rotation times of 0.28 to 0.5 second with slice thickness of 0.33 to 0.75 mm are now available on most MDCT scanners.
With MDCT, there are several parallel detectors along the z-axis, and multiple channels of data (currently up to 320) significantly improve z-axis resolution. This allows isotropic resolution for most vascular applications with images obtained during a single short breath-hold. The result has been elimination of the tradeoff between spatial resolution (z-axis) and scanning range, an important limitation of single-detector spiral CT.11,12 Hence, a significant benefit has been a paradigm shift from single-slice to volumetric data acquisition. This, in turn, has made imaging of different vascular phases with a single bolus of contrast material a reality.7 Isotropic data sets allow three-dimensional reconstruction and a variety of postprocessing methods to enable both diagnostic interpretation and eloquent anatomic and pathologic arterial display.
The advantages of CTA include lower cost and the ability to potentially reduce the total volume of contrast material administered. With the fastest scanners currently available, abdominal CTA can be performed with as little as 50 mL of contrast material with the use of saline flush.13,14 This requires meticulous attention to the timing of bolus administration of the contrast material, which is discussed later in this chapter. In evaluation of life-threatening vascular disease, such as traumatic aortic injury or pulmonary embolus, CTA has a clear advantage because of short acquisition times.15
Increased utility of CT has led to significant increase in radiation exposure and concerns about its effect.16 CT currently accounts for approximately 75% of the total radiation dose delivered by medical imaging.17 Development of automatic tube current modulation software that is now available on all advanced MDCT systems has been a positive side effect of this awareness. Tube current modulation automatically adjusts the current during scanning to decrease the amount of radiation in anatomic regions that do not require higher current (e.g., lung bases or above the iliac crest) while maintaining image quality.16 In the appropriate setting, CTA may be performed with a reduced kilovoltage setting to decrease radiation to the patient and to improve signal-to-noise ratio.18
TECHNICAL REQUIREMENTS
Technical Components and Design
Image Quality
Factors affecting image quality and characteristics of CTA images include temporal and spatial resolution. Spatial resolution refers to the degree of blurring in the image and the ability to discriminate objects and structures of small size. Axial resolution within the scan plane can be improved by using a small field of view, larger matrix size, smaller focal spot, and smaller detectors. The demand for high spatial resolution to visualize the various coronary segments that course with decreasing diameter to the apex is high. One of the major goals of MDCT technology development has been to obtain similar spatial resolution in all directions, also expressed as isotropic spatial resolution.19 CTA requires high spatial resolution to enable accurate detection and interrogation of small arterial branch vessels. Both in-plane and through-plane spatial resolutions are important indices that require optimization to provide isotropic source data. Isotropic means that the spatial resolution is approximately equal in all planes, which is necessary to enable multiplanar image reconstruction after acquisition. Isotropic data avoid loss of spatial resolution in one plane and reduce partial volume effects after source data reconstruction.20 The increased scanner detector numbers has allowed increased through-plane spatial resolution as the detector width is reduced with increased numbers (1 to 1.25 mm with 4-detector row CT, 0.5 to 0.625 mm with 64-detector row CT).21 The new MDCT scanners have not improved in-plane spatial resolution; this is determined by detector geometry and the convolution kernel (reconstruction algorithm).20 Temporal resolution is defined as the required time for data acquisition per slice. It represents the length of the reconstruction window during each heart cycle, which is determined by the gantry speed.
Detectors
Diagnostic performance in coronary CTA is primarily determined by temporal resolution, which is the required time for data acquisition per slice. The determinant of this is the gantry rotational speed. For the typical setup of a single tube and detector, half a gantry rotation is necessary to acquire the data for volume reconstruction, that is, temporal resolution is equal to half gantry rotation. The temporal resolution of a 64-slice CT scanner with a gantry rotation of 330 ms is 166 ms. For motion-free images to be obtained at any phase in the cardiac cycle, a temporal resolution of 10 ms is required. Achievement of such high temporal resolution is impossible with CT. As a result, cardiac CT phase reconstruction is centered on the quiescent or low-motion window in end-diastole. The postulated required temporal resolution for reliable cardiac imaging is in the range of 65 ms.22 One manufacturer has developed a 256-slice CT scanner (128 × 0.625) with a rotation time of 270 ms and temporal resolution of 135 ms. However, with automatic multisegmental reconstructions with voxel-based optimization, temporal resolutions up to 68 ms are achieved.
Image Acquisition and Reconstruction
Prospective Gating
Hsieh and coworkers23 have developed a new approach for CTA referred to as prospectively gated axial. This technique uses a combined step-and-shoot axial data acquisition and an incrementally moving table with prospective adaptive ECG triggering. This method takes advantage of the large-volume coverage available with the 64-slice MDCT scanner that enables complete coverage of the heart in two or three steps. With this technique, the table is stationary during the image acquisition. It then moves to the next position for another scan initiated by the subsequent cardiac cycle. The result is very little overlap between the scans, significant (50% to 80%) reduction in radiation dose, and more robust and adaptive ECG gating. Earls and associates24 reported an effective dose for the prospectively gated axial group (mean, 2.8 mSv) that was significantly lower than that for the retrospectively gated helical group (mean, 18.4 mSv). This represents a reduction in mean effective dose to the patient by up to 80% from the retrospectively gated helical to the prospectively gated axial approach.
Contrast Detection and Administration
With shortened acquisition times of MDCT, optimization and maximization of vascular enhancement have become more challenging.25,26 CTA requires excellent contrast enhancement of the targeted vessels. A good-quality CT angiogram requires an arterial density value of greater than 200 HU.27,28 This should be achieved rapidly, and the peak should coincide with the acquisition interval. It is therefore crucial to time the contrast bolus correctly. However, rapid administration of contrast material shortens the plateau phase of contrast enhancement, thus creating further challenge for correct timing of the study.25,26,29 For most CTA applications, an injection rate of 4 to 5 mL/sec yields optimal vascular enhancement.
Several factors affect time to peak from the start of contrast bolus administration. These include the iodine content of the contrast material, the injection rate, and the patient’s cardiac status.25,26,30,31 A faster injection rate, for example, can achieve a higher density in the targeted vessel and results in a higher quality CT angiogram. It also separates the arterial from the portal venous phase and hence results in excellent image quality without cross-contamination by different phases.25 Contrast material with higher iodine concentration improves vascular enhancement if all other parameters are held constant.25,32 An important consideration with the 16- and 64-slice scanners is the possibility of “outrunning” the contrast bolus in patients with low cardiac output or in cases that require long z-axis coverage (e.g., combination of extremity and abdominal CTA); to overcome this issue, one can slow down the scanner by increasing the gantry rotation time and slowing the table speed.33,34
Fixed Scan Delay
Few authors currently use the method of setting a standard timed scan delay after the intravenous administration of contrast material to acquire images in the arterial phase.35,36 By setting the same scan delay for every patient, one is assuming that exactly the same hemodynamic conditions exist in all patients. This method does not accommodate patients with any variation from the normal (i.e., low blood pressure, low cardiac outputs, hypovolemia, high outputs). We would not agree with employing this method of a fixed scan delay time.
Bolus Tracking
To more accurately determine the optimal scan delay after intravenous administration of contrast material in patients with variable hemodynamics, the technique of contrast bolus tracking can be employed. Used by many authors,37,39 this is an efficient way to optimize arterial opacification. Initially, a single low-dose CT image is obtained, without administration of contrast material, at the level of the common carotid for the carotids, the ascending aorta for the coronary and thoracic aorta, and the celiac axis for the abdominal aorta and runoffs. A 10- to 15-mm2 circular region of interest is placed inside the middle of the aortic lumen, and this will subsequently measure the Hounsfield units of the aortic lumen on subsequent scanning. At 8 to 10 seconds after intravenous administration of contrast material, serial low-dose monitoring CT scans are obtained at the same table position at 1-second intervals. When the region of interest detects a preset contrast enhancement level (usually 100 to 150 HU value), there is automatic triggering of the scanner to acquire images in the desired scan range. This time-efficient method ensures optimal arterial enhancement within the region of interest, which can be moved to a different arterial location if desired. It enables lower contrast use and reduces scan-to-scan and patient-to-patient variability in arterial opacification.
Test Bolus
Another method to optimize arterial contrast opacification is that of a test bolus or timing bolus acquisition. Described by a number of authors,38,40 this technique involves intravenous administration of a small bolus (20 to 30 mL) of contrast material followed by serial CT data acquisitions at one table position, usually at the levels described for bolus tracking. Images are acquired, after a scan delay of 8 to 10 seconds, every 1 to 2 seconds for a predetermined number of images (20 to 40) or until the CT technologist chooses to manually stop the acquisition after the contrast peak within the aorta. A time versus Hounsfield unit (attenuation) curve is then generated by placing a region of interest over the contrast-opacified aorta. The time taken to reach peak opacification is then used as the scan delay for the actual CTA and thus corresponds to the time taken for the contrast material to pass from the intravenous injection site of interest. This method is useful as it detects variable transit times between patients with different hemodynamic states and allows individualization of scan delays.
Adaptive Method
The runoff vessels in the symptomatic limb can be problematic with CTA as a result of proximal/in-flow stenosis or, alternatively, distal hyperemia at the site of arterial ulceration; these can cause arterial flow discrepancy between the two lower limbs. Thus, one limb will have a faster flow rate than the other, resulting in good contrast opacification of the arteries ipsilaterally but failed opacification contralaterally. CT fails at eliciting dynamic information. This problem may be somewhat reduced by use of an adaptive method of contrast detection that was described by Qanadli and associates.41 This method is similar to that of a test bolus technique in that a small 30-mL contrast bolus is administered intravenously, followed by two low-dose (20 mA, 120 kV) CT acquisitions. The first is at the level of the descending thoracic aorta (at vertebra level T12) acquired 20 seconds after the start of intravenous administration of the contrast material for 10 seconds; the second level is the popliteal arteries below the knee acquired 30 seconds after the start of the intravenous bolus (i.e., after the aortic level is finished). Three time-density curves are created, one from the aortic level and one from each of the popliteal artery levels. The time to peak contrast enhancement is then determined for each level (aortic time = T1; popliteal time = T2). If the right and left popliteal times are different, the symptomatic leg or the longer time is taken to be T2. The aortopopliteal transit time (Tt) is determined from T2 − T1. The CT gantry rotation time and table speed are then set to match Tt in order that the popliteal artery will be imaged at peak enhancement. T1 is the delay time between commencement of the usual intravenous contrast bolus and commencement of data acquisition.41 Laswed and colleagues42 applied this adaptive method clinically in patients with peripheral arterial disease, with DSA correlation, and determined that MDCTA has a sensitivity and specificity of 100% for arterial lesion detection on a per-patient basis. Analyzed on a per-segment basis, MDCTA had a sensitivity and specificity for lesion detection of 91% and 96%, respectively, in the below-knee arteries and 100% and 90%, respectively, in the distal pedal arteries. This method was found to be reproducible, had high image quality, avoided the problem of venous overlay, and resolved the issue of differential peripheral arterial opacification.42
Contrast Media Concentration
A recent review attempted to determine the difference that contrast media iodine concentration makes to image quality of MDCTA in the peripheral vasculature.43 All of the studies reviewed used iodine concentrations of 300 mg/mL and higher; whereas improved arterial enhancement and visualization were demonstrated with higher iodine concentrations, there was no clear evidence of a significant difference in diagnostic efficacy for the different iodine concentrations.43 Iezzi and coworkers,44 comparing iodine concentrations of 300 mg/mL with 400 mg/mL on a 4-detector scanner, also determined no significant differences in diagnostic ability of CTA for peripheral arterial disease. This could perhaps be explained by applying findings from the coronary CTA literature, whereby Becker and colleagues45 determined that coronary artery attenuation levels of 250 to 300 HU were optimal for the evaluation of coronary artery disease because higher attenuation values may underestimate the amount of atherosclerosis owing to obscuration of vessel wall calcification. In our institution, we use a contrast media iodine concentration of 350 mg/mL.
Dual-Head Power Injectors
To achieve the desired arterial Hounsfield unit, a fast iodinated contrast injection with a tight arterial contrast bolus is necessary. Thus, patients will need to have a well-positioned, large-bore (18-gauge), intravenous cannula within the antecubital fossa. A dual-head power injector permits both contrast material and saline to be administered separately, concurrently, and sequentially. This means that two separate injection phases are possible, the first with 100% iodinated contrast material and the second with a 100% saline flush. The advantages of this method are that the arterial contrast enhancement is improved and prolonged, the contrast dose is reduced because most of the administered contrast material is within the arterial side, and the saline flush at the end clears dense contrast material from the superior vena cava to avoid streak artifact.14,30,46 The value of a triphasic injection strategy with an extra second phase comprising a contrast-saline mixture could also potentially reduce the requirements for contrast material. The new multislice scanners in combination with dual-head injectors allow marked decrease in the amount of contrast material used for routine CTA. However, the total volume of contrast material administered for a routine abdominal CT study (usually 150 mL of 300 mg/mL concentration of contrast material) should not change if solid organs, such as liver, are evaluated in conjunction with CTA. Lowering of the total volume of contrast material may potentially reduce the sensitivity of lesion detection.12,32
Many authors have reported the use of gadolinium chelates for CTA in patients who have diminished renal function.47–50 Although gadolinium is radiodense and may be used as a contrast agent with radiography, many gadolinium-based products have higher osmolality than iodine-based contrast media and are therefore potentially more nephrotoxic. More important, there have been several reports of nephrogenic systemic fibrosis leading to serious physical disability in patients with end-stage renal disease receiving gadolinium-containing contrast agents.51,52
TECHNIQUES
Indications and Technique Description
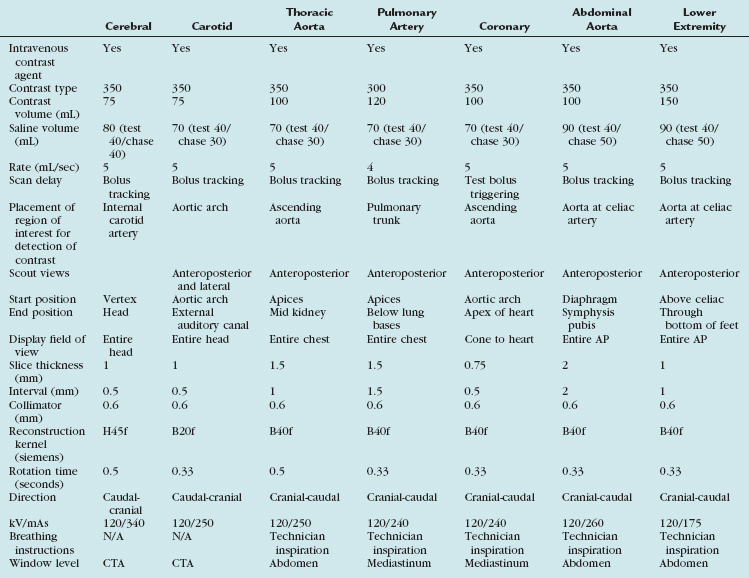
Scan protocols are highly variable and depend to a large extent on the type of MDCT scanner available (i.e., 4-, 16-, 64-, 128-, or 320-detector or dual energy) and also the manufacturer of the scanner. A suitable protocol should be chosen and programmed into the individual scanner for routine use. For the best CTA, a 16-slice scanner or higher should be used. A summary of the various protocols for the different vascular territories is outlined for a typical 64-slice MDCT scanner (Table 80-1).
TABLE 80-1 Summary of the Various Protocol Parameters for the Different Vascular Territories on a Typical 64-Slice MDCT Scanner
Cerebral CTA
Automated bolus tracking is the preferred technique to reliably obtain the optimal arterial phase by placing a region of interest on the internal carotid artery close to the skull base. An injection volume of 75 mL of a contrast agent with high iodine concentration (350 mg/mL) at a flow rate of 5 mL/sec is typically used. Images are acquired in the caudal to cranial direction with a slice thickness of 1 mm, slice interval of 0.5 mm, and 0.6 mm of collimation (Fig. 80-1).
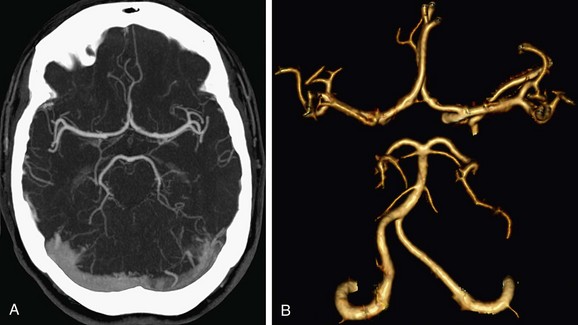
 FIGURE 80-1
Carotid CTA
In the United States, stroke is the leading cause of adult disability and the third leading cause of death; only heart disease and cancer cause more deaths annually. About 80% of strokes are ischemic strokes. Ischemic cerebrovascular events are often related to atherosclerotic narrowing at the carotid bifurcation. Conventional DSA is the reference standard for the evaluation of carotid artery disease.53,54 The advantage of noninvasive CTA is the reduction in cost and procedural risks. With conventional DSA, several studies have demonstrated up to a 4% risk of transient ischemic attack or minor stroke, a 1% risk of major stroke, and a small (<1%) risk of death.55 Plaque composition can be evaluated by CTA, which is an important indicator of plaque stability and helps with the assessment of risk factors for thromboembolic events. Noninvasive CTA provides the necessary information required before carotid endarterectomy and endovascular therapies.
Automated bolus tracking or test bolus triggering techniques can reliably obtain the optimal arterial phase by placing a region of interest on the aortic arch. An injection volume of 75 mL of a contrast agent with high iodine concentration (350 mg/mL) at a flow rate of 5 mL/sec is typically used. Images are acquired in the caudal to cranial direction with a slice thickness of 1 mm, slice interval of 0.5 mm, and 0.6 mm of collimation (Fig. 80-2).
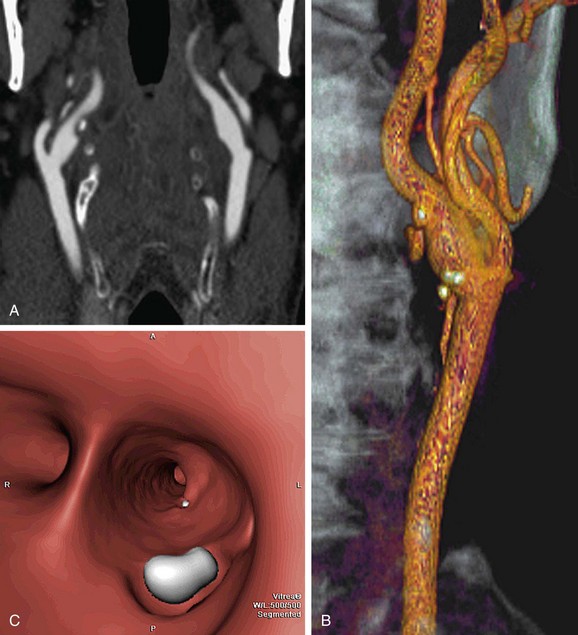
 FIGURE 80-2
Thoracic CTA
Conventional DSA is regarded as the reference standard for evaluation of the thoracic arterial system. CTA of the thoracic aorta is currently the preferred method, however, for follow-up of patients with thoracic aortic aneurysms.56 It can, in addition to evaluating luminal disease, assess the vessel wall for plaque composition, hematoma, and dissections. Three-dimensional images demonstrate the normal anatomic relationship of the branch vessels, the mediastinal structures, and the extent of the disease process.
Automated bolus tracking or test bolus triggering techniques can reliably obtain the optimal arterial phase by placing a region of interest on the ascending aorta. An injection volume of 100 mL of a contrast agent with high iodine concentration (350 mg/mL) at a flow rate of 5 mL/sec is typically used. Images are acquired in the cranial to caudal direction with a slice thickness of 1.5 mm, slice interval of 1.0 mm, and 0.6 mm of collimation (Figs. 80-3 to 80-5).
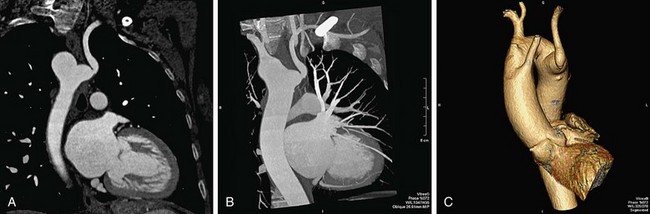
 FIGURE 80-3
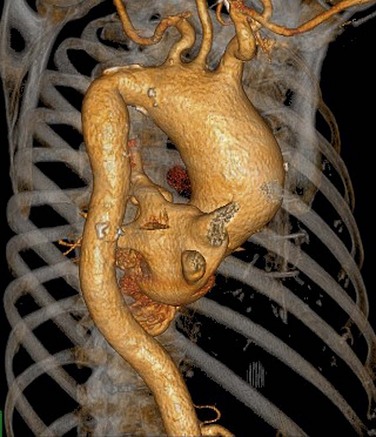
 FIGURE 80-4
 FIGURE 80-5
Pulmonary CTA
The introduction of MDCT has led to CTA being the technique of choice for the evaluation of most known or suspected pulmonary vascular pathologic processes. Spatial resolution has improved significantly, allowing the detection of very small peripheral pulmonary emboli.57 Pulmonary CTA can also be used to evaluate for pulmonary hypertension, systemic arterialization of the lung parenchyma in pulmonary sequestration, pulmonary arteriovenous malformations, and congenital pulmonary vascular anomalies. For the evaluation of pulmonary embolism, conventional DSA is still considered the gold standard, but it is rarely used.58,59
The scanning volume starts at the lung and extends caudally to below the lung bases. Automated bolus tracking can reliably obtain the optimal arterial phase by placing a region of interest on the main pulmonary trunk. An injection volume of 120 mL of a contrast agent with high iodine concentration (350 mg/mL) at a flow rate of 4 mL/sec is typically used. Images are acquired in the cranial to caudal direction with a slice thickness of 1.5 mm, slice interval of 1.5 mm, and 0.6 mm of collimation (Figs. 80-6 to 80-9).
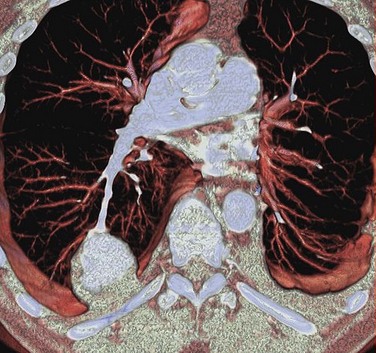
 FIGURE 80-6
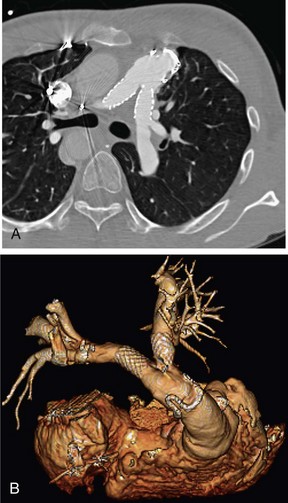
 FIGURE 80-7
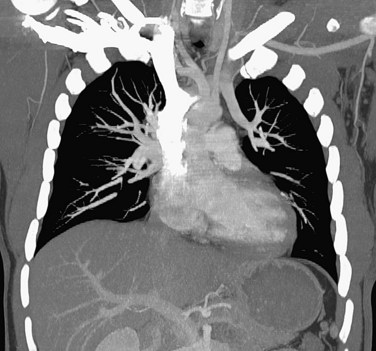
 FIGURE 80-8
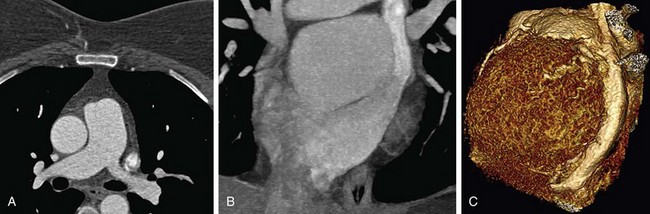
 FIGURE 80-9
Coronary CTA
Invasive coronary angiography remains the gold standard to determine the precise location and degree of stenosis because of its high spatial and temporal resolution (0.13 to 0.30 mm and 20 ms). It also allows therapeutic angioplasty and stenting at the time of the procedure. However, it is an expensive procedure with significant radiation exposure and carries a small risk of serious complications.60 Furthermore, only one third of these examinations are performed in conjunction with an interventional therapeutic procedure.61 Twenty percent of patients have normal or minimal coronary artery disease. Thus, a noninvasive assessment of coronary arteries is highly desirable for the diagnosis of coronary artery disease.
Patients who are not good candidates for CTA include those with unstable acute coronary syndrome who may need percutaneous coronary intervention, patients in atrial fibrillation, those with renal failure, and those with allergy to iodinated contrast material. Obesity limits the ability to obtain diagnostic examinations because of the increased soft tissue attenuation and image noise. With body mass indices above 30, it has been shown that the accuracy of the test falls below that for patients of normal weight.62 Coronary artery calcification also reduces the diagnostic accuracy of CTA.
To conduct a coronary CTA examination, intravenous access is obtained, ideally with an 18-gauge antecubital catheter in the right arm. Next, breath-holding is practiced with the patient, and the patient is instructed to avoid swallowing and movement for avoidance of step artifact in the resultant image. β Blockade is used to achieve slower heart rates, either intravenously or orally, depending on the clinical setting. A sample protocol includes intravenous injection of metoprolol (5 mg) repeated up to three times, depending on the heart rate. Alternatively, oral dosing can be administered the night before and the morning of the examination. Slowing of the heart rate is essential for image quality in 16- and 64-slice CT. A study of dual-source CT demonstrated slightly lower per-segment evaluability for high heart rates without β blockade but no decrease in diagnostic accuracy for the detection of coronary artery stenosis.63 Nitroglycerin (0.4 mg sublingually) is given to vasodilate the coronary arteries and to improve visualization.
The scanning volume starts at the aortic arch and extends caudally to the apex of the heart. Test bolus triggering can reliably obtain the optimal arterial phase by placing a region of interest on the ascending thoracic aorta. An injection volume of 100 mL of a contrast agent with high iodine concentration (350 mg/mL) at a flow rate of 5 mL/sec is typically used. Images are acquired in the cranial to caudal direction with a slice thickness of 0.75 mm, slice interval of 0.6 mm, and 0.6 mm of collimation (Fig. 80-10).
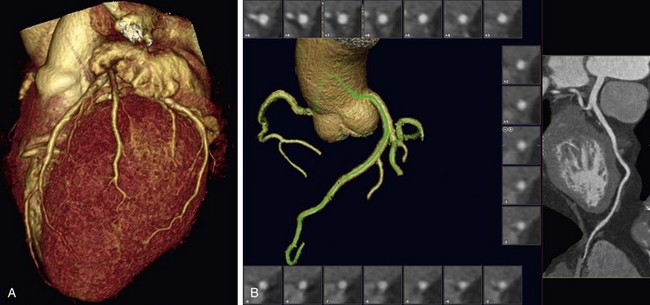
 FIGURE 80-10
A popular protocol for administration of contrast material uses a triphasic injection; the first phase is contrast material, the second phase is an admixture (70% saline/30% contrast material), and the third phase is a bolus chaser of saline alone. The advantage of this triphasic technique is that it will produce enough contrast in the right ventricle to allow visualization of the septum for left ventricular functional assessment. The rate of infusion of contrast material is a critical determinant of the quality of the image. A minimal flow rate of 5 mL/sec is optimal for the general population. For obese patients, higher rates should be attempted.64
Abdominal CTA
Abdominal Aorta
The scanning volume starts at the diaphragm and extends caudally to the symphysis pubis. Bolus tracking triggering can reliably obtain the optimal arterial phase by placing a region of interest on the aorta at the level of the celiac artery. An injection volume of 100 mL of a contrast agent with high iodine concentration (350 mg/mL) at a flow rate of 5 mL/sec is typically used. Images are acquired in the cranial to caudal direction with a slice thickness of 2.0 mm, slice interval of 2.0 mm, and 0.6 mm of collimation (Fig. 80-11).
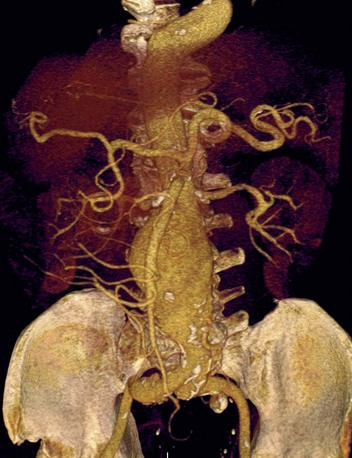
 FIGURE 80-11
Patients treated with endovascular aneurysm repair undergo frequent imaging by CTA to monitor for endoleak, stent migration, or fracture as well as stability of aneurysm size (Fig. 80-12).65 Increase in the diameter of an aneurysm is associated with endoleak. Evaluation of an endoleak requires unenhanced CT imaging as well as imaging during arterial and venous phases of contrast enhancement. Unenhanced images are used to detect artifact from calcification or embolization material that may mimic endoleak on the enhanced images. Venous phase images have been shown to enhance the detection rate of endoleaks.
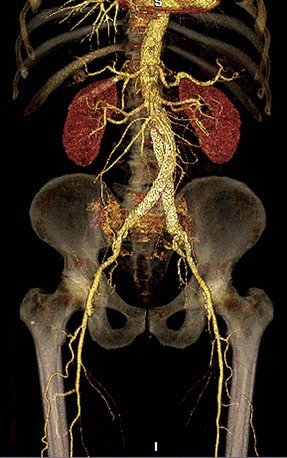
 FIGURE 80-12
Pancreas
Staging of pancreatic cancer with multiphasic CT is now the standard of care in many institutions.66 It requires arterial, parenchymal, and portal venous phase images to evaluate the solid organs and the mesentery.67–69 Addition of a non–contrast phase allows detection of parenchymal and vascular calcifications. Neutral oral contrast agents help distend the bowel and improve visualization of the bowel wall. Positive oral contrast agents (e.g., iodine-based agents) obscure vascular detail and should be avoided in all abdominal CTA.
Although curved multiplanar reformations of the pancreas improve visualization of the parenchyma and pancreatic duct, MIP and volume rendered images are needed for vascular analysis (Fig. 80-13).70,71 The newest generation of scanners allows rapid multiplanar and maximum intensity projections on the scanner, thus obviating the need for routine data transfer to an independent image processing workstation.
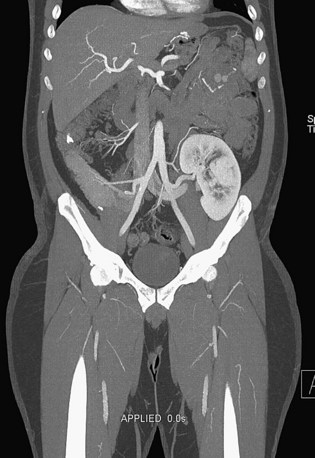
 FIGURE 80-13
Renal Imaging
A comprehensive examination includes non–contrast-enhanced images to evaluate for renal calculi and vascular calcification, arterial phase to detect vascular anatomic variants and anomalies, nephrographic phase to detect renal parenchymal abnormalities, and excretory phase to evaluate the collecting systems and ureters.72–75 Coronal thin-slab MIP images are useful for optimal visualization of the renal arteries (Fig. 80-14).76 However, because MIP images do not provide spatial depth, volume rendered images are also beneficial (Fig. 80-15). It is feasible to scan the renal vasculature with 50 mL of nonionic iodinated contrast material and saline chase using a dual injector on a 16- or 64-slice CT scanner with excellent results.14 However, to improve opacification of the ureters, saline bolus or diuretics may be beneficial.77
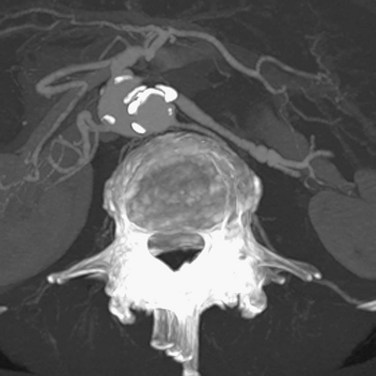
 FIGURE 80-14
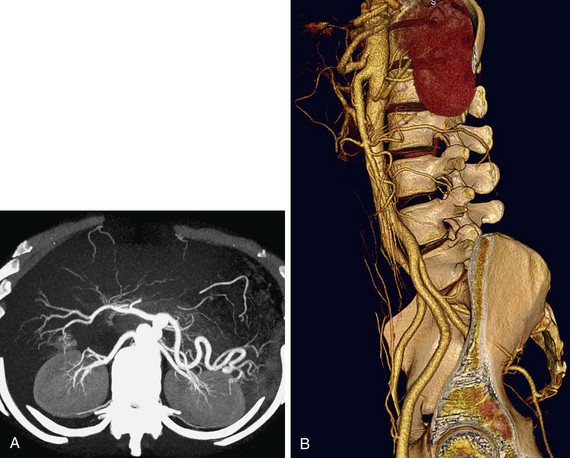
 FIGURE 80-15
Hepatic and Mesenteric Vasculature
CTA allows excellent visualization of the hepatic and mesenteric vasculature (Fig. 80-16). Because of high temporal resolution, it may be necessary to scan the region of interest twice; a “pure” arterial phase does not allow evaluation of the venous structures. This is necessary because incomplete enhancement of the mesenteric venous branches during late arterial phase may mimic thrombosis.
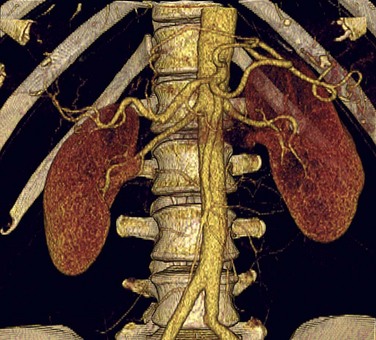
 FIGURE 80-16
Celiac and mesenteric stenoses are best visualized by sagittal thin-slab MIP or volume rendered images (Fig. 80-17). However, a thin-slab coronal MIP image also provides an excellent overview of the mesenteric vascular structures as well as the bowel loops (Fig. 80-18).78 The use of neutral oral contrast agents is important in evaluating the mesentery to improve visualization of the bowel mucosa.
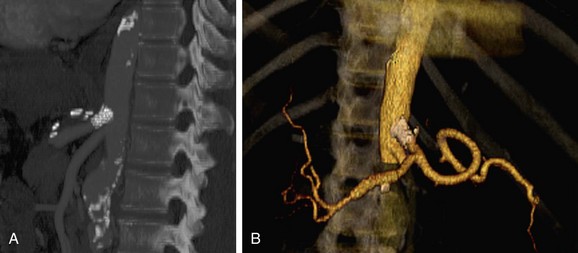
 FIGURE 80-17
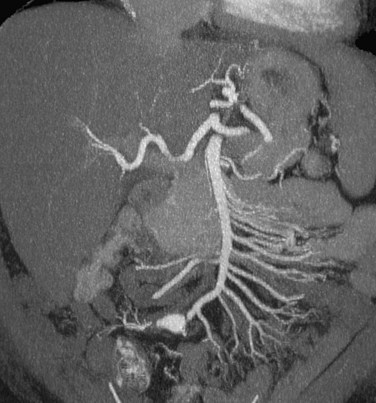
 FIGURE 80-18
Acute mesenteric ischemia is a life-threatening event that may be caused by a variety of factors. These include embolic phenomenon, severe hypoperfusion, thrombosis of stenotic vessels, dissection, hypercoagulable states, and vasculitis. Diagnosis of mesenteric venous thrombosis requires delayed images to avoid early-phase incomplete enhancement. Unenhanced images are also beneficial because they may show a hyperdense thrombus.7,79
Lower Extremity CTA
Bolus tracking triggering can reliably obtain the optimal arterial phase by placing a region of interest on the aorta at the level of the celiac artery. An injection volume of 150 mL of a contrast agent with high iodine concentration (350 mg/mL) at a flow rate of 5 mL/sec is typically used. Images are acquired in the cranial to caudal direction with a slice thickness of 1.0 mm, slice interval of 1.0 mm, and 0.6 mm of collimation (Figs. 80-19 to 80-24).
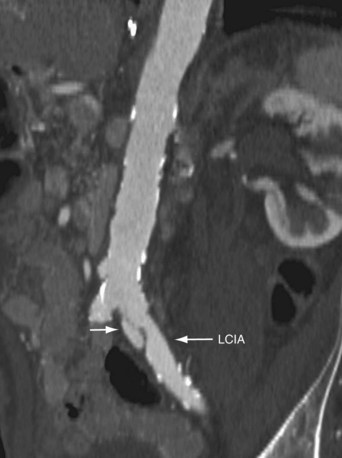
 FIGURE 80-19
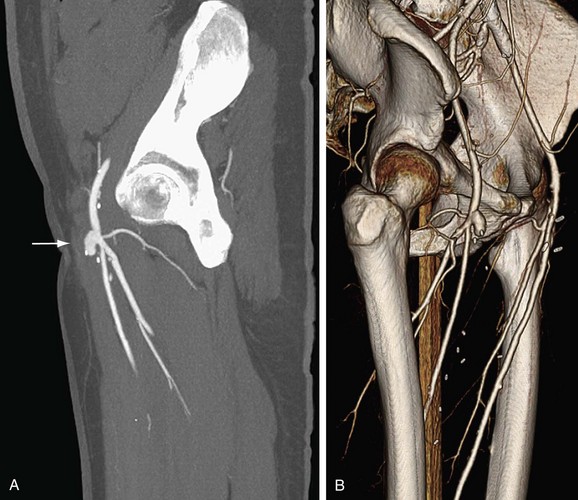
 FIGURE 80-20
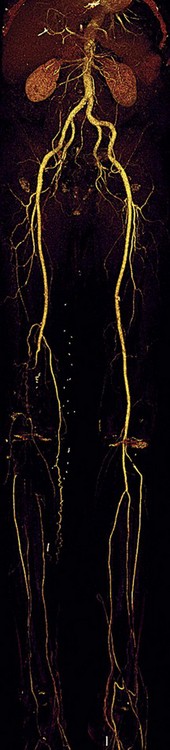
 FIGURE 80-21
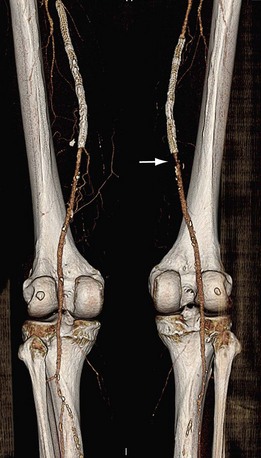
 FIGURE 80-22
 FIGURE 80-23
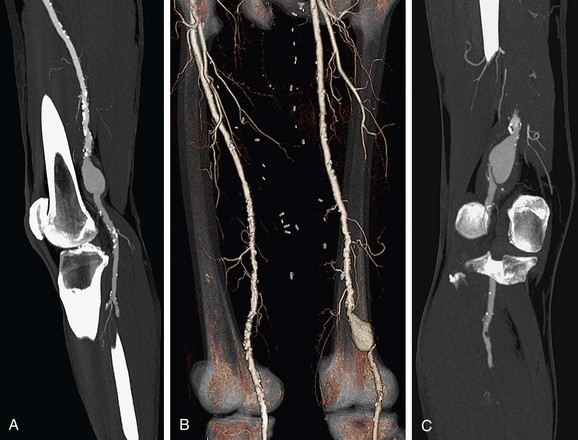
 FIGURE 80-24
Pitfalls and Solutions
Artifacts
Other types of artifacts commonly observed in the thorax are due to incomplete breath-holding, observed on sagittal or coronal views. These are seen as “stair-step” artifacts through the entire data set, including nonmoving structures, such as the bones. Adequate instruction to the patient before imaging is essential to avoid such artifacts.80
Many unique artifacts can result from imaging of the rapidly moving heart, the most common of which is the result of cardiac pulsation.19 This produces an image with horizontal slabs of the image in displaced alignment. The second type is banding artifacts, which result from an increased heart rate during the scan. These are similar in appearance to pulsation artifacts. These artifacts especially occur in patients with high heart rates, in patients with heart rate variability, and in the presence of irregular or ectopic heart beats (e.g., premature ventricular contractions and atrial fibrillation). These can be minimized by scanning with higher temporal resolution on the order of 50 ms or by multisecond reconstruction with MDCT. A β blocker should be used to reduce the heart rate to less than 65 beats/min.81 Recent data support high diagnostic accuracy for the detection of coronary artery stenosis with the use of dual-source CT without β blockade, attributed to the improved temporal resolution (75 to 83 ms) compared with single-source MDCT (166 ms).82 However, in clinical practice, the exact role of β blockade in dual-source imaging is yet to be determined, especially at high heart rates.
Radiation and Dose
CT contributes to 75% of the total collective dose from ionizing radiation to the public from medical imaging.17 With the increasing widespread use of CT and individual patients having multiple scans during their lifetime, low-dose techniques are increasingly desired. The goal is to keep doses “as low as reasonably achievable” (ALARA). This represents a practice mandate adhering to the principle of keeping radiation doses to patients and personnel as low as possible. Among the most widely known protocols, such as calcium scoring studies, the effective dose is relatively small, 1 to 3 mSv.83 The effective radiation dose with retrospectively gated coronary angiography by 64-slice MDCT is estimated to be approximately 11 to 22 mSv.80
Fraioli and colleagues84 performed peripheral CTA at 50 mAs, 100 mAs, and 130 mAs in three groups of patients with peripheral arterial disease and compared the findings with the gold standard, DSA.84 No difference in qualitative analysis of arterial segments was determined between the three CTA groups; similar sensitivity and specificity for diagnosis of peripheral arterial disease were achieved with CTA performed at 50 mAs, 100 mAs, and 300 mAs. Thus, optimal image quality with diagnostic accuracy for peripheral arterial disease was achieved with the low-dose technique, allowing a 74% reduction in effective dose to the patient.84 Similarly, for renal arterial CTA in potential living renal donors, 100 kVp achieved diagnostically acceptable CT images with a significant radiation dose reduction compared with CTA at 120 or 140 kVp.85 In our institution, Farrelly and colleagues have demonstrated a significant reduction in radiation dose by performing low peak tube voltage, prospectively ECG-gated CTA of thoracic aortas without loss of image quality. The mean radiation dose of the retrospectively gated–120 kVp was 26 mSv compared with 2.94 mSv for the prospectively gated–100 kVp studies. The latest coronary CTA protocols using prospective gating reduce the radiation doses to less than 3 mSv.24
Strategies for reduction of radiation dose in cardiac MDCT include the following86:
Image Interpretation
Postprocessing
Thinner slice acquisition with CTA has resulted in a significant increase in the number of images acquired. Hence, “data overload” has been a direct side effect of isotropic and near-isotropic scanning. CTA of the abdominal aorta and its branches on the newest scanners generates more than 1000 images.87 As the volume of data significantly increases, the processing power of many of the current image processing workstations is pushed to its limits. Because of the large volume of data obtained with CTA, accurate, time-efficient, and reproducible image postprocessing to enable disease interpretation is now a requirement.88–91 The axial image plane, formerly the plane with highest image quality in a single-detector CT scanner acquisition, is no longer the only plane available for image interpretation92; however, it remains mandatory to review these axial planes to ensure detection of extra-arterial disease.89 For the majority of patients with arterial disease, axial image viewing is time-consuming, inefficient, and often less accurate than viewing of reformatted images.93 With MDCTA acquisition, near-isotropic data sets can be obtained and thus manipulated in all imaging planes and projections without significant loss of image quality to enable eloquent display of the arterial anatomy and pathology.94 Therefore, a dedicated three-dimensional workstation to enable a real-time interactive approach to image manipulation and interpretation has now become a necessity. Many authors advocate the use of three-dimensional image display, both for diagnosis by the interpreting physician and for procedure planning by the interventionalist.91,95–97 Available image postprocessing techniques on the clinical three-dimensional workstations include multiplanar reconstruction (MPR), maximum intensity projection (MIP), volume rendering technique (VRT), and shaded surface display (SSD). Postprocessing of the source data not only improves visualization of the vascular structures and their relationship to the adjacent organs but also decreases the number of slices needed for the review of the data set.98,99 Images can be processed on the scanner or a freestanding image processing workstation. Thicker slices may be produced for review of the axial images on PACS.100 When the attenuation of vessels is usually more than or nearly 300 HU, the image quality of MPR, MIP, and VRT is usually satisfactory. Most institutions, including that of the authors, routinely use a combination of the MIP and volume rendered display of data for CTA because these two are complementary. Whereas volume rendering is useful for the display of soft tissues and three-dimensional relationships, MIP provides a more detailed view of the vessels within the slab of data and is less operator dependent.101
Multiplanar Reconstruction
The MPR algorithm enables a reordering of specific acquired image voxels along a predefined vascular centerline to provide a two-dimensional image of the vessel of interest (see Fig. 80-5A). As all arteries are curved at some point in their distribution, curved MPR (CMPR) is an extension of the MPR process that enables display of a curved plane prescribed along an individual vessel contour or centerline, thus displaying the entire vessel midline on a single two-dimensional image.94 CMPRs provide a comprehensive cross-sectional display of arterial luminal sizes over long segments and can be especially useful in review of large vascular territories, such as the peripheral arterial tree.102 CMPRs are the most equipped postprocessing method to reduce artifact from vessel calcification and arterial stents. However, CMPR is user dependent because it requires manual or semiautomated tracing of each vessel centerline.95 Also, it is imperative that at least two orthogonal planes for each arterial segment be created to ensure accurate quantification of eccentric atherosclerotic plaque.89 The orthogonal planes are, in fact, essential for determination of the true cross-sectional diameter of a vessel. Other limitations of CMPRs are that only one arterial segment can be displayed at a time and the limited spatial perception due to the absence of anatomic landmarks, such as vessel bifurcations.103 A new potential solution for these limitations has been described, that of multipath curved planar reformations (MPCPRs).104 This MPCPR method permits multiple longitudinal vessel cross sections to be displayed simultaneously and therefore allows branching patterns to be seen without obscuration of vessel wall calcifications and stents, and it enables restoration of spatial perception. Roos and colleagues105 think that MPCPR is currently the most comprehensive technique to visualize the peripheral arteries in patients with peripheral arterial disease; however, it cannot completely replace MIP and VRT.
Maximum Intensity Projection
The technique of MIP provides images that most closely resemble those obtained with conventional DSA and therefore are often desired by interventionalists to enable a quick overall review of the vasculature for anatomic and significant lesion determination before endovascular or surgical treatment. To obtain the MIP image, a specific algorithm is applied to the source data within the three-dimensional workstation. This algorithm involves applying a threshold attenuation value and selecting out the highest attenuation voxels along lines projected through the given volume data set.106 These selected high-attenuation voxels are then incorporated into a two-dimensional angiogram-like image, useful for demonstrating vessel opacification and residual vessel lumen (see Figs. 80-1A, 80-3B, 80-14, 80-15A, 80-18, and 80-20A). The limitations of MIP include vessel obscuration by other high-attenuation voxels, such as calcification, stents, or bone, and the inability to display three-dimensional relationships of vessels and adjacent anatomic structures.107 These limitations become a major problem with heavy arterial wall calcification or arterial stents because the vessel lumen can become obscured.38 Also, when vessel relationships need to be determined before surgical intervention, this two-dimensional MIP method is limited.108 However, MIP weaknesses can be reduced by editing adjacent high-density structures (bones, vessel wall calcification, and stents), using alternate planes of projection and setting variable attenuation threshold values.94
Volume Rendering Techniques
Again, dedicated computer software on the three-dimensional workstation allows a VRT algorithm to be applied to the source data. The principle of volume rendering involves taking the entire volume of source data, adding the contributions of each voxel along a line from the viewer’s eye through the data set, and displaying the resulting composite for each pixel of the display (see Figs. 80-1B, 80-2B, 80-4, 80-7B, 80-10A, 80-12, and 80-20B).107 VRT preserves three-dimensional anatomic relationships, unlike MIP; however, VRT, like MIP, still has limitations with vessel calcification and arterial stents. Therefore, this fundamental limitation precludes the exclusive use of volume rendering and MIP techniques in a large proportion (approximately 60%) of patients with peripheral arterial disease.109
Shaded Surface Display
SSD is a process in which apparent surfaces are determined within the volume of data and an image representing the derived surfaces is displayed.107 SSD provides an anatomic overview, but like MIP and volume rendering techniques, it has difficulty discriminating calcification, fails to display lumen detail, and can overestimate stenosis; therefore, SSD is generally not recommended for vessel caliber measurements.94
Combination of Methods
In clinical practice, combinations of the available three-dimensional reformatting methods are employed to accurately diagnose atherosclerosis (see Fig. 80-10B). Anatomic overview and quick significant disease localization can be achieved with the MIP or the VRT images. If arterial calcification or a stent obscures the arterial lumen, a combination of MPR and CMPR is used. In the event that complete evaluation of all arterial segments is hindered, review of the original axial source images can be performed.
Postprocessing Limitations
Technical limitations to postprocessing may exist, with the main ones being secondary to heavy arterial wall calcification or the presence of an arterial stent, as discussed before. Review of the axial source data can be a simple measure to overcome these problems. Postprocessing artifacts can also occur secondary to inadvertent vessel subtraction, particularly with MIP images, and production of pseudostenosis or occlusions in MPRs (especially curved MPRs) as a result of inaccurate centerline definition. Volume rendered images may not demonstrate aneurysmal dilation of a vessel because of partial luminal thrombosis. Again, the axial source data can act to solve these problems. To date, there are no fully automated algorithms to detect vessel centerlines, to segment out bony structures, or to detect or to subtract vessel wall calcification. However, with constant software updates, these tools are likely to become available in the near future.80 A new investigational tool is dual-energy CTA that allows automatic subtraction of bone and potentially calcified atherosclerotic plaque, based on differential attenuation of bone, calcium, and iodine on a dual-energy scan.


1 Rubin GD, Dake MD, Napel SA, et al. Three-dimensional spiral CT angiography of the abdomen: initial clinical experience. Radiology. 1993;186:147-152.
2 Adachi H, Ino T, Mizuhara A, et al. Assessment of aortic disease using three-dimensional CT angiography. J Card Surg. 1994;9:673-678.
3 Napel S, Marks MP, Rubin GD, et al. CT angiography with spiral CT and maximum intensity projection. Radiology. 1992;185:607-610.
4 Dillon EH, van Leeuwen MS, Fernandez MA, Mali WP. Spiral CT angiography. AJR Am J Roentgenol. 1993;160:1273-1278.
5 Galanski M, Prokop M, Chavan A, et al. Renal arterial stenoses: spiral CT angiography. Radiology. 1993;189:185-192.
6 Rydberg J, Buckwalter KA, Caldemeyer KS, et al. Multisection CT: Scanning techniques and clinical applications. Radiographics. 2000;20:1787-1806.
7 Fishman EK. From the RSNA Refresher Courses: CT Angiography: clinical applications in the abdomen. Radiographics. 2001;21:3S-S16.
8 Lawler LP, Fishman EK. Three-dimensional CT angiography with multidetector CT data: study optimization, protocol design, and clinical applications in the abdomen. Crit Rev Comput Tomogr. 2002;43:77-141.
9 Rubin GD. MDCT imaging of the aorta and peripheral vessels. Eur J Radiol. 2003;45:S42-S49.
10 Rubin GD, Shiau MC, Leung AN, et al. Aorta and iliac arteries: single versus multiple detector-row helical CT angiography. Radiology. 2000;215:670-676.
11 Vrtiska TJ, Fletcher JG, McCollough CH. State-of-the-art imaging with 64-channel multidetector CT angiography. Perspect Vasc Surg Endovasc Ther. 2005;17:3-8.
12 Saini S. Multi-detector row CT: principles and practice for abdominal applications. Radiology. 2004;233:323-327.
13 Schoellnast H, Tillich M, Deutschmann MJ, et al. Aortoiliac enhancement during computed tomography angiography with reduced contrast material dose and saline solution flush: influence on magnitude and uniformity of the contrast column. Invest Radiol. 2004;39:20-26.
14 Utsunomiya D, Awai K, Tamura Y, et al. 16-MDCT aortography with a low-dose contrast material protocol. AJR Am J Roentgenol. 2006;186:374-378.
15 Anderson SW, Lucey BC, Varghese JC, Soto JA. Sixty-four multi-detector row computed tomography in multitrauma patient imaging: early experience. Curr Probl Diagn Radiol. 2006;35:188-198.
16 Kalra MK, Maher MM, Toth TL, et al. Strategies for CT radiation dose optimization. Radiology. 2004;230:619-628.
17 Mettler FA, Wiest PW, Locken JA, Kelsey CA. CT scanning: patterns of use and dose. J Radiol Prot. 2000;20:353-359.
18 Wintersperger B, Jakobs T, Herzog P, et al. Aorto-iliac multidetector-row CT angiography with low kV settings: improved vessel enhancement and simultaneous reduction of radiation dose. Eur Radiol. 2005;15:334-341.
19 Mahesh M, Cody DD. Physics of cardiac imaging with multiple-row detector CT. Radiographics. 2007;27:1495-1509.
20 Lell MM, Anders K, Uder M, et al. New techniques in CT angiography. Radiographics. 2006;26(Suppl 1):S45-S62.
21 Flohr TG, Stierstorfer K, Ulzheimer S, et al. Image reconstruction and image quality evaluation for a 64-slice CT scanner with z-flying focal spot. Med Phys. 2005;32:2536-2547.
22 Jahnke C, Paetsch I, Achenbach S, et al. Coronary MR imaging: breath-hold capability and patterns, coronary artery rest periods, and beta-blocker use. Radiology. 2006;239:71-78.
23 Hsieh J, Londt J, Vass M, et al. Step-and-shoot data acquisition and reconstruction for cardiac x-ray computed tomography. Med Phys. 2006;33:4236-4248.
24 Earls JP, Berman EL, Urban BA, et al. Prospectively gated transverse coronary CT angiography versus retrospectively gated helical technique: improved image quality and reduced radiation dose. Radiology. 2008;246:742-753.
25 Bae KT. Peak contrast enhancement in CT and MR angiography: when does it occur and why? Pharmacokinetic study in a porcine model. Radiology. 2003;227:809-816.
26 Bae KT, Tran HQ, Heiken JP. Uniform vascular contrast enhancement and reduced contrast medium volume achieved by using exponentially decelerated contrast material injection method. Radiology. 2004;231:732-736.
27 Macari M, Israel GM, Berman P, et al. Infrarenal abdominal aortic aneurysms at multi-detector row CT angiography: intravascular enhancement without a timing acquisition. Radiology. 2001;220:519-523.
28 Johnson PT, Fishman EK. IV contrast selection for MDCT: current thoughts and practice. AJR Am J Roentgenol. 2006;186:406-415.
29 Kim M-J, Chung YE, Kim KW, et al. Variation of the time to aortic enhancement of fixed-duration versus fixed-rate injection protocols. AJR Am J Roentgenol. 2006;186:185-192.
30 Fleischmann D. Use of high concentration contrast media: principles and rationale—vascular district. Eur J Radiol. 2003;45(Suppl 1):S88-S93.
31 Fleischmann D, Rubin GD, Bankier AA, Hittmair K. Improved uniformity of aortic enhancement with customized contrast medium injection protocols at CT angiography. Radiology. 2000;214:363-371.
32 Furuta A, Ito K, Fujita T, et al. Hepatic enhancement in multiphasic contrast-enhanced MDCT: comparison of high- and low-iodine-concentration contrast medium in same patients with chronic liver disease. AJR Am J Roentgenol. 2004;183:157-162.
33 Fleischmann D, Hallett RL, Rubin GD. CT angiography of peripheral arterial disease. J Vasc Interv Radiol. 2006;17:3-26.
34 Fleischmann D, Rubin GD. Quantification of intravenously administered contrast medium transit through the peripheral arteries: implications for CT angiography. Radiology. 2005;236:1076-1082.
35 Adriaensen ME, Kock MC, Stijnen T, et al. Peripheral arterial disease: therapeutic confidence of CT versus digital subtraction angiography and effects on additional imaging recommendations. Radiology. 2004;233:385-391.
36 Catalano C, Fraioli F, Laghi A, et al. Infrarenal aortic and lower-extremity arterial disease: diagnostic performance of multi-detector row CT angiography. Radiology. 2004;231:555-563.
37 Martin ML, Tay KH, Flak B, et al. Multidetector CT angiography of the aortoiliac system and lower extremities: a prospective comparison with digital subtraction angiography. AJR Am J Roentgenol. 2003;180:1085-1091.
38 Ofer A, Nitecki SS, Linn S, et al. Multidetector CT angiography of peripheral vascular disease: a prospective comparison with intraarterial digital subtraction angiography. AJR Am J Roentgenol. 2003;180:719-724.
39 Willmann JK, Mayer D, Banyai M, et al. Evaluation of peripheral arterial bypass grafts with multi-detector row CT angiography: comparison with duplex US and digital subtraction angiography. Radiology. 2003;229:465-474.
40 Rubin GD, Schmidt AJ, Logan LJ, Sofilos MC. Multi-detector row CT angiography of lower extremity arterial inflow and runoff: initial experience. Radiology. 2001;221:146-158.
41 Qanadli SD, Chiappori V, Kelekis A. Multislice computed tomography of peripheral arterial disease: new approach to optimize vascular opacification with 16-row platform. Eur Radiol. 2004;14(Suppl 2):806.
42 Laswed T, Rizzo E, Guntern D, et al. Assessment of occlusive arterial disease of abdominal aorta and lower extremities arteries: value of multidetector CT angiography using an adaptive acquisition method. Eur Radiol. 2008;18:263-272.
43 Johnson PT, Fishman EK. IV contrast selection for MDCT: current thoughts and practice. AJR Am J Roentgenol. 2006;186:406-415.
44 Iezzi R, Cotroneo AR, Filippone A, et al. Four-detector row computed tomographic angiography in the evaluation of infrarenal aorta and peripheral arterial occlusive disease: influence of contrast medium concentration. J Comput Assist Tomogr. 2008;32:690-696.
45 Becker CR, Hong C, Knez A, et al. Optimal contrast application for cardiac 4-detector-row computed tomography. Invest Radiol. 2003;38:690-694.
46 Hittmair K, Fleischmann D. Accuracy of predicting and controlling time-dependent aortic enhancement from a test bolus injection. J Comput Assist Tomogr. 2001;25:287-294.
47 Karcaaltincaba M, Foley WD. Gadolinium-enhanced multidetector CT angiography of the thoracoabdominal aorta. J Comput Assist Tomogr. 2002;26:875-878.
48 Pena CS, Kaufman JA, Geller SC, Waltman AC. Gadopentetate dimeglumine: a possible alternative contrast agent for CT angiography of the aorta. J Comput Assist Tomogr. 1999;23:23-24.
49 Chicoskie C, Tello R. Gadolinium-enhanced MDCT angiography of the abdomen: feasibility and limitations. AJR Am J Roentgenol. 2005;184:1821-1828.
50 Wicky S, Greenfield A, Fan C-M, et al. Aortoiliac gadolinium-enhanced CT angiography: improved results with a 16-detector row scanner compared with a four-detector row scanner. J Vasc Interv Radiol. 2004;15:947-954.
51 Grobner T. Gadolinium—a specific trigger for the development of nephrogenic fibrosing dermopathy and nephrogenic systemic fibrosis? Nephrol Dial Transplant. 2006;21:1104-1108.
52 Thomsen HS. Nephrogenic systemic fibrosis: a serious late adverse reaction to gadodiamide. Eur Radiol. 2006;16:2619-2621.
53 Estol C, Claasen D, Hirsch W, et al. Correlative angiographic and pathologic findings in the diagnosis of ulcerated plaques in the carotid artery. Arch Neurol. 1991;48:692-694.
54 Ricotta JJ, Schenk EA, Ekholm SE, DeWeese JA. Angiographic and pathologic correlates in carotid artery disease. Surgery. 1986;99:284-292.
55 Davies KN, Humphrey PR. Complications of cerebral angiography in patients with symptomatic carotid territory ischaemia screened by carotid ultrasound. J Neurol Neurosurg Psychiatry. 1993;56:967-972.
56 Chiles C, Carr JJ. Vascular diseases of the thorax: evaluation with multidetector CT. Radiol Clin North Am. 2005;43:543-569. viii
57 Ghaye B, Szapiro D, Mastora I, et al. Peripheral pulmonary arteries: how far in the lung does multi-detector row spiral CT allow analysis? Radiology. 2001;219:629-636.
58 Crawford T, Yoon C, Wolfson K, et al. The effect of imaging modality on patient management in the evaluation of pulmonary thromboembolism. J Thorac Imaging. 2001;16:163-169.
59 Prologo JD, Glauser J. Variable diagnostic approach to suspected pulmonary embolism in the ED of a major academic tertiary care center. Am J Emerg Med. 2002;20:5-9.
60 Scanlon PJ, Faxon DP, Audet AM, et al. ACC/AHA guidelines for coronary angiography. A report of the American College of Cardiology/American Heart Association Task Force on practice guidelines (Committee on Coronary Angiography). Developed in collaboration with the Society for Cardiac Angiography and Interventions. J Am Coll Cardiol. 1999;33:1756-1824.
61 American Heart Association. 2002 Heart and Stroke Statistical Update. Dallas, TX: American Heart Association; 2002.
62 Raff GL, Gallagher MJ, O’Neill WW, Goldstein JA. Diagnostic accuracy of noninvasive coronary angiography using 64-slice spiral computed tomography. J Am Coll Cardiol. 2005;46:552-557.
63 Johnson TR, Nikolaou K, Wintersperger BJ, et al. Dual-source CT cardiac imaging: initial experience. Eur Radiol. 2006;16:1409-1415.
64 Rodriguez-Granillo GA, Rosales MA, Degrossi E, et al. Modified scan protocol using multislice CT coronary angiography allows high quality acquisitions in obese patients: a case report. Int J Cardiovasc Imaging. 2007;23:265-267.
65 Golzarian J, Valenti D. Endoleakage after endovascular treatment of abdominal aortic aneurysms: diagnosis, significance and treatment. Eur Radiol. 2006;16:2849-2857.
66 Brugel M, Link TM, Rummeny EJ, et al. Assessment of vascular invasion in pancreatic head cancer with multislice spiral CT: value of multiplanar reconstructions. Eur Radiol. 2004;14:1188-1195.
67 Foley WD, Mallisee TA, Hohenwalter MD, et al. Multiphase hepatic CT with a multirow detector CT scanner. AJR Am J Roentgenol. 2000;175:679-685.
68 Foley WD. Special focus session: multidetector CT: abdominal visceral imaging. Radiographics. 2002;22:701-719.
69 Fletcher JG, Wiersema MJ, Farrell MA, et al. Pancreatic malignancy: value of arterial, pancreatic, and hepatic phase imaging with multi-detector row CT. Radiology. 2003;229:81-90.
70 Nino-Murcia M, Jeffrey RBJr, Beaulieu CF, et al. Multidetector CT of the pancreas and bile duct system: value of curved planar reformations. AJR Am J Roentgenol. 2001;176:689-693.
71 Vargas R, Nino-Murcia M, Trueblood W, Jeffrey RBJr. MDCT in pancreatic adenocarcinoma: prediction of vascular invasion and resectability using a multiphasic technique with curved planar reformations. AJR Am J Roentgenol. 2004;182:419-425.
72 Urban BA, Ratner LE, Fishman EK. Three-dimensional volume-rendered CT angiography of the renal arteries and veins: normal anatomy, variants, and clinical applications. Radiographics. 2001;21:373-386.
73 Raman SS, Pojchamarnwiputh S, Muangsomboon K, et al. Utility of 16-MDCT angiography for comprehensive preoperative vascular evaluation of laparoscopic renal donors. AJR Am J Roentgenol. 2006;186:1630-1638.
74 Patil UD, Ragavan A, Nadaraj, et al. Helical CT angiography in evaluation of live kidney donors. Nephrol Dial Transplant. 2001;16:1900-1904.
75 Kim J-K, Park S-Y, Kim H-J, et al. Living donor kidneys: usefulness of multi-detector row CT for comprehensive evaluation. Radiology. 2003;229:869-876.
76 Kim JK, Kim JH, Bae S-J, Cho K-S. CT angiography for evaluation of living renal donors: comparison of four reconstruction methods. AJR Am J Roentgenol. 2004;183:471-477.
77 Noroozian M, Cohan RH, Caoili EM, et al. Multislice CT urography: state of the art. Br J Radiol. 2004;77:S74-S86.
78 Kirkpatrick IDC, Kroeker MA, Greenberg HM. Biphasic CT with mesenteric CT angiography in the evaluation of acute mesenteric ischemia: initial experience. Radiology. 2003;229:91-98.
79 Bradbury MS, Kavanagh PV, Bechtold RE, et al. Mesenteric venous thrombosis: diagnosis and noninvasive imaging. Radiographics. 2002;22:527-541.
80 Hoffmann U, Ferencik M, Cury RC, Pena AJ. Coronary CT angiography. J Nucl Med. 2006;47:797-806.
81 Leschka S, Wildermuth S, Boehm T, et al. Noninvasive coronary angiography with 64-section CT: effect of average heart rate and heart rate variability on image quality. Radiology. 2006;241:378-385.
82 Achenbach S, Ropers D, Kuettner A, et al. Contrast-enhanced coronary artery visualization by dual-source computed tomography—initial experience. Eur J Radiol. 2006;57:331-335.
83 Hunold P, Vogt FM, Schmermund A, et al. Radiation exposure during cardiac CT: effective doses at multi-detector row CT and electron-beam CT. Radiology. 2003;226:145-152.
84 Fraioli F, Catalano C, Napoli A, et al. Low-dose multidetector-row CT angiography of the infra-renal aorta and lower extremity vessels: image quality and diagnostic accuracy in comparison with standard DSA. Eur Radiol. 2006;16:137-146.
85 Sahani DV, Kalva SP, Hahn PF, Saini S. 16-MDCT angiography in living kidney donors at various tube potentials: impact on image quality and radiation dose. AJR Am J Roentgenol. 2007;188:115-120.
86 Paul JF, Abada HT. Strategies for reduction of radiation dose in cardiac multislice CT. Eur Radiol. 2007;17:2028-2037.
87 Rubin GD. Data explosion: the challenge of multidetector-row CT. Eur J Radiol. 2000;36:74-80.
88 Fishman EK. High-resolution three-dimensional imaging from subsecond helical CT data sets: applications in vascular imaging. AJR Am J Roentgenol. 1997;169:441-443.
89 Fleischmann D, Hallett RL, Rubin GD. CT angiography of peripheral arterial disease. J Vasc Interv Radiol. 2006;17:3-26.
90 Kirchgeorg MA, Prokop M. Increasing spiral CT benefits with postprocessing applications. Eur J Radiol. 1998;28:39-54.
91 Lawler LP, Fishman EK. Multi-detector row CT of thoracic disease with emphasis on 3D volume rendering and CT angiography. Radiographics. 2001;21:1257-1273.
92 Fleischmann D, Rubin GD, Paik DS, et al. Stair-step artifacts with single versus multiple detector-row helical CT. Radiology. 2000;216:185-196.
93 Ota H, Takase K, Igarashi K, et al. MDCT compared with digital subtraction angiography for assessment of lower extremity arterial occlusive disease: importance of reviewing cross-sectional images. AJR Am J Roentgenol. 2004;182:201-209.
94 Lawler LP, Fishman EK. Multidetector row computed tomography of the aorta and peripheral arteries. Cardiol Clin. 2003;21:607-629.
95 Prokesch RW, Coulam CH, Chow LC, et al. CT angiography of the subclavian artery: utility of curved planar reformations. J Comput Assist Tomogr. 2002;26:199-201.
96 Raman R, Napel S, Rubin GD. Curved-slab maximum intensity projection: method and evaluation. Radiology. 2003;229:255-260.
97 Rankin SC. CT angiography. Eur Radiol. 1999;9:297-310.
98 Yaghmai V, Nikolaidis P, Hammond NA, et al. Multidetector-row computed tomography diagnosis of small bowel obstruction: can coronal reformations replace axial images? Emerg Radiol. 2006;13:69-72.
99 Cody DD. AAPM/RSNA Physics Tutorial for Residents: Topics in CT: image processing in CT. Radiographics. 2002;22:1255-1268.
100 Prokop M. General principles of MDCT. Eur J Radiol. 2003;45:S4-S10.
101 Fishman EK, Ney DR, Heath DG, et al. Volume rendering versus maximum intensity projection in CT angiography: what works best, when, and why. Radiographics. 2006;26:905-922.
102 Napoli A, Fleischmann D, Chan FP, et al. Computed tomography angiography: state-of-the-art imaging using multidetector-row technology. J Comput Assist Tomogr. 2004;28(Suppl 1):S32-S45.
103 Raman R, Napel S, Beaulieu CF, et al. Automated generation of curved planar reformations from volume data: method and evaluation. Radiology. 2002;223:275-280.
104 Kanitsar A, Fleischmann D, Wegenkittl R, et al. CPR: curved planar reformation. IEEE Computer Society. 2002:37-44.
105 Roos JE, Fleischmann D, Koechl A, et al. Multipath curved planar reformation of the peripheral arterial tree in CT angiography. Radiology. 2007;244:281-290.
106 van Ooijen PM, Ho KY, Dorgelo J, Oudkerk M. Coronary artery imaging with multidetector CT: visualization issues. Radiographics. 2003;23:e16.
107 Calhoun PS, Kuszyk BS, Heath DG, et al. Three-dimensional volume rendering of spiral CT data: theory and method. Radiographics. 1999;19:745-764.
108 Kim JK, Kim JH, Bae SJ, Cho KS. CT angiography for evaluation of living renal donors: comparison of four reconstruction methods. AJR Am J Roentgenol. 2004;183:471-477.
109 Koechl A, Kanitsar A, Lomoschitz E. Comprehensive assessment of peripheral arteries using multi-path curved planar reformation of CTA datasets. Eur Radiol. 2003;13:268-269.
[/level-membership-for-cardiovascular-category][not-level-membership-for-cardiovascular-category]
CHAPTER 80 Computed Tomographic Angiography
Clinical Techniques
DSA remains the gold standard method for evaluation of atherosclerosis within the vasculature; however, this is a minimally invasive technique with the potential for iatrogenic complications. Therefore, noninvasive imaging methods are desirable among patients and physicians alike. With the advent of MDCT, noninvasive angiography has become a viable option as a result of increased speed, spatial resolution, and volume coverage. CTA revolutionized vascular imaging when vessels smaller than 1 mm in diameter were imaged with single-slice spiral CT.1–5 However, because of the small volume of coverage and limitations in the speed of image processing, CTA did not become widely used until the introduction of MDCT in 1998.6–8 With the advent of MDCT, temporal and spatial resolution of the scanners significantly improved.9,10 Gantry rotation times of 0.28 to 0.5 second with slice thickness of 0.33 to 0.75 mm are now available on most MDCT scanners.
With MDCT, there are several parallel detectors along the z-axis, and multiple channels of data (currently up to 320) significantly improve z-axis resolution. This allows isotropic resolution for most vascular applications with images obtained during a single short breath-hold. The result has been elimination of the tradeoff between spatial resolution (z-axis) and scanning range, an important limitation of single-detector spiral CT.11,12 Hence, a significant benefit has been a paradigm shift from single-slice to volumetric data acquisition. This, in turn, has made imaging of different vascular phases with a single bolus of contrast material a reality.7 Isotropic data sets allow three-dimensional reconstruction and a variety of postprocessing methods to enable both diagnostic interpretation and eloquent anatomic and pathologic arterial display.
The advantages of CTA include lower cost and the ability to potentially reduce the total volume of contrast material administered. With the fastest scanners currently available, abdominal CTA can be performed with as little as 50 mL of contrast material with the use of saline flush.13,14 This requires meticulous attention to the timing of bolus administration of the contrast material, which is discussed later in this chapter. In evaluation of life-threatening vascular disease, such as traumatic aortic injury or pulmonary embolus, CTA has a clear advantage because of short acquisition times.15
Increased utility of CT has led to significant increase in radiation exposure and concerns about its effect.16 CT currently accounts for approximately 75% of the total radiation dose delivered by medical imaging.17 Development of automatic tube current modulation software that is now available on all advanced MDCT systems has been a positive side effect of this awareness. Tube current modulation automatically adjusts the current during scanning to decrease the amount of radiation in anatomic regions that do not require higher current (e.g., lung bases or above the iliac crest) while maintaining image quality.16 In the appropriate setting, CTA may be performed with a reduced kilovoltage setting to decrease radiation to the patient and to improve signal-to-noise ratio.18
TECHNICAL REQUIREMENTS
Technical Components and Design
Image Quality
Factors affecting image quality and characteristics of CTA images include temporal and spatial resolution. Spatial resolution refers to the degree of blurring in the image and the ability to discriminate objects and structures of small size. Axial resolution within the scan plane can be improved by using a small field of view, larger matrix size, smaller focal spot, and smaller detectors. The demand for high spatial resolution to visualize the various coronary segments that course with decreasing diameter to the apex is high. One of the major goals of MDCT technology development has been to obtain similar spatial resolution in all directions, also expressed as isotropic spatial resolution.19 CTA requires high spatial resolution to enable accurate detection and interrogation of small arterial branch vessels. Both in-plane and through-plane spatial resolutions are important indices that require optimization to provide isotropic source data. Isotropic means that the spatial resolution is approximately equal in all planes, which is necessary to enable multiplanar image reconstruction after acquisition. Isotropic data avoid loss of spatial resolution in one plane and reduce partial volume effects after source data reconstruction.20 The increased scanner detector numbers has allowed increased through-plane spatial resolution as the detector width is reduced with increased numbers (1 to 1.25 mm with 4-detector row CT, 0.5 to 0.625 mm with 64-detector row CT).21 The new MDCT scanners have not improved in-plane spatial resolution; this is determined by detector geometry and the convolution kernel (reconstruction algorithm).20 Temporal resolution is defined as the required time for data acquisition per slice. It represents the length of the reconstruction window during each heart cycle, which is determined by the gantry speed.
Detectors
Diagnostic performance in coronary CTA is primarily determined by temporal resolution, which is the required time for data acquisition per slice. The determinant of this is the gantry rotational speed. For the typical setup of a single tube and detector, half a gantry rotation is necessary to acquire the data for volume reconstruction, that is, temporal resolution is equal to half gantry rotation. The temporal resolution of a 64-slice CT scanner with a gantry rotation of 330 ms is 166 ms. For motion-free images to be obtained at any phase in the cardiac cycle, a temporal resolution of 10 ms is required. Achievement of such high temporal resolution is impossible with CT. As a result, cardiac CT phase reconstruction is centered on the quiescent or low-motion window in end-diastole. The postulated required temporal resolution for reliable cardiac imaging is in the range of 65 ms.22 One manufacturer has developed a 256-slice CT scanner (128 × 0.625) with a rotation time of 270 ms and temporal resolution of 135 ms. However, with automatic multisegmental reconstructions with voxel-based optimization, temporal resolutions up to 68 ms are achieved.
Image Acquisition and Reconstruction
Prospective Gating
Hsieh and coworkers23 have developed a new approach for CTA referred to as prospectively gated axial. This technique uses a combined step-and-shoot axial data acquisition and an incrementally moving table with prospective adaptive ECG triggering. This method takes advantage of the large-volume coverage available with the 64-slice MDCT scanner that enables complete coverage of the heart in two or three steps. With this technique, the table is stationary during the image acquisition. It then moves to the next position for another scan initiated by the subsequent cardiac cycle. The result is very little overlap between the scans, significant (50% to 80%) reduction in radiation dose, and more robust and adaptive ECG gating. Earls and associates24 reported an effective dose for the prospectively gated axial group (mean, 2.8 mSv) that was significantly lower than that for the retrospectively gated helical group (mean, 18.4 mSv). This represents a reduction in mean effective dose to the patient by up to 80% from the retrospectively gated helical to the prospectively gated axial approach.
Contrast Detection and Administration
With shortened acquisition times of MDCT, optimization and maximization of vascular enhancement have become more challenging.25,26 CTA requires excellent contrast enhancement of the targeted vessels. A good-quality CT angiogram requires an arterial density value of greater than 200 HU.27,28 This should be achieved rapidly, and the peak should coincide with the acquisition interval. It is therefore crucial to time the contrast bolus correctly. However, rapid administration of contrast material shortens the plateau phase of contrast enhancement, thus creating further challenge for correct timing of the study.25,26,29 For most CTA applications, an injection rate of 4 to 5 mL/sec yields optimal vascular enhancement.
Several factors affect time to peak from the start of contrast bolus administration. These include the iodine content of the contrast material, the injection rate, and the patient’s cardiac status.25,26,30,31 A faster injection rate, for example, can achieve a higher density in the targeted vessel and results in a higher quality CT angiogram. It also separates the arterial from the portal venous phase and hence results in excellent image quality without cross-contamination by different phases.25 Contrast material with higher iodine concentration improves vascular enhancement if all other parameters are held constant.25,32 An important consideration with the 16- and 64-slice scanners is the possibility of “outrunning” the contrast bolus in patients with low cardiac output or in cases that require long z-axis coverage (e.g., combination of extremity and abdominal CTA); to overcome this issue, one can slow down the scanner by increasing the gantry rotation time and slowing the table speed.33,34
Fixed Scan Delay
Few authors currently use the method of setting a standard timed scan delay after the intravenous administration of contrast material to acquire images in the arterial phase.35,36 By setting the same scan delay for every patient, one is assuming that exactly the same hemodynamic conditions exist in all patients. This method does not accommodate patients with any variation from the normal (i.e., low blood pressure, low cardiac outputs, hypovolemia, high outputs). We would not agree with employing this method of a fixed scan delay time.
Bolus Tracking
To more accurately determine the optimal scan delay after intravenous administration of contrast material in patients with variable hemodynamics, the technique of contrast bolus tracking can be employed. Used by many authors,37,39 this is an efficient way to optimize arterial opacification. Initially, a single low-dose CT image is obtained, without administration of contrast material, at the level of the common carotid for the carotids, the ascending aorta for the coronary and thoracic aorta, and the celiac axis for the abdominal aorta and runoffs. A 10- to 15-mm2 circular region of interest is placed inside the middle of the aortic lumen, and this will subsequently measure the Hounsfield units of the aortic lumen on subsequent scanning. At 8 to 10 seconds after intravenous administration of contrast material, serial low-dose monitoring CT scans are obtained at the same table position at 1-second intervals. When the region of interest detects a preset contrast enhancement level (usually 100 to 150 HU value), there is automatic triggering of the scanner to acquire images in the desired scan range. This time-efficient method ensures optimal arterial enhancement within the region of interest, which can be moved to a different arterial location if desired. It enables lower contrast use and reduces scan-to-scan and patient-to-patient variability in arterial opacification.
Test Bolus
Another method to optimize arterial contrast opacification is that of a test bolus or timing bolus acquisition. Described by a number of authors,38,40 this technique involves intravenous administration of a small bolus (20 to 30 mL) of contrast material followed by serial CT data acquisitions at one table position, usually at the levels described for bolus tracking. Images are acquired, after a scan delay of 8 to 10 seconds, every 1 to 2 seconds for a predetermined number of images (20 to 40) or until the CT technologist chooses to manually stop the acquisition after the contrast peak within the aorta. A time versus Hounsfield unit (attenuation) curve is then generated by placing a region of interest over the contrast-opacified aorta. The time taken to reach peak opacification is then used as the scan delay for the actual CTA and thus corresponds to the time taken for the contrast material to pass from the intravenous injection site of interest. This method is useful as it detects variable transit times between patients with different hemodynamic states and allows individualization of scan delays.
Adaptive Method
The runoff vessels in the symptomatic limb can be problematic with CTA as a result of proximal/in-flow stenosis or, alternatively, distal hyperemia at the site of arterial ulceration; these can cause arterial flow discrepancy between the two lower limbs. Thus, one limb will have a faster flow rate than the other, resulting in good contrast opacification of the arteries ipsilaterally but failed opacification contralaterally. CT fails at eliciting dynamic information. This problem may be somewhat reduced by use of an adaptive method of contrast detection that was described by Qanadli and associates.41 This method is similar to that of a test bolus technique in that a small 30-mL contrast bolus is administered intravenously, followed by two low-dose (20 mA, 120 kV) CT acquisitions. The first is at the level of the descending thoracic aorta (at vertebra level T12) acquired 20 seconds after the start of intravenous administration of the contrast material for 10 seconds; the second level is the popliteal arteries below the knee acquired 30 seconds after the start of the intravenous bolus (i.e., after the aortic level is finished). Three time-density curves are created, one from the aortic level and one from each of the popliteal artery levels. The time to peak contrast enhancement is then determined for each level (aortic time = T1; popliteal time = T2). If the right and left popliteal times are different, the symptomatic leg or the longer time is taken to be T2. The aortopopliteal transit time (Tt) is determined from T2 − T1. The CT gantry rotation time and table speed are then set to match Tt in order that the popliteal artery will be imaged at peak enhancement. T1 is the delay time between commencement of the usual intravenous contrast bolus and commencement of data acquisition.41 Laswed and colleagues42 applied this adaptive method clinically in patients with peripheral arterial disease, with DSA correlation, and determined that MDCTA has a sensitivity and specificity of 100% for arterial lesion detection on a per-patient basis. Analyzed on a per-segment basis, MDCTA had a sensitivity and specificity for lesion detection of 91% and 96%, respectively, in the below-knee arteries and 100% and 90%, respectively, in the distal pedal arteries. This method was found to be reproducible, had high image quality, avoided the problem of venous overlay, and resolved the issue of differential peripheral arterial opacification.42
Contrast Media Concentration
A recent review attempted to determine the difference that contrast media iodine concentration makes to image quality of MDCTA in the peripheral vasculature.43 All of the studies reviewed used iodine concentrations of 300 mg/mL and higher; whereas improved arterial enhancement and visualization were demonstrated with higher iodine concentrations, there was no clear evidence of a significant difference in diagnostic efficacy for the different iodine concentrations.43 Iezzi and coworkers,44 comparing iodine concentrations of 300 mg/mL with 400 mg/mL on a 4-detector scanner, also determined no significant differences in diagnostic ability of CTA for peripheral arterial disease. This could perhaps be explained by applying findings from the coronary CTA literature, whereby Becker and colleagues45 determined that coronary artery attenuation levels of 250 to 300 HU were optimal for the evaluation of coronary artery disease because higher attenuation values may underestimate the amount of atherosclerosis owing to obscuration of vessel wall calcification. In our institution, we use a contrast media iodine concentration of 350 mg/mL.
Dual-Head Power Injectors
To achieve the desired arterial Hounsfield unit, a fast iodinated contrast injection with a tight arterial contrast bolus is necessary. Thus, patients will need to have a well-positioned, large-bore (18-gauge), intravenous cannula within the antecubital fossa. A dual-head power injector permits both contrast material and saline to be administered separately, concurrently, and sequentially. This means that two separate injection phases are possible, the first with 100% iodinated contrast material and the second with a 100% saline flush. The advantages of this method are that the arterial contrast enhancement is improved and prolonged, the contrast dose is reduced because most of the administered contrast material is within the arterial side, and the saline flush at the end clears dense contrast material from the superior vena cava to avoid streak artifact.14,30,46 The value of a triphasic injection strategy with an extra second phase comprising a contrast-saline mixture could also potentially reduce the requirements for contrast material. The new multislice scanners in combination with dual-head injectors allow marked decrease in the amount of contrast material used for routine CTA. However, the total volume of contrast material administered for a routine abdominal CT study (usually 150 mL of 300 mg/mL concentration of contrast material) should not change if solid organs, such as liver, are evaluated in conjunction with CTA. Lowering of the total volume of contrast material may potentially reduce the sensitivity of lesion detection.12,32
Many authors have reported the use of gadolinium chelates for CTA in patients who have diminished renal function.47–50 Although gadolinium is radiodense and may be used as a contrast agent with radiography, many gadolinium-based products have higher osmolality than iodine-based contrast media and are therefore potentially more nephrotoxic. More important, there have been several reports of nephrogenic systemic fibrosis leading to serious physical disability in patients with end-stage renal disease receiving gadolinium-containing contrast agents.51,52
TECHNIQUES
Indications and Technique Description
Scan protocols are highly variable and depend to a large extent on the type of MDCT scanner available (i.e., 4-, 16-, 64-, 128-, or 320-detector or dual energy) and also the manufacturer of the scanner. A suitable protocol should be chosen and programmed into the individual scanner for routine use. For the best CTA, a 16-slice scanner or higher should be used. A summary of the various protocols for the different vascular territories is outlined for a typical 64-slice MDCT scanner (Table 80-1).
TABLE 80-1 Summary of the Various Protocol Parameters for the Different Vascular Territories on a Typical 64-Slice MDCT Scanner
Cerebral CTA
Automated bolus tracking is the preferred technique to reliably obtain the optimal arterial phase by placing a region of interest on the internal carotid artery close to the skull base. An injection volume of 75 mL of a contrast agent with high iodine concentration (350 mg/mL) at a flow rate of 5 mL/sec is typically used. Images are acquired in the caudal to cranial direction with a slice thickness of 1 mm, slice interval of 0.5 mm, and 0.6 mm of collimation (Fig. 80-1).
Carotid CTA
In the United States, stroke is the leading cause of adult disability and the third leading cause of death; only heart disease and cancer cause more deaths annually. About 80% of strokes are ischemic strokes. Ischemic cerebrovascular events are often related to atherosclerotic narrowing at the carotid bifurcation. Conventional DSA is the reference standard for the evaluation of carotid artery disease.53,54 The advantage of noninvasive CTA is the reduction in cost and procedural risks. With conventional DSA, several studies have demonstrated up to a 4% risk of transient ischemic attack or minor stroke, a 1% risk of major stroke, and a small (<1%) risk of death.55 Plaque composition can be evaluated by CTA, which is an important indicator of plaque stability and helps with the assessment of risk factors for thromboembolic events. Noninvasive CTA provides the necessary information required before carotid endarterectomy and endovascular therapies.
[/not-level-membership-for-cardiovascular-category]
