Chapter 67 Clinical Use and Mechanistic Implications of Microvolt T-Wave Alternans and Signal-Averaged Electrocardiography
Microvolt T-Wave Alternans
Elizabeth S. Kaufman, Michael J. Cutler, David S. Rosenbaum
Introduction
The significance of repolarization alternans, a beat-to-beat alternation in T-wave morphology, was described almost a century ago by Sir Thomas Lewis, who noted that “alternation occurs either when the heart muscle is normal but the heart rate is very fast or when there is serious heart disease and the rate is normal.”1 In the past 25 years, clinicians have learned to exploit the phenomenon of T-wave alternans to identify serious heart disease, especially to detect patients who are at high risk of ventricular tachyarrhythmias and SCD. Whereas earlier investigators observed visible T-wave alternans in patients at risk of imminent SCD, including patients with Prinzmetal’s angina, electrolyte disorder, or QT prolongation, more recent investigators have used techniques capable of detecting invisible MTWA during modestly increased heart rate to identify patients with a significantly increased long-term risk of SCD.2–4 In the recent past, there has also arisen a need to identify patients with advanced structural heart disease whose risk of SCD is low. That is, in an age when the ICD is widely accepted as an effective (albeit expensive) means of preventing SCD, the perception of a need to identify low-risk patients who may not require an ICD is also growing.5,6 There are two major reasons for this. First, a strategy that can divert low-risk patients away from ICD implantation will increase the cost-effectiveness of ICD therapy. Second, the ability to identify low-risk patients could lead to an increase in the appropriate use of ICD therapy. There is evidence that patients who meet current criteria for primary prevention ICD implantation (based on ejection fraction alone) often do not receive ICDs.7 It is reasonable to think that both physicians and patients are more likely to accept ICD therapy if the need for such therapy can be more clearly defined. MTWA testing has shown promise for detecting patients at low risk for SCD.
In parallel with advances in the understanding of the clinical implications of MTWA testing, new insights into the cellular and tissue-level mechanisms of T-wave alternans have also become available. Experimental models have shown that T-wave alternans occurs during alternation of action potential morphology, which may occur heterogeneously throughout the heart and lead to electrical instability.8 Evidence suggests that alternans of calcium cycling within the sarcoplasmic reticulum may underlie T-wave alternans.9
Mechanisms of T-Wave Alternans
In 1999, Pastore et al used high-resolution optical mapping with voltage-sensitive dye in a guinea pig model to measure alternans of action potential duration in different areas of the myocardium.8 Above a critical heart rate, groups of cells alternated out of phase with other nearby cells (i.e., short-long-short action potentials in one area coincided with long-short-long action potentials nearby). This situation led to re-entry and VF, demonstrating the mechanism linking alternans with ventricular tachyarrhythmias and SCD.
Two leading hypotheses for the underlying electrophysiological mechanism of action potential duration alternans have been proposed. (1) The restitution hypothesis states that alternans occurs when the cell membrane’s ion channels are not able to produce complete repolarization in time for the next action potential. Although this may be one mechanism involved in alternans, it fails to explain some observations (e.g., why alternans is seen in ischemia when the restitution slope is flat).10 (2) The other hypothesis is that alternans occurs when the heart rate exceeds the capability of cellular calcium cycling mechanisms to maintain intracellular calcium homeostasis. Pruvot et al measured simultaneous action potentials and calcium (Ca2+) transients in the guinea pig model and found consistent parallels between action potential and Ca2+ alternans both spatially and temporally. They concluded that T-wave alternans is closely associated with Ca2+ cycling. To further support the Ca2+ cycling hypothesis, reduced expression of SR Ca2+-adenosine triphosphatase, which reclaims cytosolic Ca2+, or impaired ryanodine receptor function, which is responsible for the release of Ca2+ from the sarcoplasmic reticulum, are associated with Ca2+ alternans and action potential duration alternans.11,12
Measurement of Microvolt T-Wave Alternans in Clinical Practice
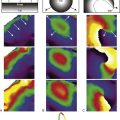
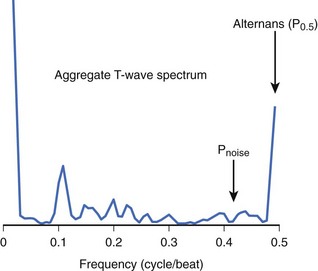
Although MTWA is relatively common in high-risk patients, there are several obstacles to detecting such small (microvolt-level) fluctuations in the T wave and, in particular, to distinguishing MTWA from other sources of fluctuation in the electrocardiogram (ECG) signal. Sources of confounding signal variation include variation in heart rhythm (such as sinus arrhythmia or atrial or ventricular ectopy), respiration (a periodic source of noise), and noise at the patient-electrode interface. To detect MTWA and distinguish it from other signal variations, the spectral method was developed.13 This method involves measuring the amplitude of the T wave in sequential beats to create a time series, which is then analyzed using fast Fourier transform to produce a power spectrum (Figure 67-1). The power at 0.5 cycles/beat corresponds to every-other-beat MTWA. MTWA is reported in microvolts as alternans voltage, the square root of the power. Along with alternans voltage, alternans ratio (k) is also reported. This is alternans power divided by the standard deviation of the background noise. In contrast, a nonspectral method, called modified moving average analysis, divides beats into even and odd bins and averages the morphology of T waves in each bin over several beats at a time.14 The difference in amplitude of the odd beats versus the even beats is a measure of alternans. The modified moving average technique is susceptible to false detection of alternans in the presence of noise.15 Moreover, this technique has not yet been validated adequately as a long-term clinical risk predictor.
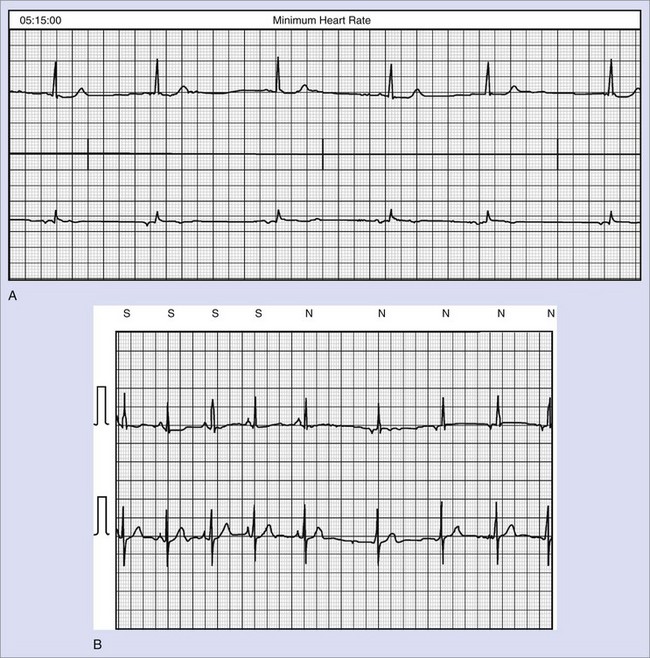
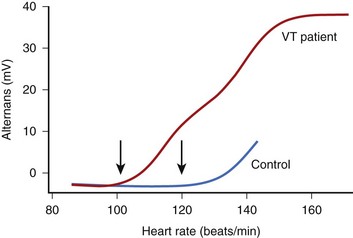
The onset of MTWA occurs when an individual’s heart rate exceeds a particular threshold heart rate, and MTWA tends to persist while the heart rate remains higher than that threshold heart rate.13,16 The threshold heart rate is specific to an individual. Whereas in normal subjects, MTWA may appear at high heart rates, in patients with structural heart disease and high risk of death or sustained ventricular arrhythmias, the threshold heart rate for MTWA tends to be less than 110 beats/min (Figure 67-2).17–19 The higher the heart rate at which MTWA is measured, the higher the sensitivity and the lower the specificity for detecting individuals at high risk of ventricular arrhythmia.18 By convention, MTWA that occurs at heart rate of 110 beats/min or less has been defined as abnormal.20 To detect abnormal MTWA, it is therefore necessary to increase the heart rate into the range of 105 to 110 beats/min.
Initial studies of MTWA used atrial pacing to elevate heart rate.21 Subsequently, exercise testing was adopted, and most large clinical trials assessing the value of MTWA testing have been done with exercise. Because the magnitude of MTWA oscillates over time, even at a constant heart rate, in an MTWA study it is important to maintain a subject’s heart rate in the target zone between 100 and 110 beats/min for several minutes.17 Most standard work-based exercise protocols such as the Bruce protocol elevate heart rate too quickly through this critical zone. The performance of a diagnostic MTWA test requires a heart rate–guided exercise protocol tailored to an individual’s level of fitness and heart rate response.
Traditionally, MTWA tests have been classified as positive, negative, or indeterminate.20 A MTWA test is considered “positive” when MTWA appears at an onset heart rate of 110 beats/min or less, with a magnitude of more than 1.9 µV and an alternans ratio greater than 3, and is sustained for at least 1 minute while the heart rate remains over the heart rate threshold. MTWA study results are negative if there is no sustained MTWA at an onset heart rate of 110 beats/min or less and there is at least 1 minute of recording of sinus tachycardia at a heart rate 105 beats/min or greater, during which time there is a low noise level (<2 µV), fewer than 10% ectopic beats, and no nonsustained MTWA. Study results that do not meet either of these criteria are considered indeterminate.
Several factors may interfere with the measurement of MTWA and result in indeterminate study results. Two of these are technical issues: (1) high levels of noise (which can be reduced by careful skin preparation and use of high-resolution electrodes) and (2) rapid elevation of heart rate through the target heart rate zone (which can be avoided by a modified exercise protocol tailored to heart rate). In addition, several patient-related factors interfere with the measurement of MTWA. Failure to elevate heart rate to at least 105 beats/min, dense (usually ventricular) ectopy that persists during exercise, and the occurrence of nonsustained MTWA can also lead to what has been termed an indeterminate test result. Recently, a detailed analysis22 of the causes and outcomes of indeterminate MTWA test results showed that only about 6% of “indeterminate” tests were so classified because of technical factors (noise or rapid heart rate rise); the other 94% were caused by patient factors. The prognostic significance of an indeterminate test was as bad as a positive test result, lending support to the practice of combining positive and indeterminate results into a single abnormal category for the purpose of risk stratification.
There has been debate among MTWA investigators regarding whether β-blocker therapy should be held before testing. When pacing is used to elevate heart rate, β-blockade decreases alternans voltage and converts a substantial number of positive tests to negative.23 β-Blocker therapy may also interfere with achieving the target heart rate of 105 beats/min during an exercise study. However, continuing β-blocker therapy is convenient, and testing on β-blocker may more accurately assess risk in patients who will continue long-term therapy with these medications.24 In the large study by Bloomfield et al, of which the analysis of indeterminate results was a substudy, more than 80% of patients were taking β-blocker medications, which were not held before MTWA testing.22,25 Nevertheless, MTWA testing had excellent predictive accuracy in that study. A meta-analysis by Chan et al showed a much higher predictive power of MTWA in studies that did not withhold β-blockers than in those that did.26
Measurement of MTWA is reproducible when testing is repeated within a short time span.27,28 Few data regarding the long-term stability of MTWA are available. The large studies that have led to the acceptance of MTWA as a prognostic indicator have required sinus rhythm and have been performed with exercise. Preliminary studies suggest that AV sequential pacing and pharmacologic elevation of heart rate may provide additional methods for assessing MTWA, although the prognostic value of such testing has not been validated.29,30 A study by Kraaier et al showed low concordance among exercise, atrial pacing, and AV sequential pacing; the predictive value of these methods has not been established.31
Development of Microvolt T-Wave Alternans as a Tool for Clinical Risk Stratification
Studies Establishing Microvolt T-Wave Alternans as a Marker of Susceptibility to Sudden Cardiac Death
After initial studies in animals showed a relationship between MTWA and vulnerability to ventricular fibrillation, Rosenbaum et al published the first prospective study of MTWA as a predictor of clinical risk.13,21 In this study, atrial pacing was used to elevate heart rate in patients undergoing electrophysiological studies. The presence of MTWA at a paced heart rate of 100 beats/min was related to inducibility of ventricular tachycardia (VT) and to the risk of future arrhythmic events. Subsequently, Hohnloser and Estes demonstrated that noninvasive exercise testing could yield MTWA results that were comparable with those seen with atrial pacing.16,32 Additional studies showed that MTWA assessed during exercise performed well as a predictor of future ventricular arrhythmic events compared with other noninvasive risk stratifiers, even with invasive electrophysiological studies.33–36 A consistent finding in these studies was the strong negative predictive value of a negative MTWA test.
However, not all studies showed a high positive predictive value of the MTWA test. Tapanainen et al assessed MTWA in patients with acute myocardial infarction during the predischarge exercise test (when many patients could not or were not pushed to achieve an adequate heart rate) and found that an indeterminate or incomplete MTWA study was strongly associated with risk of death; the negative predictive accuracy of an MTWA study was 99%.37 In the Marburg Cardiomyopathy Study, a positive MTWA was not a significant risk predictor, although an indeterminate test was associated with significant ventricular arrhythmia.38 Interestingly, the patients in the Marburg study had MTWA analysis performed off β-blocker therapy. It may be that MTWA testing performed on β-blocker therapy correlates better with chronic risk for patients on this background therapy, as suggested by Klingenheben et al.24 As noted above, a recent meta-analysis by Chan et al showed a much higher predictive power of MTWA in studies that did not withhold β-blockers than in those that did.26
Microvolt T-Wave Alternans in Patients with Depressed Ejection Fraction After Myocardial Infarction
The results of the Multicenter Automatic Defibrillator Implantation Trial II (MADIT II) showed a reduction in the mortality rate of patients with chronic ischemic heart disease and ejection fraction 0.30 or less with prophylactic ICD implantation, but at a great cost (approximately 17 ICDs needed to be implanted to save 1 life). Following this, investigators began to explore the use of MTWA to find a low-risk subset of “MADIT-like” patients who might have event-free survival without protection by an ICD. Studies by Hohnloser and Bloomfield pointed out the very high negative predictive value of MTWA in this population and proposed that patients with negative MTWA results (positive and indeterminate results were grouped as “non-negative” or “abnormal”) might safely avoid ICD implantation.39,40 Chow et al studied 768 patients with ischemic cardiomyopathy and, by using propensity analysis, determined that ICD implantation offered a much higher mortality benefit in patients with non-negative MTWA results.41
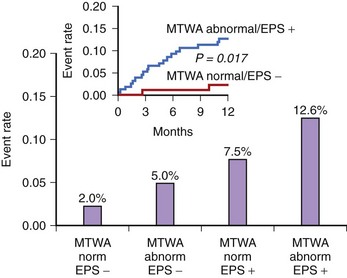
In the Alternans Before Cardioverter Defibrillator (ABCD) trial, a 95% negative predictive value of MTWA at 1 year was comparable with the negative predictive value of invasive electrophysiological testing; at 2 years the negative predictive value of MTWA was not as high.42 This study showed that (1) noninvasive MTWA testing can be used to improve primary prevention (separating higher risk patients from lower risk patients) without the risk or cost associated with invasive electrophysiological testing, (2) risk stratification may need to be repeated periodically because the myocardial substrate changes over time, and (3) the value of MTWA plus electrophysiological testing was superior to that of either test alone, suggesting that multiple risk markers should be used in combination for optimal risk stratification (Figure 67-3). A subanalysis of the ABCD data showed that an abnormal MTWA predicted unstable ventricular arrhythmia, whereas a positive electrophysiological test predicted monomorphic VT.43
The Noninvasive Risk Assessment Early After a Myocardial Infarction (REFINE) study reaffirmed the advantages of combining multiple risk markers.44 In this study of patients who had an MI, impaired heart rate turbulence, abnormal MTWA, and low ejection fraction were combined to identify patients at high risk. Of note, this was true when patients were assessed 10 to 14 weeks but not 2 to 4 weeks after the MI. A study by Huikuri et al also showed that MTWA performed early after MI was not a useful risk predictor.45
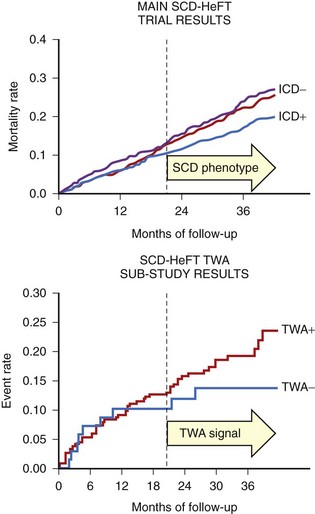
In contrast to the studies that showed a high negative predictive value of MTWA in stable post-MI patients, the Microvolt T-Wave Alternans Testing for Risk Stratification of Post-Myocardial Infarction Patients (MASTER) trial failed to show that MTWA status could predict ventricular tachyarrhythmic events (of which 90% were appropriate ICD therapies).46 Published in the same year, the Sudden Cardiac Death in Heart Failure Trial (SCD-HeFT) alternans substudy, which randomized both patients with MI and those with nonischemic cardiomyopathy to ICD, amiodarone, or placebo therapy, reported that MTWA testing did not predict arrhythmic events or death.47 As pointed out in the editorial that accompanied this report, however, the survival benefit of the ICD in SCD-HeFT only emerged between 18 and 24 months after randomization, at exactly the time that a difference in event-free survival became apparent in the populations with normal and abnormal MTWA results (Figure 67-4).48 Hohnloser showed that in prospective clinical trials evaluating MTWA as a risk predictor, trials with a low rate of ICD implantation showed a consistently high negative predictive value of MTWA.49 In contrast, trials that used ICD therapies as a surrogate endpoint for SCD found MTWA to be less useful. Hohnloser concluded that MTWA has a high negative predictive value for SCD but that ICD therapies are an unreliable surrogate endpoint for SCD.
Microvolt T-Wave Alternans in Patients with Other Types of Cardiomyopathy
Several studies have shown MTWA to be a valuable risk predictor in patients with heart failure.25,50 These studies, which combined patients with ischemic cardiomyopathy and those with nonischemic cardiomyopathy, showed a high negative predictive value of MTWA, as did additional studies that focused only on patients with nonischemic dilated cardiomyopathy.36,51,52 The usefulness of MTWA for predicting the risk of ventricular tachyarrhythmias in the nonischemic cardiomyopathy population stands in contrast to the insensitivity of other risk stratifiers, including invasive electrophysiological testing. However, a recent study of 286 patients with ejection fraction of 35% or less (ischemic and nonischemic cardiomyopathies) raised questions about the adequacy of MTWA for identifying a low-risk subgroup.53 In this study, the negative predictive value of MTWA for 2-year total mortality rate was only 90%. It should be noted, however, that patients in this study had nonsustained VT, syncope, or both and therefore had a higher baseline risk than most primary prevention populations.
Microvolt T-Wave Alternans as a Marker of Risk in Patients with Preserved Ejection Fraction
Recently, Ikeda et al showed that MTWA can identify a high-risk subgroup among patients with well-preserved ejection fraction after myocardial infarction (MI).54 MTWA has also shown promise as a risk predictor in hypertrophic cardiomyopathy.55,56 In contrast, MTWA has not been helpful as a risk discriminator in congenital long QT syndrome (LQTS) or in Brugada syndrome.57–59 Thus MTWA appears to be of value in disease states associated with structural heart disease.
Directions for Further Study
MTWA has been well established as a valuable predictor of risk for SCD among patients with structural heart disease. However, significant questions remain. MTWA is a dynamic phenomenon that is affected, for example, by heart rate and by β-blockade. It is not known how early MTWA should be measured after MI for the best long-term risk prediction and how often MTWA testing should be repeated. Because a patient’s arrhythmogenic substrate may change over time (because of scar maturation, ischemic events, changes in left ventricular function), serial MTWA testing will likely add value to risk assessment. The value of MTWA measurement during dual-chamber pacing or during pharmacologic heart rate elevation requires further study, as does the modified moving average technique. The magnitude of MTWA and its onset heart rate may contribute additional prognostic information to the traditional MTWA test. The usefulness of MTWA as a prognostic tool in lower risk populations (such as patients with preserved left ventricular function after MI) has only begun to be explored.54 Finally, genetic polymorphisms that underlie susceptibility to MTWA (and to ventricular arrhythmia) require exploration.
Signal-Averaged Electrocardiography
Gioia Turitto, Raushan Abdula, and Nabil El-Sherif
Signal-averaged electrocardiography (SAECG) is one of several proposed methods for noninvasive risk stratification for SCD. The term signal-averaged electrocardiography refers to techniques for improving the signal/noise ratio, thus allowing analysis of signals that are too small to be detected by routine measurement. Among such signals are those arising from areas of slow and inhomogeneous conduction in diseased ventricular myocardium (usually referred to as late potentials [LPs]). These potentials are small because the activation front is slow and fractionated, the mass of tissue undergoing depolarization is small, or both. LPs are of clinical relevance because they may identify a substrate for re-entrant ventricular excitation.60
Important technical advances in the field of SAECG in the early 1980s included the introduction and refinement of filtering techniques, the selection of bipolar orthogonal leads, and their combination into a vector magnitude for maximal sensitivity as well as the use of computer algorithms to identify QRS offset and provide numeric values for signals in the terminal part of the QRS.61 In 1991, a Task Force of the American College of Cardiology (ACC), the American Heart Association (AHA), and the European Society of Cardiology (ESC) published standards for the acquisition and analysis of LPs and attempted to define clinical indications for the SAECG.62 The Task Force original recommendations were updated by an ACC Expert Consensus Document.63 The recommended applications consisted of risk stratification for future arrhythmic events and SCD in survivors of MI and prediction of malignant ventricular tachyarrhythmias in patients with coronary artery disease (CAD) and syncope or asymptomatic nonsustained VT. Other groups of patients with organic heart disease in whom SAECG has been used for risk stratification for SCD include patients with idiopathic dilated cardiomyopathy, hypertrophic cardiomyopathy, right ventricular cardiomyopathy. More recently, the prognostic value of SAECG was examined in a statement prepared by a Joint ACC/AHA/Heart Rhythm Society Writing Group on noninvasive risk stratification techniques for identifying patients at risk of SCD.64 This Expert Consensus Document acknowledged that an abnormal SAECG may identify patients with prior MI at risk of SCD. Given its high negative predictive accuracy, SAECG could be useful for the identification of low-risk patients. However, the document noted that routine use of SAECG to identify patients at high risk for SCD is not adequately supported by existing data and further studies would be required to assess the usefulness of this test.
Technical Aspects of Signal-Averaged Electrocardiogram
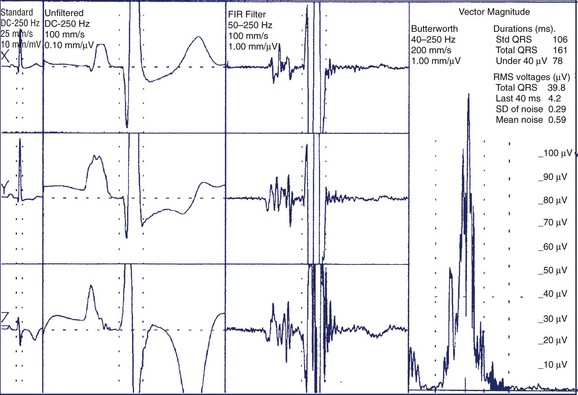
For the time-domain analysis of SAECG, data acquisition consists of several steps: proper recording, amplification, digitization, identification and alignment of the signal of interest, time-ensemble averaging, and filtering. Typically, 200 to 600 cardiac cycles are acquired. The QRS selection process uses a cross-correlation algorithm in which each detected QRS is compared with a preselected template. A correlation coefficient of more than 0.98 is typically required for a good match; this allows rejection of abnormal QRS such as ventricular premature complexes or noisy beats. Time-ensemble averaging is used because the signal of interest, that is, the QRS, is repetitive, whereas much of the interfering noise (environmental noise, electromyographic noise, etc.) is random. Thus, time-ensemble averaging results in an improved signal/noise ratio. Filtering is also applied to reduce the residual noise and improve identification of LPs. A bi-directional Butterworth filter has been recommended for analysis of LPs.61 By using this filter, the first part of the QRS is bandpass filtered, and the second part of the QRS as well as the ST segment are filtered in reverse time, starting from the end of the data and moving toward the middle of the QRS. A bipolar orthogonal lead system is used to optimize the recording of LPs because of their unknown distribution on the body surface. The three leads are processed separately and then combined into a vector magnitude of the form √X2 + Y2 + Z2 and used for subsequent analysis. Bandpass filtering of the signal-averaged vector magnitude may further discriminate LPs from noise. Early studies of the frequency signature of LPs showed that they predominantly contain high frequencies and that filters that eliminate low frequencies may expose LPs more clearly. Commercial SAECG systems apply bandpass filtering with a low-pass setting of 250 Hz and a high-pass setting of 25 to 40 Hz. Computer algorithms are used to identify QRS onset and offset. These algorithms depend on the signal/noise ratio.61 Once the QRS offset is defined, time-domain analysis of an SAECG mainly consists of the determination of three parameters: (1) the duration of the filtered QRS complex (QRSD), (2) the duration of low-amplitude signals of less than 40 µV, that is, the time that the filtered QRS voltage remains below 40 µV (LAS40), and (3) the root mean square voltage of the terminal 40 ms of the QRS (RMS40). The ad hoc Task Force recommended that for adequate LP analysis, a low noise level of less than 1 µV with a 25-Hz high-pass cutoff or less than 0.7 µV with a 40-Hz high-pass cutoff be obtained.62 The Task Force also acknowledged that the definition of an LP and the scoring of an SAECG as normal or abnormal have not been standardized. Representative criteria include that an LP exists (using a 40-Hz high-pass filter) when (1) QRSD is greater than 114 ms; (2) LAS40 is greater than 38 ms; and (3) RMS40 is less than 20 µV (Figure 67-5).62 It has been suggested that gender-specific criteria may be required for optimal test performance because men have, on average, longer QRSD compared with women.65 The presence of intraventricular conduction defects may also hinder the recognition of LPs on the SAECG.63,64 Time-domain analysis remains the mainstay for SAECG analysis because of its proven diagnostic accuracy and high reproducibility. More recently, ambulatory electrocardiography has been proposed to record and examine the SAECG for risk stratification in patients who have had MI.66,67
Techniques for frequency-domain analysis were devised to overcome some of the limitations of time-domain analysis, namely the inability to detect abnormal and delayed conduction within the QRS complex or in the presence of intraventricular conduction defects. The rationale for frequency-domain analysis is the observation that the QRS, LPs, and ST-segment waveforms in the SAECG have different spectral characteristics. Various techniques have been described under different names, including spectro-temporal mapping, spectral turbulence analysis, wavelet decomposition analysis, and acceleration spectrum analysis.68 At the present time, none of these techniques has gained widespread acceptance because of a lack of standardization, suboptimal reproducibility, and the lack of convincing evidence that frequency-domain analysis results in greater diagnostic and prognostic accuracy compared with conventional time-domain analysis.
Clinical Applications of Signal-Averaged Electrocardiography
Patients with Prior Myocardial Infarction
The prevalence of an abnormal SAECG in normal subjects and in patients with prior MI with or without ventricular tachyarrhythmias is described in Table 67-1. The reported wide range in the prevalence of LPs after MI may be related to differences in the diagnostic criteria for LPs as well as in the time of recording of the SAECG and to the site of MI. For instance, LPs may be more common in patients who have had inferior MI compared with patients who have had anterior MI.69 This could be related to the fact that the inferoposterior segments of the left ventricle depolarize later compared with the anteroseptal and anterior segments. Thus in patients with inferior MI, delayed regional activation is likely to outlast normal ventricular depolarization and appear as LPs after the QRS offset. In contrast, in patients with anterior MI, the abnormal myocardial region is activated early during the QRS complex, resulting in partial obscuring of LPs.
Table 67-1 Prevalence of an Abnormal Signal-Averaged Electrocardiogram in Normal Subjects and in Post-Infarction Patients with or Without Malignant Ventricular Tachyarrhythmias
| STUDY GROUPS | Prevalence (%) | |
|---|---|---|
| TIME-DOMAIN | FREQUENCY-DOMAIN | |
| Normal subjects | 0-10 | 4 |
| Recent MI (<2 weeks), no VTA | 14-29 | 26 |
| Remote MI (>1 month), no VTA | 18-33 | 23 |
| Remote MI (>1 month), VTA | 52-90 | 73-92 |
MI, Myocardial infarction; VTA, ventricular tachyarrhythmias.
From Cain ME: Signal-averaged electrocardiography. ACC Expert Consensus Document, J Am Coll Cardiol 27:238–249, 1996, with permission from the American College of Cardiology Foundation.
Risk stratification of survivors of MI has been extensively performed with time-domain SAECG. There is increased likelihood of malignant ventricular tachyarrhythmias and SCD in post-MI patients with an abnormal SAECG.64,70–72 A multicenter substudy of the Cardiac Arrhythmia Suppression Trial (CAST) sponsored by the National Institutes of Health (NIH) was conducted to define the best predictive criteria of time-domain SAECG in the post-MI period.72 A total of 1158 patients were recruited and followed up for an average of 10 ± 3 months. Forty-five patients (4%) had serious arrhythmic events (nonfatal VT or SCD). A Cox regression analysis with six SAECG variables indicated that QRSD filtered at 40 Hz greater than 120 ms was the most predictive criterion of arrhythmic events (Table 67-2). An abnormal SAECG, defined as QRSD at 40 Hz greater than 120 ms, was present in 12% of the study population. The positive, negative, and total predictive accuracy of an abnormal SAECG was 17%, 98%, and 88%, respectively.72
Table 67-2 Prognostic Value of Signal-Averaged Electrocardiography after Myocardial Infarction in the CAST Substudy
| VARIABLE | χ2 | P VALUE |
|---|---|---|
| QRSD/25 Hz | 32.4 | .0000 |
| RMS40/25 Hz | 4.1 | .0433 |
| LAS/25 Hz | 23.8 | .0000 |
| QRSD/40 Hz | 37.1 | .0000 |
| RMS40/40 Hz | 4.5 | .0344 |
| LAS/40 Hz | 10.3 | .0001 |
All parameters were measured at high-pass filter settings of 25 Hz and 40 Hz.
CAST, Cardiac Arrhythmia Suppression Trial; LAS, duration of low-amplitude signals of <40 µV; QRSD, high-frequency filtered QRS duration; RMS40, root mean square voltage of the terminal 40 ms of the QRS.
From El-Sherif N, Denes P, Katz R, et al: Definition of the best prediction criteria of the time domain signal-averaged electrocardiogram for serious arrhythmic events in the postinfarction period, J Am Coll Cardiol 25:908–914, 1995, with permission from the American College of Cardiology Foundation.
A review of studies in which the SAECG was performed in approximately 5000 patients within 1 month of MI, with an average follow-up of 13 months, showed that the SAECG was abnormal in 29% of patients and that arrhythmic events occurred in 7% of patients. The positive predictive accuracy of the SAECG was low (mean, 17%; range, 8% to 29%), whereas its negative predictive accuracy was high (mean, 96%; range, 81% to 99%).11 In a comprehensive meta-analysis, including almost 10,000 post-MI patients, Bailey et al confirmed the high sensitivity and specificity of the test, as well as its low positive predictive accuracy (Table 67-3).71 Because of the low predictive accuracy of the test, no intervention is justified in post-MI patients based solely on the presence of an abnormal SAECG.64
Table 67-3 Prognostic Value of Signal-Averaged Electrocardiography for Serious Arrhythmic Events after Myocardial Infarction
| Studies (n) | 22 |
| Patients (n) | 9883 |
| Follow-up (mo) | 22 |
| Arrhythmic events (%) | 7.2 |
| Sensitivity (%) | 62 |
| Specificity (%) | 77 |
| Positive predictive accuracy (%) | 19 |
| Relative risk | 4.8 |
| Odds ratio | 5.7 |
From Bailey JJ, Berson AS, Handelsman H, Hodges M: Utility of current risk stratification tests for predicting major arrhythmic events after myocardial infarction, J Am Coll Cardiol 38:1902–1911, 2001, with permission from the American College of Cardiology Foundation.
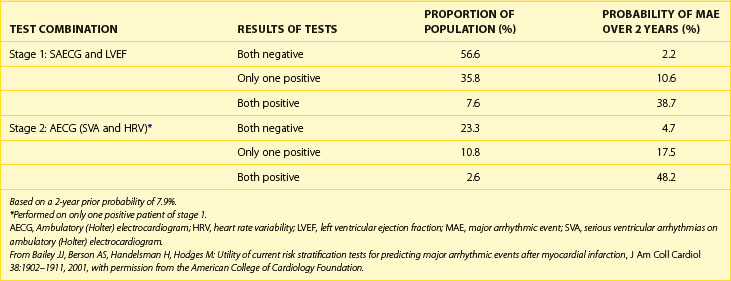
The predictive value of the SAECG could be increased by combining its results with other clinical data such as left ventricular ejection fraction (LVEF), degree of ventricular ectopy, heart rate variability, and T-wave alternans. According to Bailey et al, it may be feasible to stratify as many as 90% of post-MI patients into “high risk” (>30%) and “low risk” (<3%) categories by using combinations of four noninvasive tests (Table 67-4).71 With this approach, the first step would be performance of both SAECG and LVEF. If the both tests were negative or both positive (as would be true for 64.2% of the patients), further testing would not be done because the 2-year probability of a major arrhythmic event (MAE) would be very low in the former situation (2.2%) and high enough in the latter situation (38.7%) to warrant consideration of ICD implantation. The second step would be performance of a 24-hour ambulatory ECG in the 35.8% of patients with only a positive SAECG or only a low LVEF, resulting in an intermediate risk for an MAE (10.6% over 2 years). If the ambulatory ECG and heart rate variability were both normal or both abnormal (25%), no further testing would be needed because in the former situation, the posterior probability would still be below the original prior probability despite either an abnormal SAECG or a low LVEF, and in the latter case, the posterior probability would again be high enough to warrant consideration of ICD implantation. As a result of this noninvasive approach, approximately 90% of patients would be accurately risk stratified into low-risk (80%) and high-risk (10%) groups for MAE, and the unstratified group would include only 10% of post-MI patients.71
Table 67-4 Staged Application of Tests for Prediction of Major Arrhythmic Events Following Myocardial Infarction
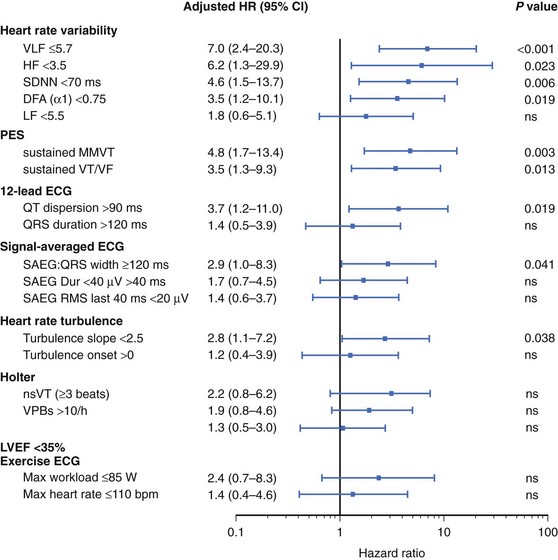
A recently noted limitation of risk stratification studies in post-MI patients may be the reduced ability to predict arrhythmic events in the era of aggressive treatment of MI, including reperfusion or revascularization strategies and pharmacotherapy (i.e., β-blockers). In this setting, the prognostic value of LPs may be diminished. However, the recently published Cardiac Arrhythmias and Risk Stratification after Acute Myocardial Infarction (CARISMA) study confirmed the ability of SAECG to predict arrhythmic events after MI.73 In total, 312 patients with a mean LVEF of 31% ± 6% were included in the study. Heart rate variability and turbulence, Holter monitoring for ambient arrhythmias, SAECG, T-wave alternans, and programmed electrical stimulation were performed 6 weeks after MI. The primary endpoint was ECG-documented VF or symptomatic sustained VT. To document these arrhythmic events, the patients received an implantable ECG loop recorder. There were 25 primary endpoints (8%) during the follow-up of 2 years. QRS duration on the SAECG was a significant predictor of the primary endpoint, along with several heart rate variability measures (Figure 67-6). A QRSD greater than 120 ms on the SAECG had a sensitivity, specificity, and positive and negative predictive values for arrhythmic events of, respectively, 44%, 85%, 20%, and 95%.73
Patients with Nonsustained Ventricular Tachycardia
SAECG was initially used to predict the outcome of programmed ventricular stimulation in patients with CAD and asymptomatic nonsustained VT. In a study from Turitto et al, LPs proved to be the single most accurate predictor for the induction of sustained monomorphic VT in 105 patients with nonsustained VT.74 In this study, concordance between the results of programmed stimulation and those of SAECG was observed in 84% of cases. The largest subgroup consisted of patients who had a normal SAECG and no induced sustained monomorphic VT (70%). In these patients, the spontaneous arrhythmia may have been caused by mechanisms other than re-entry. The group with both abnormal SAECG and induced sustained VT accounted for 14% of cases. The results of the two tests were discordant in the remaining 16% of cases. This may be explained by electrophysiological limitations of both programmed stimulation and SAECG techniques.74 Subsequent studies have shown that the SAECG may also predict the results of programmed stimulation in patients with nonischemic dilated cardiomyopathy.75
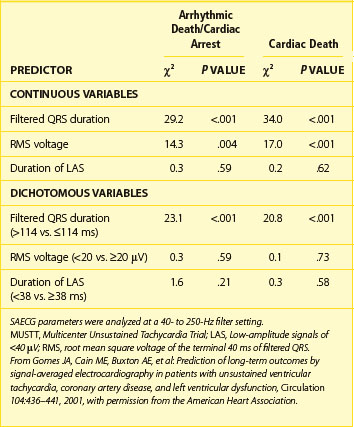
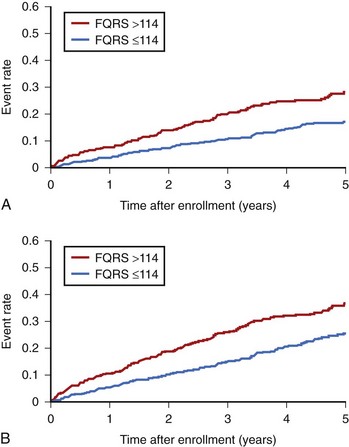
The most compelling data on the predictive accuracy of SAECG in patients with CAD, prior MI, left ventricular dysfunction, and asymptomatic nonsustained VT originated from the SAECG substudy of the Multicenter Unsustained Tachycardia Trial (MUSTT).76 In this large, prospective, multi-center study, SAECG data from 1268 patients were entered in a Cox proportional hazards modeling to examine individual and joint relations between SAECG parameters and arrhythmic death or cardiac arrest (primary endpoint), cardiac death, and total mortality. In all patients, SAECG quantitative variables were processed at 40 to 250 Hz and included filtered QRSD, RMS40, and LAS40. First, to assess the prognostic content of a “normal” versus “abnormal” SAECG, the SAECG parameters were analyzed as continuous variables and as dichotomized at standard cut points. A QRSD greater than 114 ms was the single most powerful independent predictor of the primary endpoint and cardiac death and was thus defined as an abnormal SAECG (Table 67-5).76 The SAECG variables remained significant predictors after adjustment for prognostic clinical and treatment factors. Second, to illustrate the ability of the SAECG to stratify risk, patients were divided by QRSD (>114 ms [abnormal SAECG] vs. <114 ms [normal SAECG]) and Kaplan-Meier survival curves were generated for each outcome (Figure 67-7).76 With an abnormal SAECG, the 5-year rates of the primary endpoint (28% vs. 17%, P = .0001), cardiac death (37% vs. 25%, P = .0001), and total mortality (43% vs. 35%, P = .0001) were significantly higher. The combination of LVEF less than 30% and abnormal SAECG identified a particularly high-risk subset that constituted 21% of the total population. Of the patients with this combination, 36% experienced arrhythmic events and 44% experienced cardiac death during a 5-year follow-up. In contrast, 13% and 20% of patients without this combination experienced arrhythmic events and cardiac death, respectively, during a 5-year follow-up. The authors concluded that an abnormal SAECG (defined as a filtered QRS duration >114 ms) is a strong predictor for both arrhythmic events and cardiac mortality in patients with ischemic cardiomyopathy.76
Table 67-5 Multivariate Analysis of Signal-Averaged Electrocardiography Quantitative Values as Predictors of Outcome in the MUSTT Substudy
Patients with Nonischemic Dilated Cardiomyopathy
Studies investigating the prognostic value of SAECG in nonischemic dilated cardiomyopathy are relatively scarce. In some studies, SAECG was found to be a predictor of survival. The heterogeneity of the study populations with respect to the presence of spontaneous ventricular tachyarrhythmias and bundle branch block as well as the empirical use of antiarrhythmic drugs, which could have influenced both the results of SAECG and clinical outcome, may explain the discrepancies between these reports and other series that did not find any correlation between an abnormal SAECG and prognosis in patients with dilated cardiomyopathy.77,78
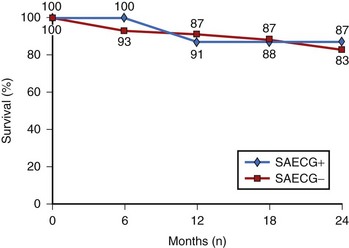
Turitto et al performed SAECG and programmed ventricular stimulation in a group of 80 subjects with nonischemic dilated cardiomyopathy and spontaneous nonsustained VT, with a mean follow-up of 22 months.77 Survival analysis with Cox proportional hazards model demonstrated that no test result was significantly associated with arrhythmic events or total cardiac mortality. When 2-year survival analysis was based on the results of SAECG, there were no significant differences in arrhythmia-free survival or cumulative survival between patients with abnormal SAECG and those without abnormal SAECG (Figure 67-8). The presence of a normal SAECG and lack of inducibility of sustained monomorphic VT did not portend a favorable prognosis in patients with nonischemic dilated cardiomyopathy and spontaneous nonsustained VT.77
In the Marburg Cardiomyopathy Study, arrhythmia risk stratification was performed prospectively in 343 patients with idiopathic dilated cardiomyopathy.78 This included analysis of LVEF by echocardiography, SAECG, arrhythmias on ambulatory ECG, QTc dispersion, heart rate variability, baroreflex sensitivity, and T-wave alternans. During 52 ± 21 months of follow-up, MAEs, defined as sustained VT, VF, or SCD, occurred in 46 patients (13%). On multivariate analysis, LVEF was the only significant arrhythmia risk predictor in patients with sinus rhythm, with a relative risk of 2.3 per 10% decrease of EF (95% confidence interval, 1.5 to 3.3; P = .0001). In patients with atrial fibrillation, multivariate Cox analysis identified LVEF and absence of β-blocker therapy as the only significant arrhythmia risk predictors. SAECG, baroreflex sensitivity, heart rate variability, and T-wave alternans did not appear to be helpful.78 These results strongly support the recommendation that novel risk stratification strategies be sought in patients with nonischemic dilated cardiomyopathy.
Key References
Bloomfield DM, Bigger JT, Steinman RC, et al. Microvolt T-wave alternans and the risk of death or sustained ventricular arrhythmias in patients with left ventricular dysfunction. J Am Coll Cardiol. 2006;47:456-463.
Bloomfield DM, Hohnloser SH, Cohen RJ. Interpretation and classification of microvolt T wave alternans tests. J Cardiovasc Electrophysiol. 2002;13:502-512.
Chan PS, Gold MR, Nallamothu BK. Do beta-blockers impact microvolt T-wave alternans testing in patients at risk for ventricular arrhythmias? A meta-analysis. J Cardiovasc Electrophysiol. 2010;21(9):1009-1014.
Chow T, Kereiakes DJ, Bartone C, et al. Microvolt T-wave alternans identifies patients with ischemic cardiomyopathy who benefit from implantable cardioverter-defibrillator therapy. J Am Coll Cardiol. 2007;49:50-58.
Costantini O, Hohnloser SH, Kirk MM, et al. The ABCD (Alternans Before Cardioverter Defibrillator) Trial: Strategies using T-wave alternans to improve efficiency of sudden cardiac death prevention. J Am Coll Cardiol. 2009;53:471-479.
Exner DV, Kavanagh KM, Slawnych MP, et al. Noninvasive risk assessment early after a myocardial infarction the REFINE study. J Am Coll Cardiol. 2007;50:2275-2284.
Hohnloser SH, Ikeda T, Cohen RJ. Evidence regarding clinical use of microvolt T-wave alternans. Heart Rhythm. 2009;6:S36-S44.
Hohnloser SH, Klingenheben T, Bloomfield D, Dabbous O, Cohen RJ. Usefulness of microvolt T-wave alternans for prediction of ventricular tachyarrhythmic events in patients with dilated cardiomyopathy: Results from a prospective observational study. J Am Coll Cardiol. 2003;41:2220-2224.
Hüser J, Wang YG, Sheehan KA, Cifuentes F, Lipsius SL, Blatter LA. Functional coupling between glycolysis and excitation-contraction coupling underlies alternans in cat heart cells. J Physiol (Lond.). 2000;524:795-806.
Ikeda T, Yoshino H, Sugi K, et al. Predictive value of microvolt T-wave alternans for sudden cardiac death in patients with preserved cardiac function after acute myocardial infarction: Results of a collaborative cohort study. J Am Coll Cardiol. 2006;48:2268-2274.
Kaufman ES, Bloomfield DM, Steinman RC, et al. “Indeterminate” microvolt T-wave alternans tests predict high risk of death or sustained ventricular arrhythmias in patients with left ventricular dysfunction. J Am Coll Cardiol. 2006;48:1399-1404.
Rosenbaum DS, Jackson LE, Smith JM, Garan H, Ruskin JN, Cohen RJ. Electrical alternans and vulnerability to ventricular arrhythmias. N Engl J Med. 1994;330:235-241.
Clinical Use and Mechanistic Implications of Microvolt T-Wave Alternans
1 Lewis T. Notes upon alternation of the heart. Q J Med. 1910;4:141-144.
2 Kleinfeld MJ, Rozanski JJ. Alternans of the ST-segment in Prinzmetal’s angina. Circulation. 1977;55:574-577.
3 Reddy CVR, Kiok JP, Khan RG, El-Sherif N. Repolarization alternans associated with alcoholism and hypomagnesemia. Am J Cardiol. 1984;53:390-391.
4 Schwartz PJ, Malliani A. Electrical alternation of the T-wave: Clinical and experimental evidence of its relationship with the sympathetic nervous system and with the long Q-T syndrome. Am Heart J. 1975;89:45-50.
5 Moss AJ, Zareba W, Hall WJ, et al. Prophylactic implantation of a defibrillator in patients with myocardial infarction and reduced ejection fraction. N Engl J Med. 2002;346:877-883.
6 Bardy GH, Lee KL, Mark DB, et al. Amiodarone or an implantable cardioverter-defibrillator for congestive heart failure. N Engl J Med. 2005;352:225-237.
7 Ruskin JN, Camm AJ, Zipes DP, et al. Implantable cardioverter defibrillator utilization based on discharge diagnoses from Medicare and managed care patients. J Cardiovasc Electrophysiol. 2002;13:38-43.
8 Pastore JM, Girouard SD, Laurita KR, et al. Mechanism linking T-wave alternans to the genesis of cardiac fibrillation. Circulation. 1999;99:1385-1394.
9 Pruvot EJ, Katra RP, Rosenbaum DS, Laurita KR. Role of calcium cycling versus restitution in the mechanism of repolarization alternans. Circ Res. 2004;94:1083-1090.
10 Walker ML, Rosenbaum DS. Repolarization alternans: Implications for the mechanism and prevention of sudden cardiac death. Cardiovasc Res. 2003;57:599-614.
11 Laurita KR, Katra R, Wible B, et al. Transmural heterogeneity of calcium handling in canine. Circ Res. 2003;92:668-675.
12 Hüser J, Wang YG, Sheehan KA, et al. Functional coupling between glycolysis and excitation-contraction coupling underlies alternans in cat heart cells. J Physiol (Lond). 2000;524:795-806.
13 Kovach JA, Nearing BD, Verrier RL. Angerlike behavioral state potentiates myocardial ischemia-induced T-wave alternans in canines. J Am Coll Cardiol. 2001;37:1719-1725.
14 Verrier RL, Nearing BD, Kwaku KF. Noninvasive sudden death risk stratification by ambulatory ECG-based T-wave alternans analysis: Evidence and methodological guidelines. Ann Noninvasive Electrocardiol. 2005;10:110-120.
15 Selvaraj RJ, Chauhan VS. Effect of noise on T-wave alternans measurement in ambulatory ECGs using modified moving average versus spectral method. Pacing Clin Electrophysiol. 2009;32:632-641.
16 Hohnloser SH, Klingenheben T, Zabel M, et al. T wave alternans during exercise and atrial pacing in humans. J Cardiovasc Electrophysiol. 1997;8:987-993.
17 Kaufman ES, Mackall JA, Julka B, et al. Influence of heart rate and sympathetic stimulation on arrhythmogenic T wave alternans. Am J Physiol Heart Circ Physiol. 2000;279:H1248-H1255.
18 Kavesh NG, Shorofsky SR, Sarang SE, Gold MR. Effect of heart rate on T wave alternans. J Cardiovasc Electrophysiol. 1998;9:703-708.
19 Turitto G, Caref EB, El-Attar G, et al. Optimal target heart rate for exercise-induced T-wave alternans. Ann Noninvasive Electrocardiol. 2001;6:123-128.
20 Bloomfield DM, Hohnloser SH, Cohen RJ. Interpretation and classification of microvolt T wave alternans tests. J Cardiovasc Electrophysiol. 2002;13:502-512.
21 Rosenbaum DS, Jackson LE, Smith JM, et al. Electrical alternans and vulnerability to ventricular arrhythmias. N Engl J Med. 1994;330:235-241.
22 Kaufman ES, Bloomfield DM, Steinman RC, et al. “Indeterminate” microvolt T-wave alternans tests predict high risk of death or sustained ventricular arrhythmias in patients with left ventricular dysfunction. J Am Coll Cardiol. 2006;48:1399-1404.
23 Rashba EJ, Cooklin M, MacMurdy K, et al. Effects of selective autonomic blockade on T-wave alternans in humans. Circulation. 2002;105:837-842.
24 Klingenheben T, Grönefeld G, Li YG, Hohnloser SH. Effect of metoprolol and d,l-sotalol on microvolt-level T-wave alternans—results of a prospective, double-blind, randomized study. J Am Coll Cardiol. 2001;38:2013-2019.
25 Bloomfield DM, Bigger JT, Steinman RC, et al. Microvolt T-wave alternans and the risk of death or sustained ventricular arrhythmias in patients with left ventricular dysfunction. J Am Coll Cardiol. 2006;47:456-463.
26 Chan PS, Gold MR, Nallamothu BK. Do beta-blockers impact microvolt T-wave alternans testing in patients at risk for ventricular arrhythmias? A meta-analysis. J Cardiovasc Electrophysiol. 2010;21(9):1009-1014.
27 Bloomfield DM, Ritvo BS, Parides MK, Kim MH. The immediate reproducibility of T-wave alternans during bicycle exercise. Pacing Clin Electrophysiol. 2002;25:1185-1191.
28 Turitto G, Mirandi AP, Pedalino RP, et al. Short-term reproducibility of T wave alternans measurement. J Cardiovasc Electrophysiol. 2002;13:641-644.
29 Raatikainen MJ, Jokinen V, Virtanen V, et al. Microvolt T-wave alternans during exercise and pacing in patients with acute myocardial infarction. Pacing Clin Electrophysiol. 2005;28(Suppl 1):S193-S197.
30 Caffarone A, Martinelli A, Valentini P, Vanoli E. T wave alternans detection during exercise stress test and during dobutamine stress. A comparative study in patients with a recent myocardial infarction. Ital Heart J. 2001;2:265-270.
31 Kraaier K, Verhorst PM, van der Palen J, et al. Microvolt T-wave alternans during exercise and pacing are not comparable. Europace. 2009;11:1375-1380.
32 Estes NAMI, Michaud G, Zipes DP, et al. Electrical alternans during rest and exercise as predictors of vulnerability to ventricular arrhythmias. Am J Cardiol. 1997;80:1314-1318.
33 Hohnloser SH, Klingenheben T, Li YG, et al. T wave alternans as a predictor of recurrent ventricular tachyarrhythmias in ICD recipients: Prospective comparison with conventional risk markers. J Cardiovasc Electrophysiol. 1998;9:1258-1268.
34 Gold MR, Bloomfield DM, Anderson KP, et al. A comparison of T-wave alternans, signal averaged electrocardiography and programmed ventricular stimulation for arrhythmia risk stratification. J Am Coll Cardiol. 2000;36:2247-2253.
35 Ikeda T, Sakata T, Takami M, et al. Combined assessment of T-wave alternans and late potentials used to predict arrhythmic events after myocardial infarction—a prospective study. J Am Coll Cardiol. 2000;35:722-730.
36 Hohnloser SH, Klingenheben T, Bloomfield D, et al. Usefulness of microvolt T-wave alternans for prediction of ventricular tachyarrhythmic events in patients with dilated cardiomyopathy: Results from a prospective observational study. J Am Coll Cardiol. 2003;41:2220-2224.
37 Tapanainen JM, Still AM, Airaksinen KEJ, Huikuri HV. Prognostic significance of risk stratifiers of mortality, including T wave alternans, after acute myocardial infarction: Results of a prospective follow-up study. J Cardiovasc Electrophysiol. 2001;12:645-652.
38 Grimm W, Glaveris C, Hoffmann J, et al. Noninvasive arrhythmia risk stratification in idiopathic dilated cardiomyopathy: Design and first results of the Marburg Cardiomyopathy Study. Pacing Clin Electrophysiol. 1998;21:2551-2556.
39 Hohnloser SH, Ikeda T, Bloomfield DM, et al. T-wave alternans negative coronary patients with low ejection and benefit from defibrillator implantation. Lancet. 2003;362:125-126.
40 Bloomfield DM, Steinman RC, Namerow PB, et al. Microvolt T-wave alternans distinguishes between patients likely and patients not likely to benefit from implanted cardiac defibrillator therapy: A solution to the Multicenter Automatic Defibrillator Implantation Trial (MADIT) II conundrum. Circulation. 2004;110:1885-1889.
41 Chow T, Kereiakes DJ, Bartone C, et al. Microvolt T-wave alternans identifies patients with ischemic cardiomyopathy who benefit from implantable cardioverter-defibrillator therapy. J Am Coll Cardiol. 2007;49:50-58.
42 Costantini O, Hohnloser SH, Kirk MM, et al. The ABCD (Alternans Before Cardioverter Defibrillator) Trial: Strategies using T-wave alternans to improve efficiency of sudden cardiac death prevention. J Am Coll Cardiol. 2009;53:471-479.
43 Amit G, Rosenbaum DS, Super DM, Costantini O. Microvolt T-wave alternans and electrophysiologic testing predict distinct arrhythmia substrates: Implications for identifying patients at risk for sudden cardiac death. Heart Rhythm. 2010;7:763-768.
44 Exner DV, Kavanagh KM, Slawnych MP, et al. Noninvasive risk assessment early after a myocardial infarction the REFINE study. J Am Coll Cardiol. 2007;50:2275-2284.
45 Huikuri HV, Raatikainen MJ, Moerch-Joergensen R, et al. Prediction of fatal or near-fatal cardiac arrhythmia events in patients with depressed left ventricular function after an acute myocardial infarction. Eur Heart J. 2009;30:689-698.
46 Chow T, Kereiakes DJ, Onufer J, et al. Does microvolt T-wave alternans testing predict ventricular tachyarrhythmias in patients with ischemic cardiomyopathy and prophylactic defibrillators? The MASTER (Microvolt T Wave Alternans Testing for Risk Stratification of Post-Myocardial Infarction Patients) trial. J Am Coll Cardiol. 2008;52:1607-1615.
47 Gold MR, Ip JH, Costantini O, et al. The role of microvolt T-wave alternans to assess arrhythmia vulnerability among patients with heart failure and systolic function: Primary results from the TWA SCD-HeFT substudy. Circulation. 2008;118(20):2022-2028.
48 Rosenbaum DS. T-wave alternans in the sudden cardiac death in heart failure trial population: Signal or noise? Circulation. 2008;118:2015-2018.
49 Hohnloser SH, Ikeda T, Cohen RJ. Evidence regarding clinical use of microvolt T-wave alternans. Heart Rhythm. 2009;6:S36-S44.
50 Klingenheben T, Zabel M, D’Agostino RB, et al. Predictive value of T-wave alternans for arrhythmic events in patients with congestive heart failure. Lancet. 2000;356:651-652.
51 Adachi K, Ohnishi Y, Shima T, et al. Determinant of microvolt-level T-wave alternans in patients with dilated cardiomyopathy. J Am Coll Cardiol. 1999;34:374-380.
52 Salerno-Uriarte JA, De Ferrari GM, Klersy C, et al. Prognostic value of T-wave alternans in patients with heart failure due to nonischemic cardiomyopathy: Results of the ALPHA Study. J Am Coll Cardiol. 2007;50:1896-1904.
53 Cantillon DJ, Stein KM, Markowitz SM, et al. Predictive value of microvolt T-wave alternans in patients with left ventricular dysfunction. J Am Coll Cardiol. 2007;50:166-173.
54 Ikeda T, Yoshino H, Sugi K, et al. Predictive value of microvolt T-wave alternans for sudden cardiac death in patients with preserved cardiac function after acute myocardial infarction: Results of a collaborative cohort study. J Am Coll Cardiol. 2006;48:2268-2274.
55 Momiyama Y, Hartikainen J, Nagayoshi H, et al. Exercise-induced T-wave alternans as a marker of high risk in patients with hypertrophic cardiomyopathy. Jpn Circ J. 1997;61(8):650-656.
56 Puntmann VO, Yap YG, McKenna W, Camm J. T-wave alternans and left ventricular wall thickness in predicting arrhythmic risk in patients with hypertrophic cardiomyopathy. Circ J. 2010;74:1197-1204.
57 Nemec J, Ackerman MJ, Tester DJ, et al. Catecholamine-provoked microvoltage T wave alternans in genotyped long QT syndrome. Pacing Clin Electrophysiol. 2003;26:1660-1667.
58 Ikeda T, Takami M, Sugi K, et al. Noninvasive risk stratification of subjects with a Brugada-type electrocardiogram and no history of cardiac arrest. Ann Noninvasive Electrocardiol. 2005;10:396-403.
59 Kirchhof P, Eckardt L, Rolf S, et al. T wave alternans does not assess arrhythmic risk in patients with Brugada syndrome. Ann Noninvasive Electrocardiol. 2004;9:162-165.
Signal-Averaged Electrocardiography
60 El-Sherif N, Gough WB, Restivo M. Electrophysiologic correlates of ventricular late potentials. In: El-Sherif N, Turitto G, editors. High-resolution electrocardiography. Mount Kisco, NY: Futura, 1992.
61 Simson MB. Use of signals in the terminal QRS complex to identify patients with ventricular tachycardia after myocardial infarction. Circulation. 1981;64:235-241.
62 Breithardt G, Cain ME, El-Sherif N, et al. Standards for analysis of ventricular late potentials using high-resolution or signal-averaged electrocardiography: A statement by a Task Force Committee of the European Society of Cardiology, the American Heart Association, and the American College of Cardiology. J Am Coll Cardiol. 1991;17:999-1006.
63 Cain ME. Signal-averaged electrocardiography. ACC expert consensus document. J Am Coll Cardiol. 1996;27:238-249.
64 Goldberger JJ, Cain ME, Hohnloser SH, et al. American Heart Association/American College of Cardiology Foundation/Heart Rhythm Society scientific statement on noninvasive risk stratification techniques for identifying patients at risk for sudden cardiac death: A scientific statement from the American Heart Association Council on Clinical Cardiology Committee on Electrocardiography and Arrhythmias and Council on Epidemiology and Prevention. J Am Coll Cardiol. 2008;52:1179-1199.
65 Marcus FI, Zareba W, Sherrill D. Evaluation of the normal values for signal-averaged electrocardiogram. J Cardiovasc Electrophysiol. 2007;18:231-233.
66 Steinbigler P, Haberl R, Bruggeman T, et al. Postinfarction risk assessment for sudden cardiac death using late potential analysis of the digital Holter electrocardiogram. J Cardiovasc Electrophysiol. 2002;13:1227-1232.
67 Rashba EJ, Lamas GA, Couderc JP, et al. Electrophysiological effects of late percutaneous coronary intervention for infarct-related coronary artery occlusion: The Occluded Artery Trial—Electrophysiological Mechanisms (OAT-EP). Circulation. 2009;119:779-787.
68 Vazquez R, Caref EB, Torres F, et al. Reproducibility of time-domain and three different frequency-domain techniques for the analysis of the signal-averaged electrocardiogram. J Electrocardiol. 2000;33:99-105.
69 Gomes AJ, Winters SL, Martinson M, et al. The prognostic significance of quantitative signal-averaged variables relative to clinical variables, site of myocardial infarction, ejection fraction and ventricular premature beats: A prospective study. J Am Coll Cardiol. 1989;13:377-384.
70 Turitto G, Abdulah R, Benson D, El-Sherif N. Signal averaged electrocardiogram. In: Gussak I, Antzelevitch C, editors. Electrical diseases of the heart. Genetics, mechanisms, treatment, prevention. London, UK: Springer-Verlag London Limited, 2008.
71 Bailey JJ, Berson AS, Handelsman H, Hodges M. Utility of current risk stratification tests for predicting major arrhythmic events after myocardial infarction. J Am Coll Cardiol. 2001;38:1902-1911.
72 El-Sherif N, Denes P, Katz R, et al. Definition of the best prediction criteria of the time domain signal-averaged electrocardiogram for serious arrhythmic events in the postinfarction period. J Am Coll Cardiol. 1995;25:908-914.
73 Huikuri HV, Raatikainen MJP, Moerch-Joergensen R, et al. Prediction of fatal or near-fatal cardiac arrhythmia events in patients with depressed left ventricular function after an acute myocardial infarction. Eur Heart J. 2009;30:689-698.
74 Turitto G, Fontaine JM, Ursell SN, et al. Value of the signal-averaged electrocardiogram as a predictor of the results of programmed stimulation in nonsustained ventricular tachycardia. Am J Cardiol. 1988;61:1272-1278.
75 Turitto G, Ahuja R, Bekheit S, et al. Incidence and prediction of induced ventricular tachyarrhythmias in idiopathic dilated cardiomyopathy. Am J Cardiol. 1994;73:770-773.
76 Gomes JA, Cain ME, Buxton AE, et al. Prediction of long-term outcomes by signal-averaged electrocardiography in patients with unsustained ventricular tachycardia, coronary artery disease, and left ventricular dysfunction. Circulation. 2001;104:436-441.
77 Turitto G, Ahuja RK, Caref EB, et al. Risk stratification for arrhythmic events in patients with nonischemic dilated cardiomyopathy and nonsustained ventricular tachycardia: Role of programmed ventricular stimulation and the signal-averaged electrocardiogram. J Am Coll Cardiol. 1994;24:1523-1528.
78 Grimm W, Christ M, Bach J, et al. Noninvasive arrhythmia risk stratification in idiopathic dilated cardiomyopathy: Results of the Marburg Cardiomyopathy Study. Circulation. 2003;108:2883-2891.